Mac Monitor Analytics Report
This topic provides an overview of the MAC Monitor Analytics report you can generate in the GUI. To learn how to generate this report, see Generate Analytics Report.
Overview of EVPN Type-2 Route Distribution
This topic analyzes EVPN Type-2 MAC address activity across the network. It highlights patterns in active and missing MAC address routes and their changes over time.
- Active MAC Address Distribution
- Virtual Growth Over Time for Top 25 Virtual Networks
- Virtual Networks Size Comparison by Routing Zone
- Active MAC Address Distribution Across Devices (Top 3 VN)
- Missing MAC Count Observation
- Active and Missing MAC Address Counts
Active MAC Address Distribution
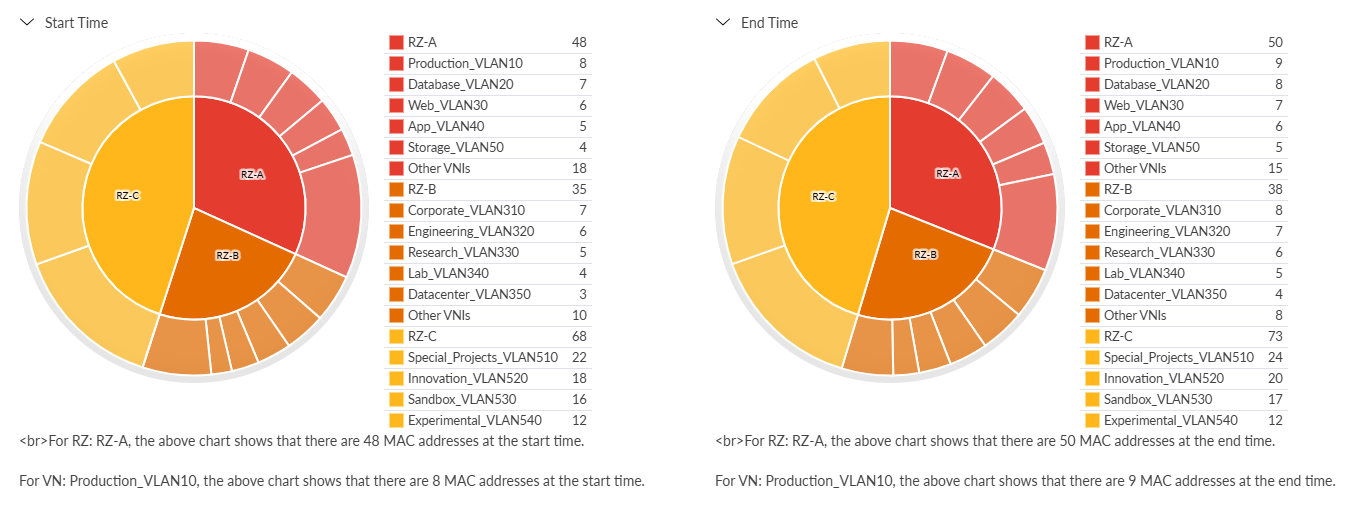
The Active MAC Address Distribution section shows how MAC addresses are distributed by Routing Zones (RZs) and Virtual Networks (VNs), offering an intuitive view of how MAC addresses are organized within the network fabric.
Figure 1 displays two sunburst charts: one for start time and
another for end time. The charts show three routing zones: red (RZ-A), orange
(RZ-B), and yellow (RZ-C). The inner ring shows the number of MAC addresses per
routing zone, while the outer ring shows the number of MAC addresses per virtual
network (VN). For example, Routing Zone: RZ-A has 48 MAC
addresses at start time and 50 MAC addresses at end time.
PRODUCTION_VLAN10 has 8 MAC addresses at start time and 9
MAC addresses at end time.
Virtual Growth Over Time for Top 25 Virtual Networks
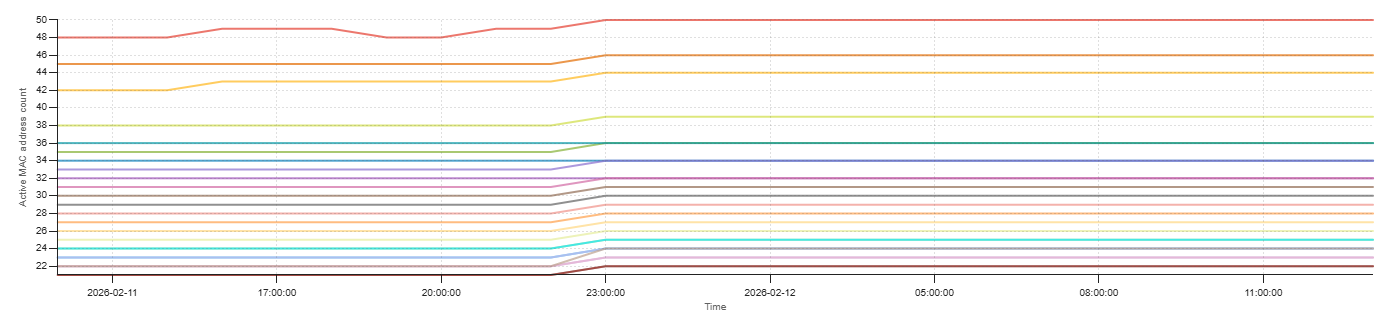
This section tracks MAC address changes across Routing Zones (RZs) and helps you identify expanding or contracting virtual networks based on MAC activity. The line chart in Figure 2 illustrates the virtual network's growth over time. This example highlights the top 25 networks based on MAC address count.
Virtual Networks Size Comparison by Routing Zone
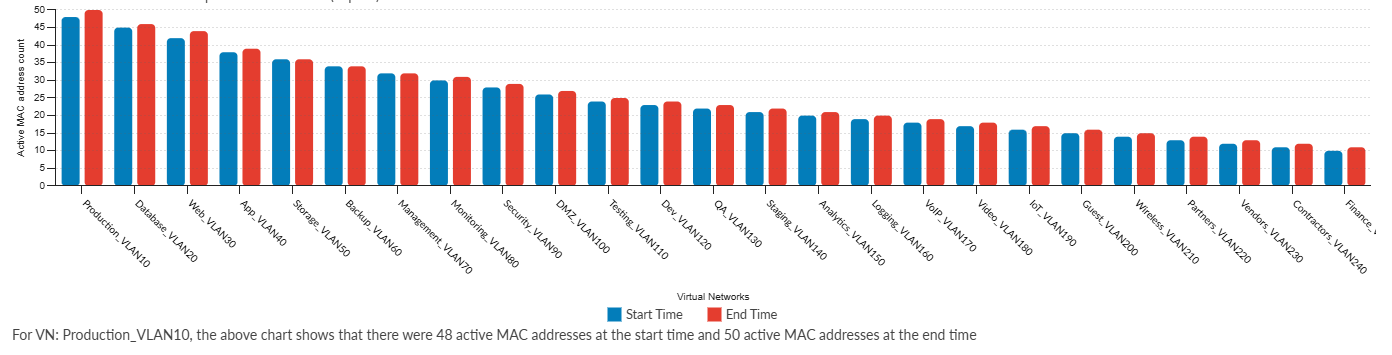
This section compares MAC address counts between each virtual network for each routing zone.
-
The bar chart in Figure 3 shows MAC address counts for VN:
PRODUCTION_VLAN10, beginning with 48 active MAC addresses and ending with 50. -
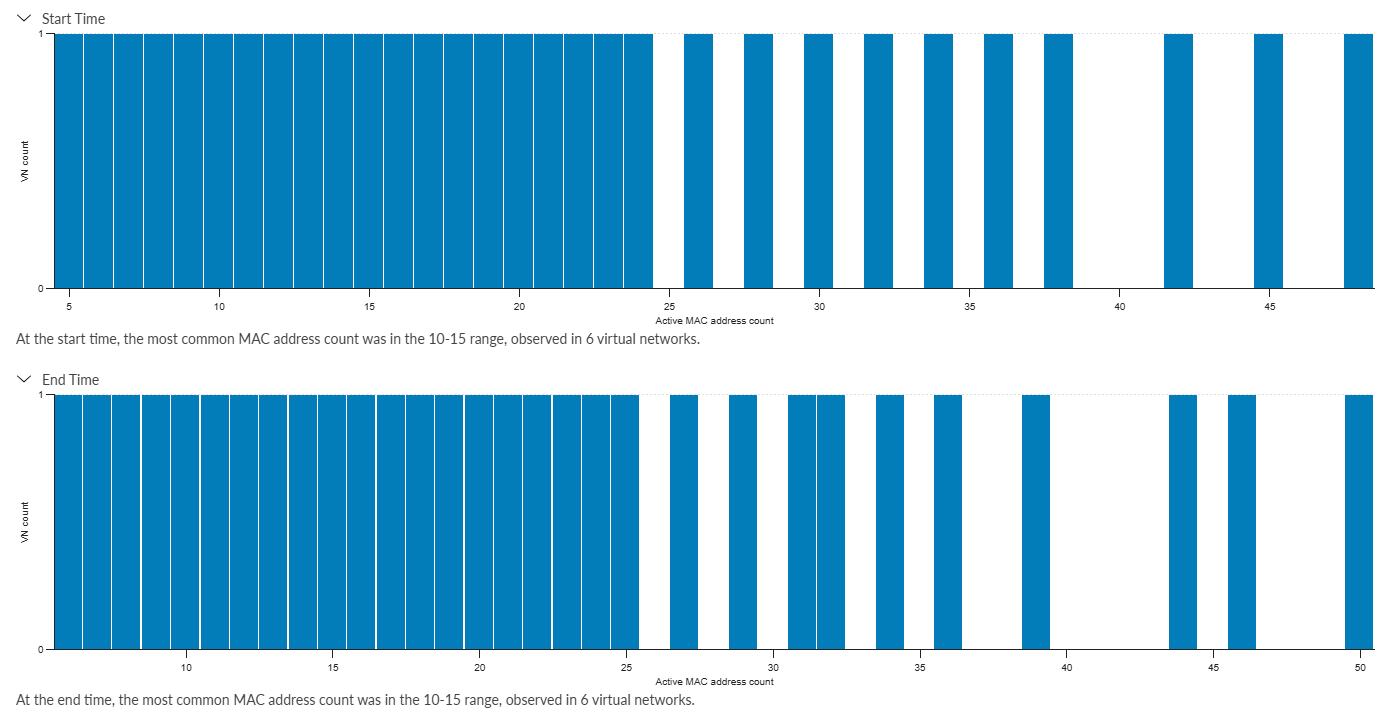
The histogram in Figure 4 shows MAC address count distribution across all virtual networks in RZ-A and the number of networks in various count ranges. At both start and end times, 6 virtual networks had MAC address counts in the 10-15 range.
This example uses Routing Zone: A, however the process applies to all routing zones
Active MAC Address Distribution Across Devices (Top 3 VN)
This section explains the distribution of active MAC addresses across the top 3 VNs and devices. A histogram illustrates this distribution for the selected routing zone and virtual network.
-
The x-axis shows the number of active MAC addresses learned on a device.
-
The y-axis indicates how many devices fall into each MAC address count range.
The Top 3 VNs are chosen based on the highest nonzero active MAC address count at the user-selected time.
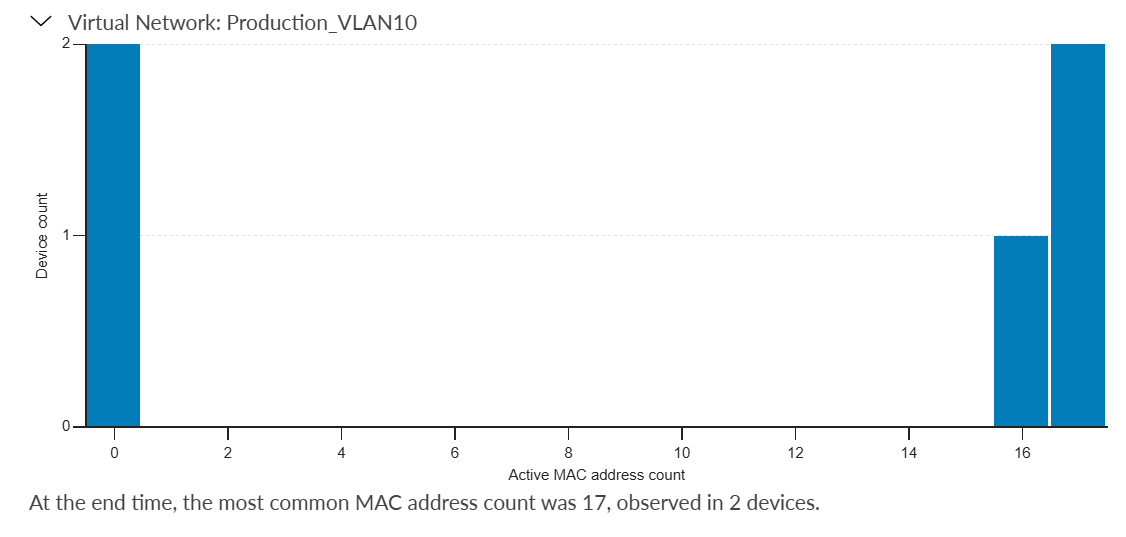
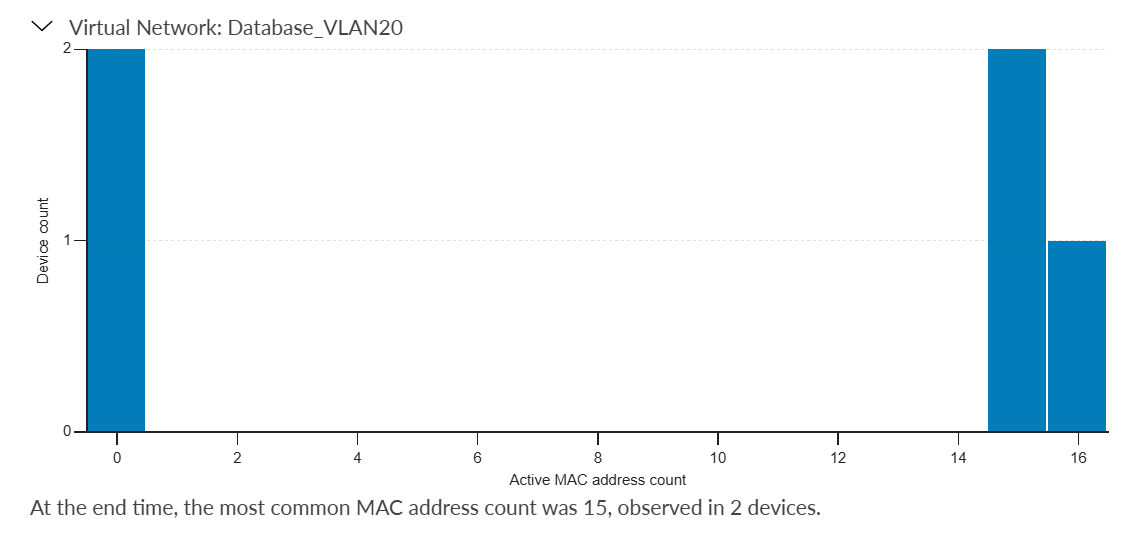
For example: Figure 5 shows a histogram for Routing Zone: A.
Production_VLAN10 has 17 MAC addresses in two devices at
end time. Database_VLAN20 has 15 MAC addresses in two devices
at end time.
Missing MAC Count Observation
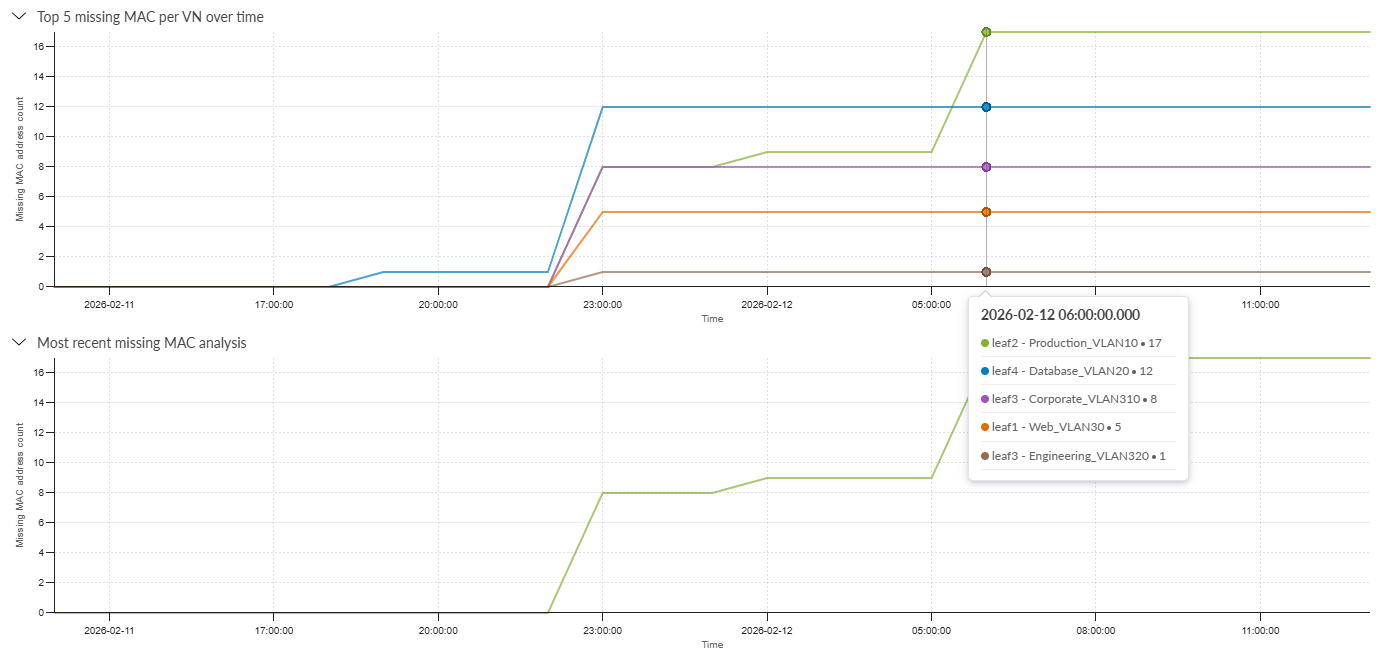
This section tracks virtual networks with missing MAC addresses and their progression over time. It highlights the top five virtual networks with the most missing MAC entries. Figure 6 shows an example. You can hover over the chart to see the details for each VLAN. The second line chart shows the virtual network where the most recent missing MAC was found.
Active and Missing MAC Address Counts
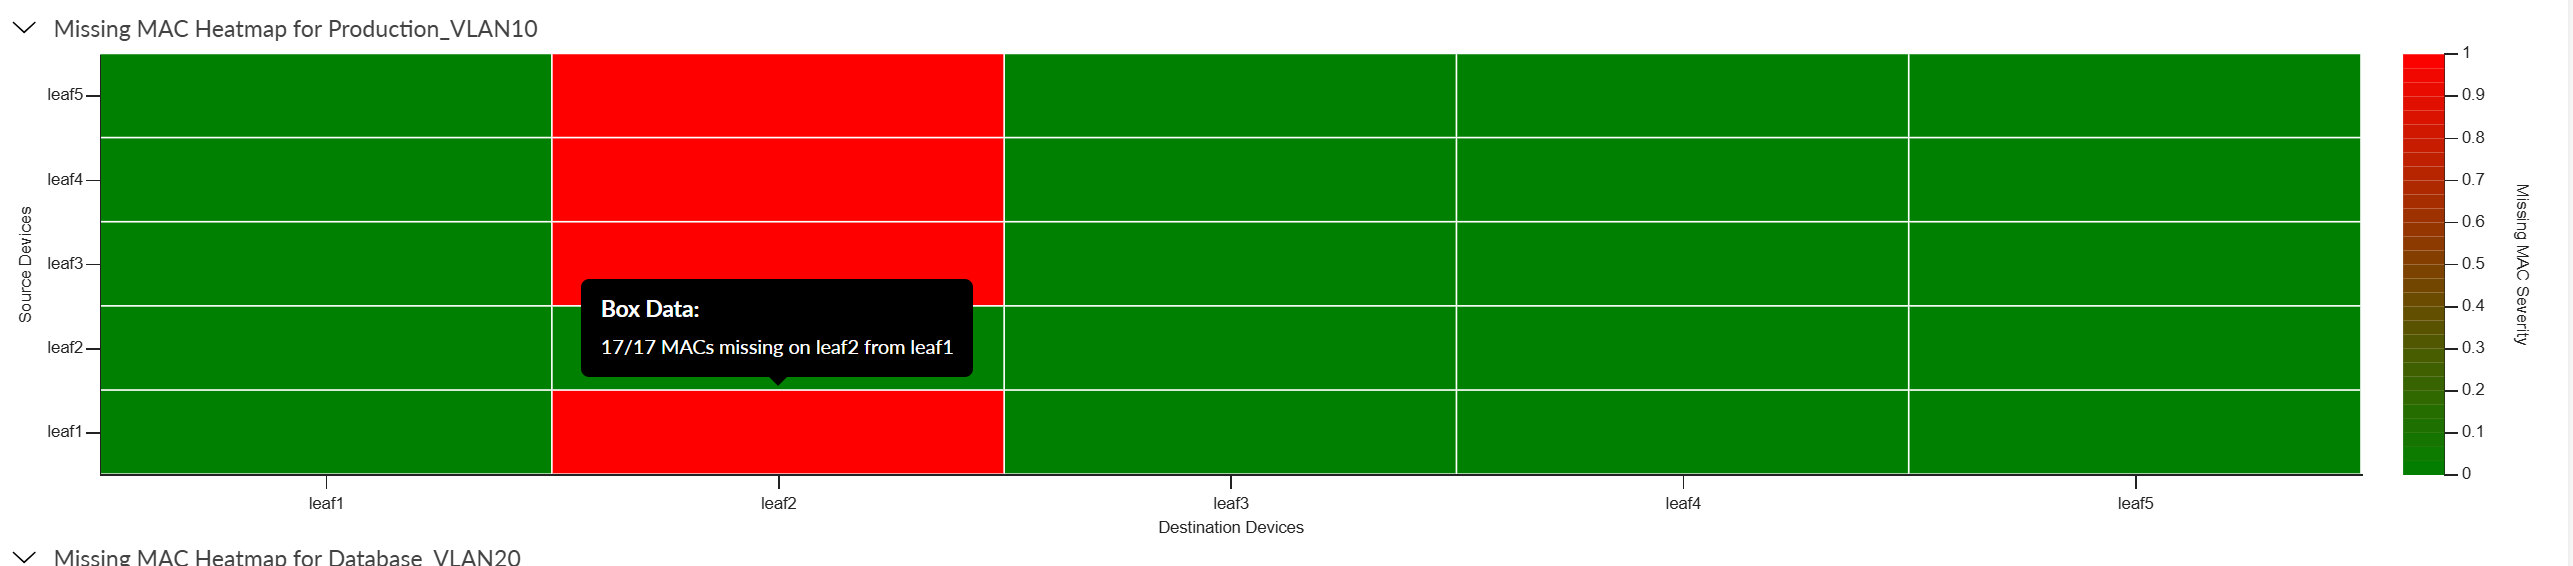
This section identifies devices with possible MAC address propagation issues. A heatmap shows missing MAC proportions between device pairs for the top 5 virtual networks. Each cell shows the fraction of missing MACs relative to the total expected MAC count for the source device. Higher values indicate more missing MACs. The heatmap uses the first snapshot data available after the user-defined start time.
Figure 7 shows a heatmap for Production_VLAN10. In
this example, 17 MAC addresses are missing on leaf2 (destination) from leaf1,
leaf3, leaf4 and leaf5 (source leaf devices). This pattern indicates a potential
MAC propagation issue on leaf2 in Production_VLAN10.
Communication between other device pairs remains largely green, indicating
healthy MAC distribution.