FEC Statistics Dashboard
The FEC statistics probe has an auto-enabled dashboard that monitors histogram bins
(Bin0 through Bin15) in a graph for interfaces that support FEC.
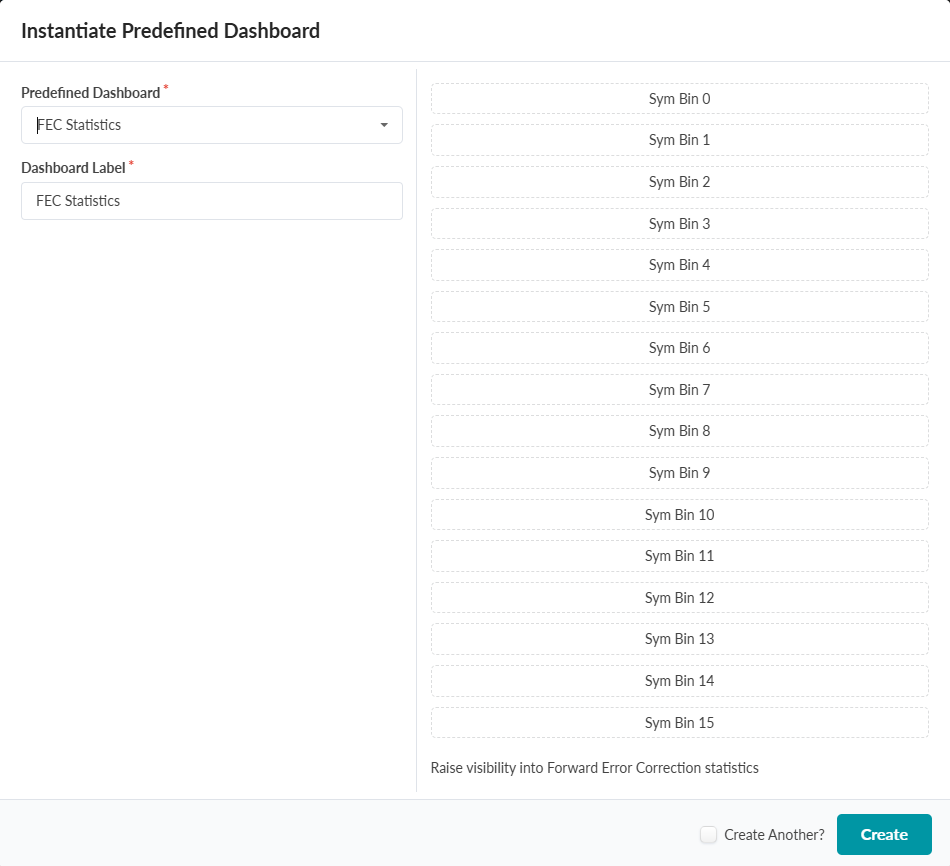
To create the dashboard:
-
Select FEC Statistics from the drop-down list and click
Create.
-
Click the Dashboard tab display the dashboard output for the FEC
Statistics probe.
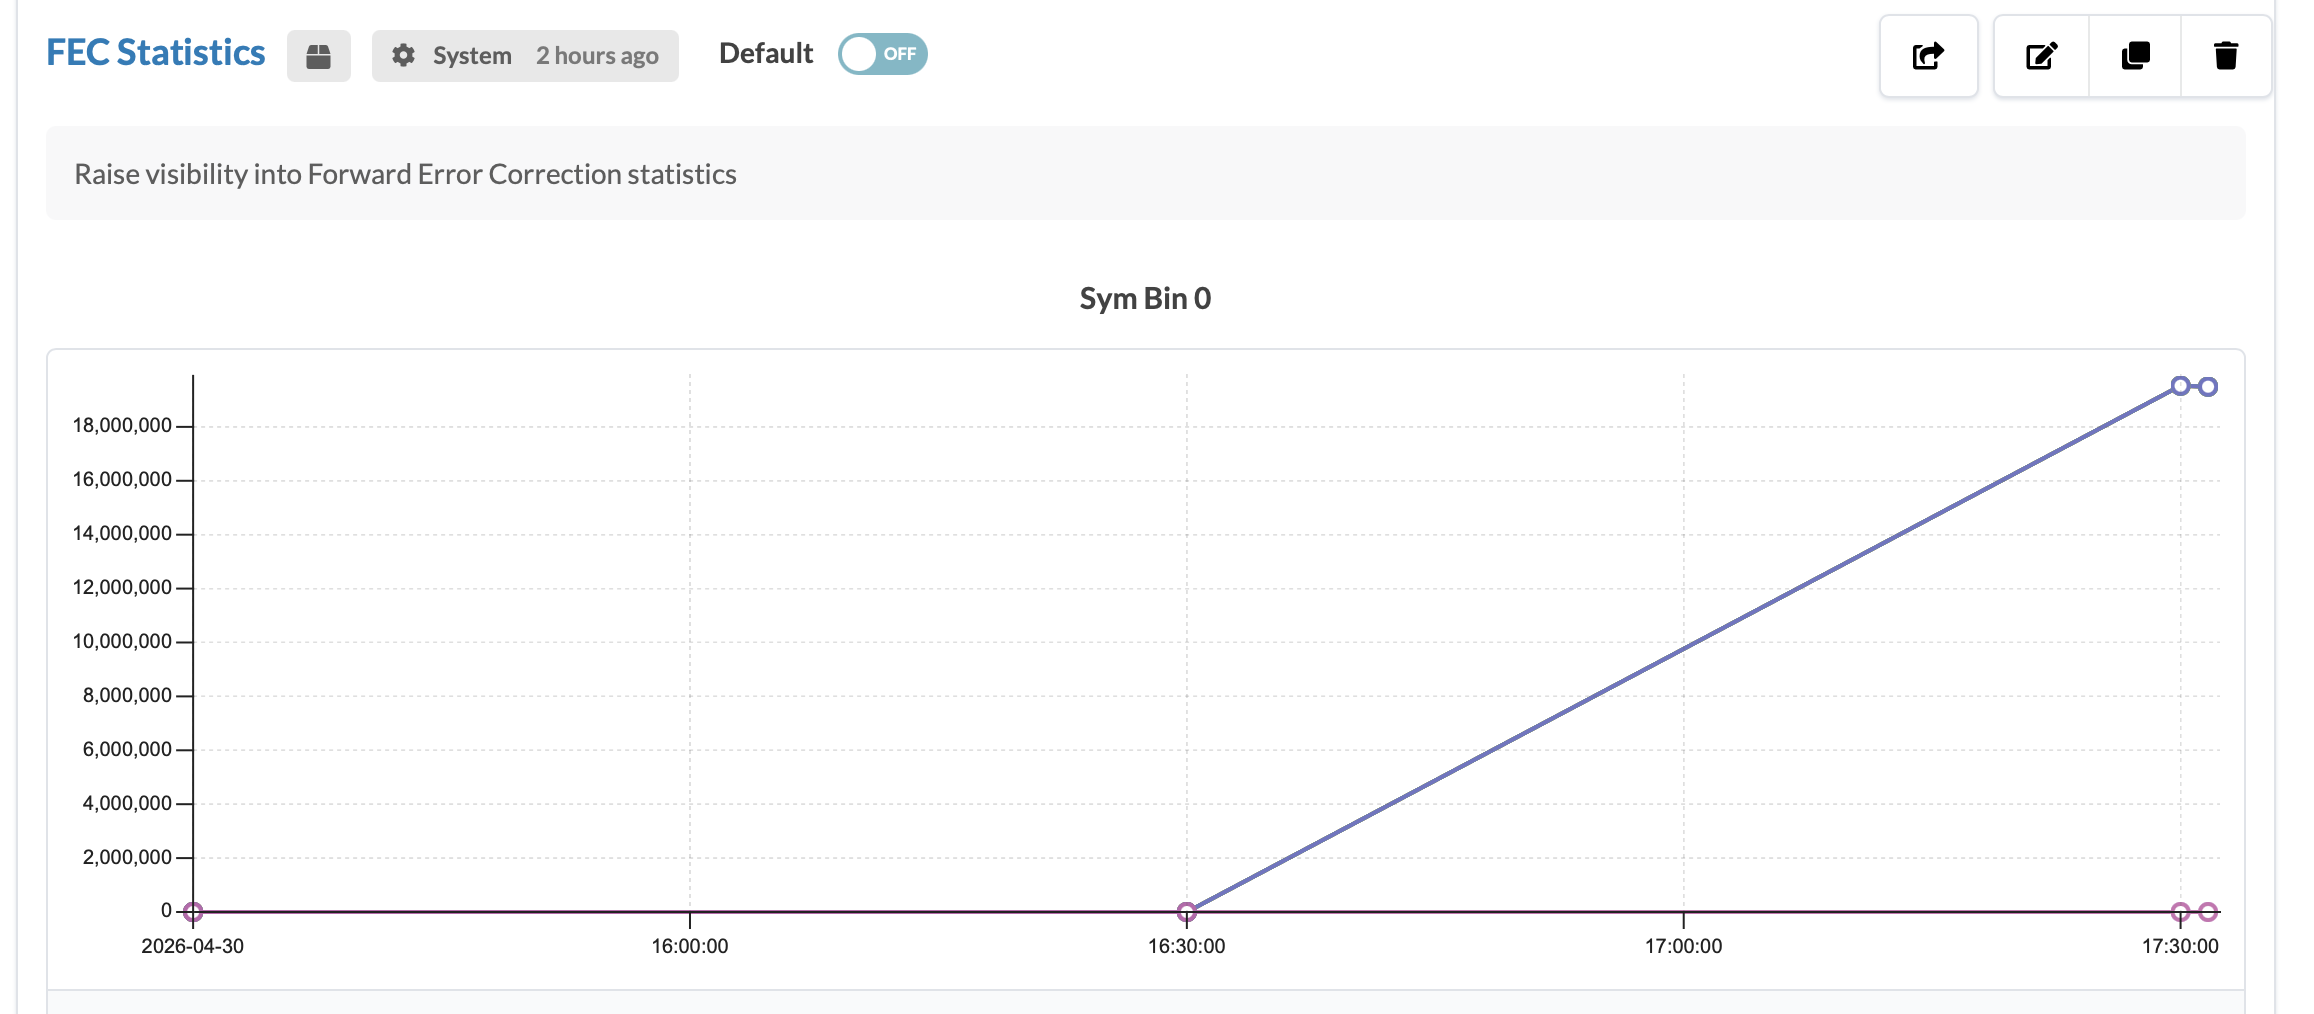
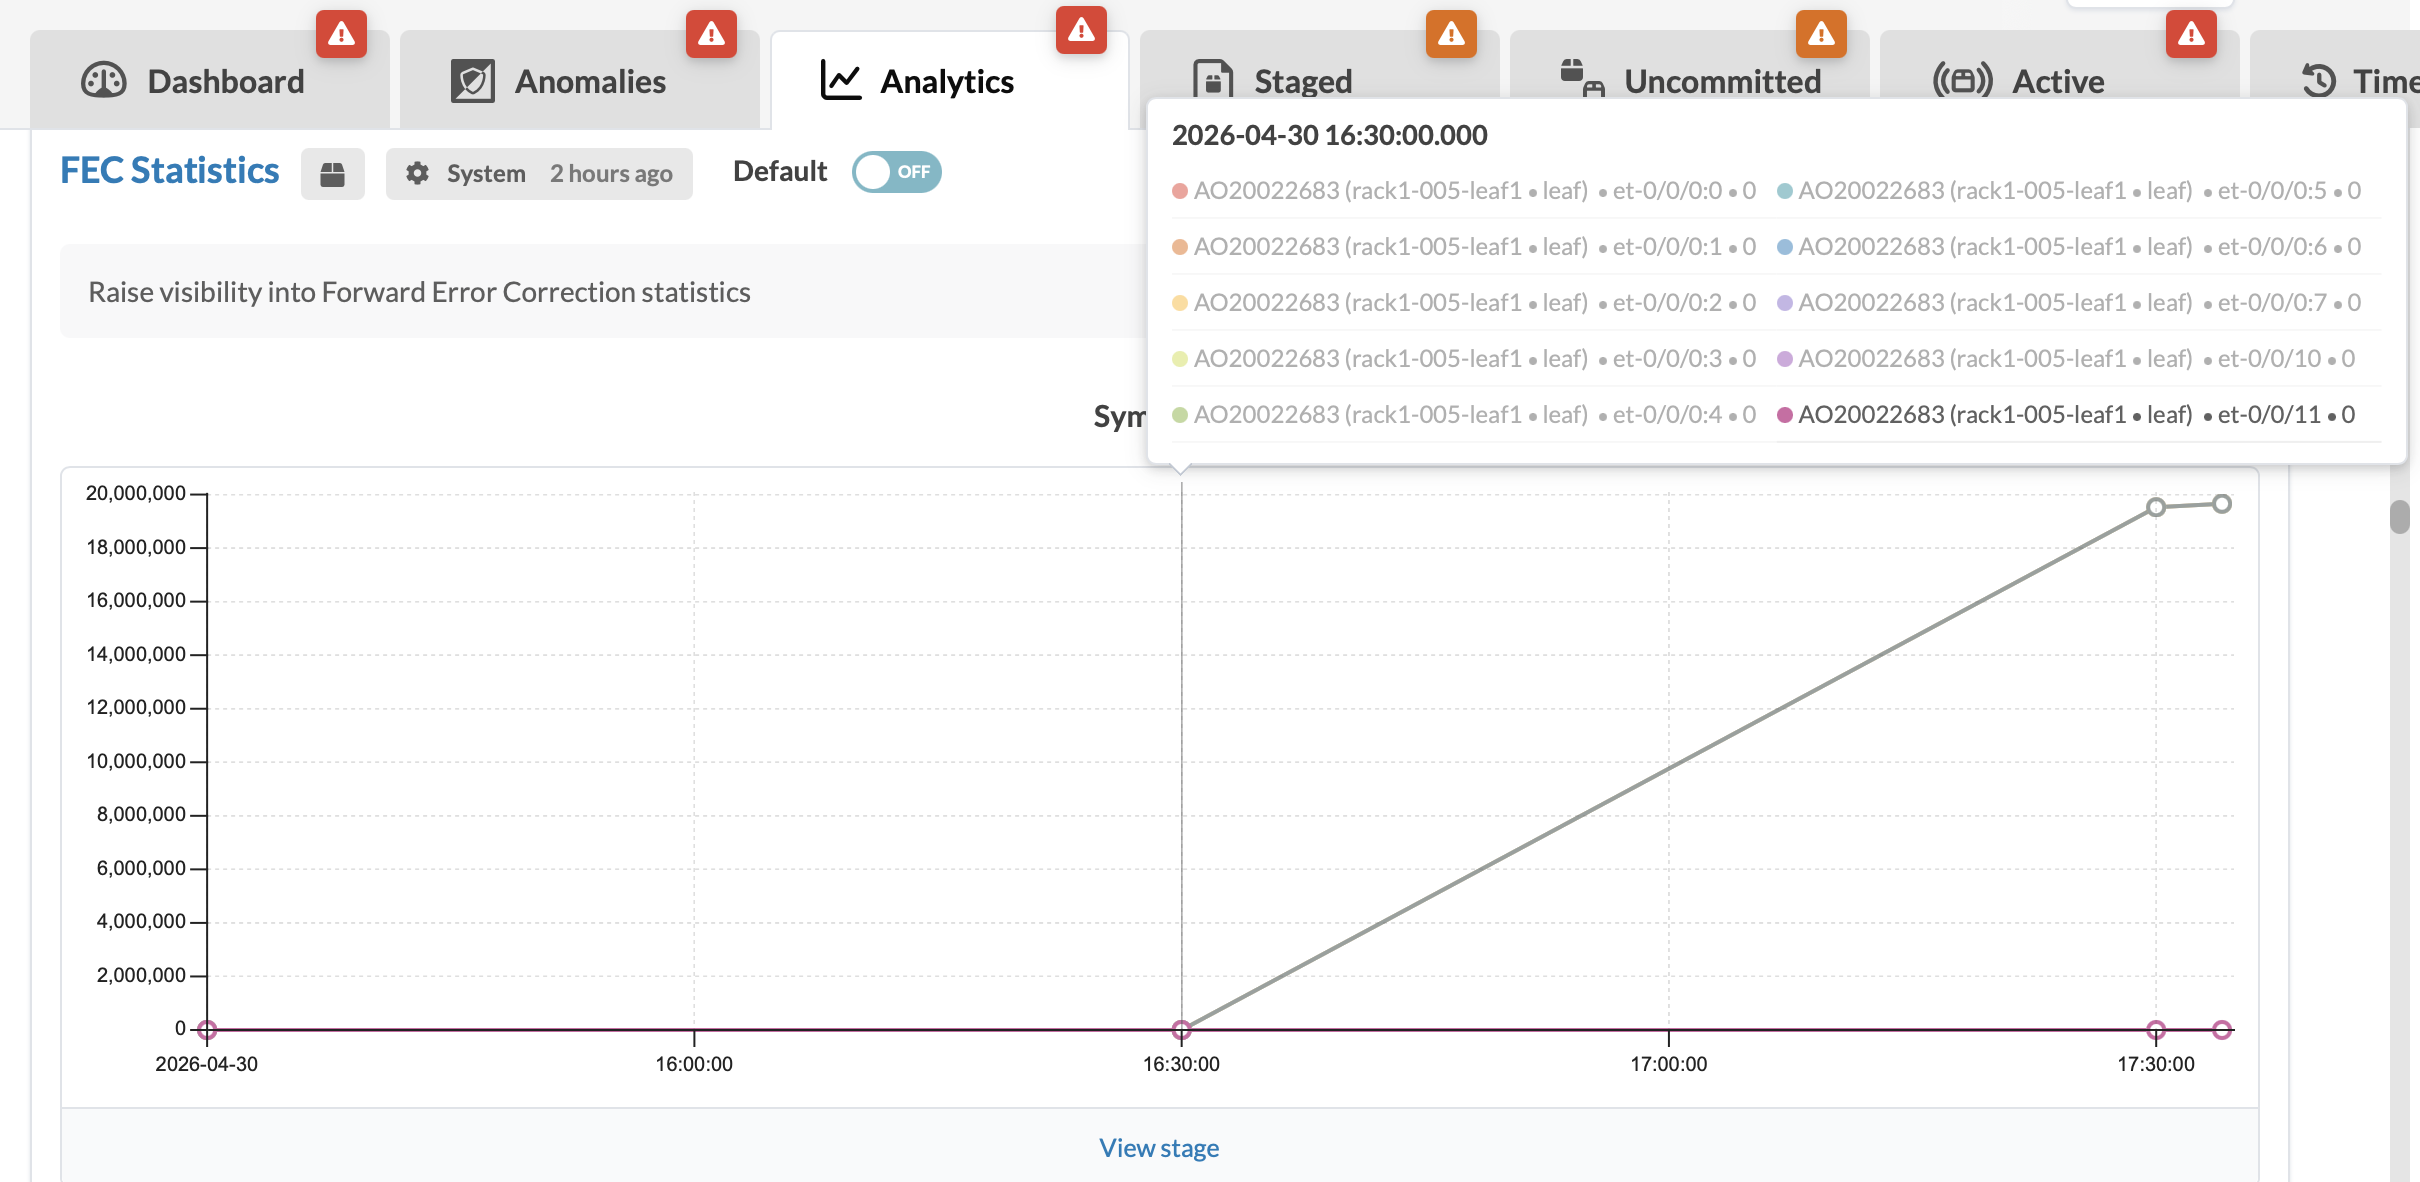
The graphs below show examples of two separate graphs for each Bin, ranging from Bin0 to Bin15. Hovering over a specific point on the graph displays the corresponding bin value for an interface. For additional details, click the View stage link under each graph to display the Processor: FEC Statistics page.