FEC Statistics Processor

The FEC Statistics Processor collects FEC statistics from network devices.
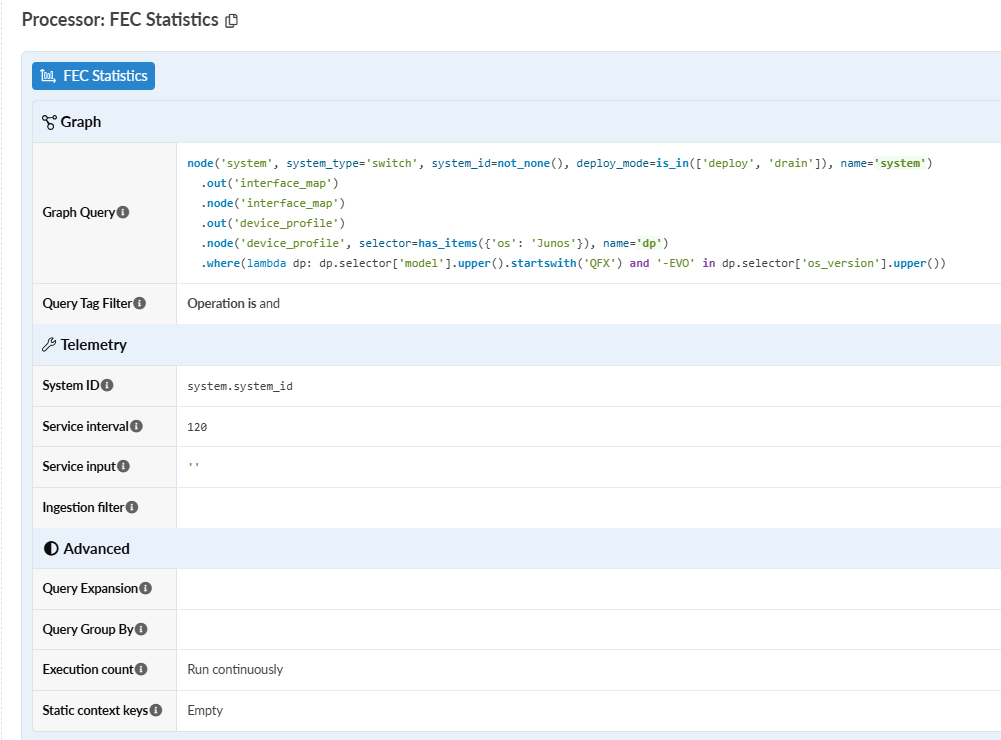
FEC Statistics interface for configuring network systems with sections for Graph, Telemetry, and Advanced settings. Includes query language, telemetry parameters, and execution options.

Table 1: FEC Statistics Settings
Settings Description

Graph

  • Graph Query: One or more queries to retrieve nodes for monitoring. Results from all queries are concatenated and must match the node names specified in the properties.

  • Graph Tag Filter: Filters named nodes in graph queries by assigned tags.

Telemetry

  • System ID: Expression mapping from graph query to a system_id, such as system.system_idif "system" is a name in the graph query.

  • Service interval: Telemetry collection interval in seconds. Can be an expression.

  • Service input: Data passed to telemetry collectors, if any. Can be an expression.

  • Ingestion filter: Defines what metric keys reported by a collector.

Advanced

  • Query Expansion: Each generator processes every path returned by graph queries. It produces a set of items and extends each path with a property name whose value corresponds to the item's value.

  • Query Group By: List of node and relationship names used to group graph query results. Names in this field (if specified) are accessible as variables in the processor. Others can be accessed through the group_items variable.

  • Execution count: Number of times the data is collected.

  • Static context keys: Key/value pairs that extend output stage properties. The value acts as an expression executed in the graph query, and its result becomes the property value for the key.

FEC Statistics Metrics

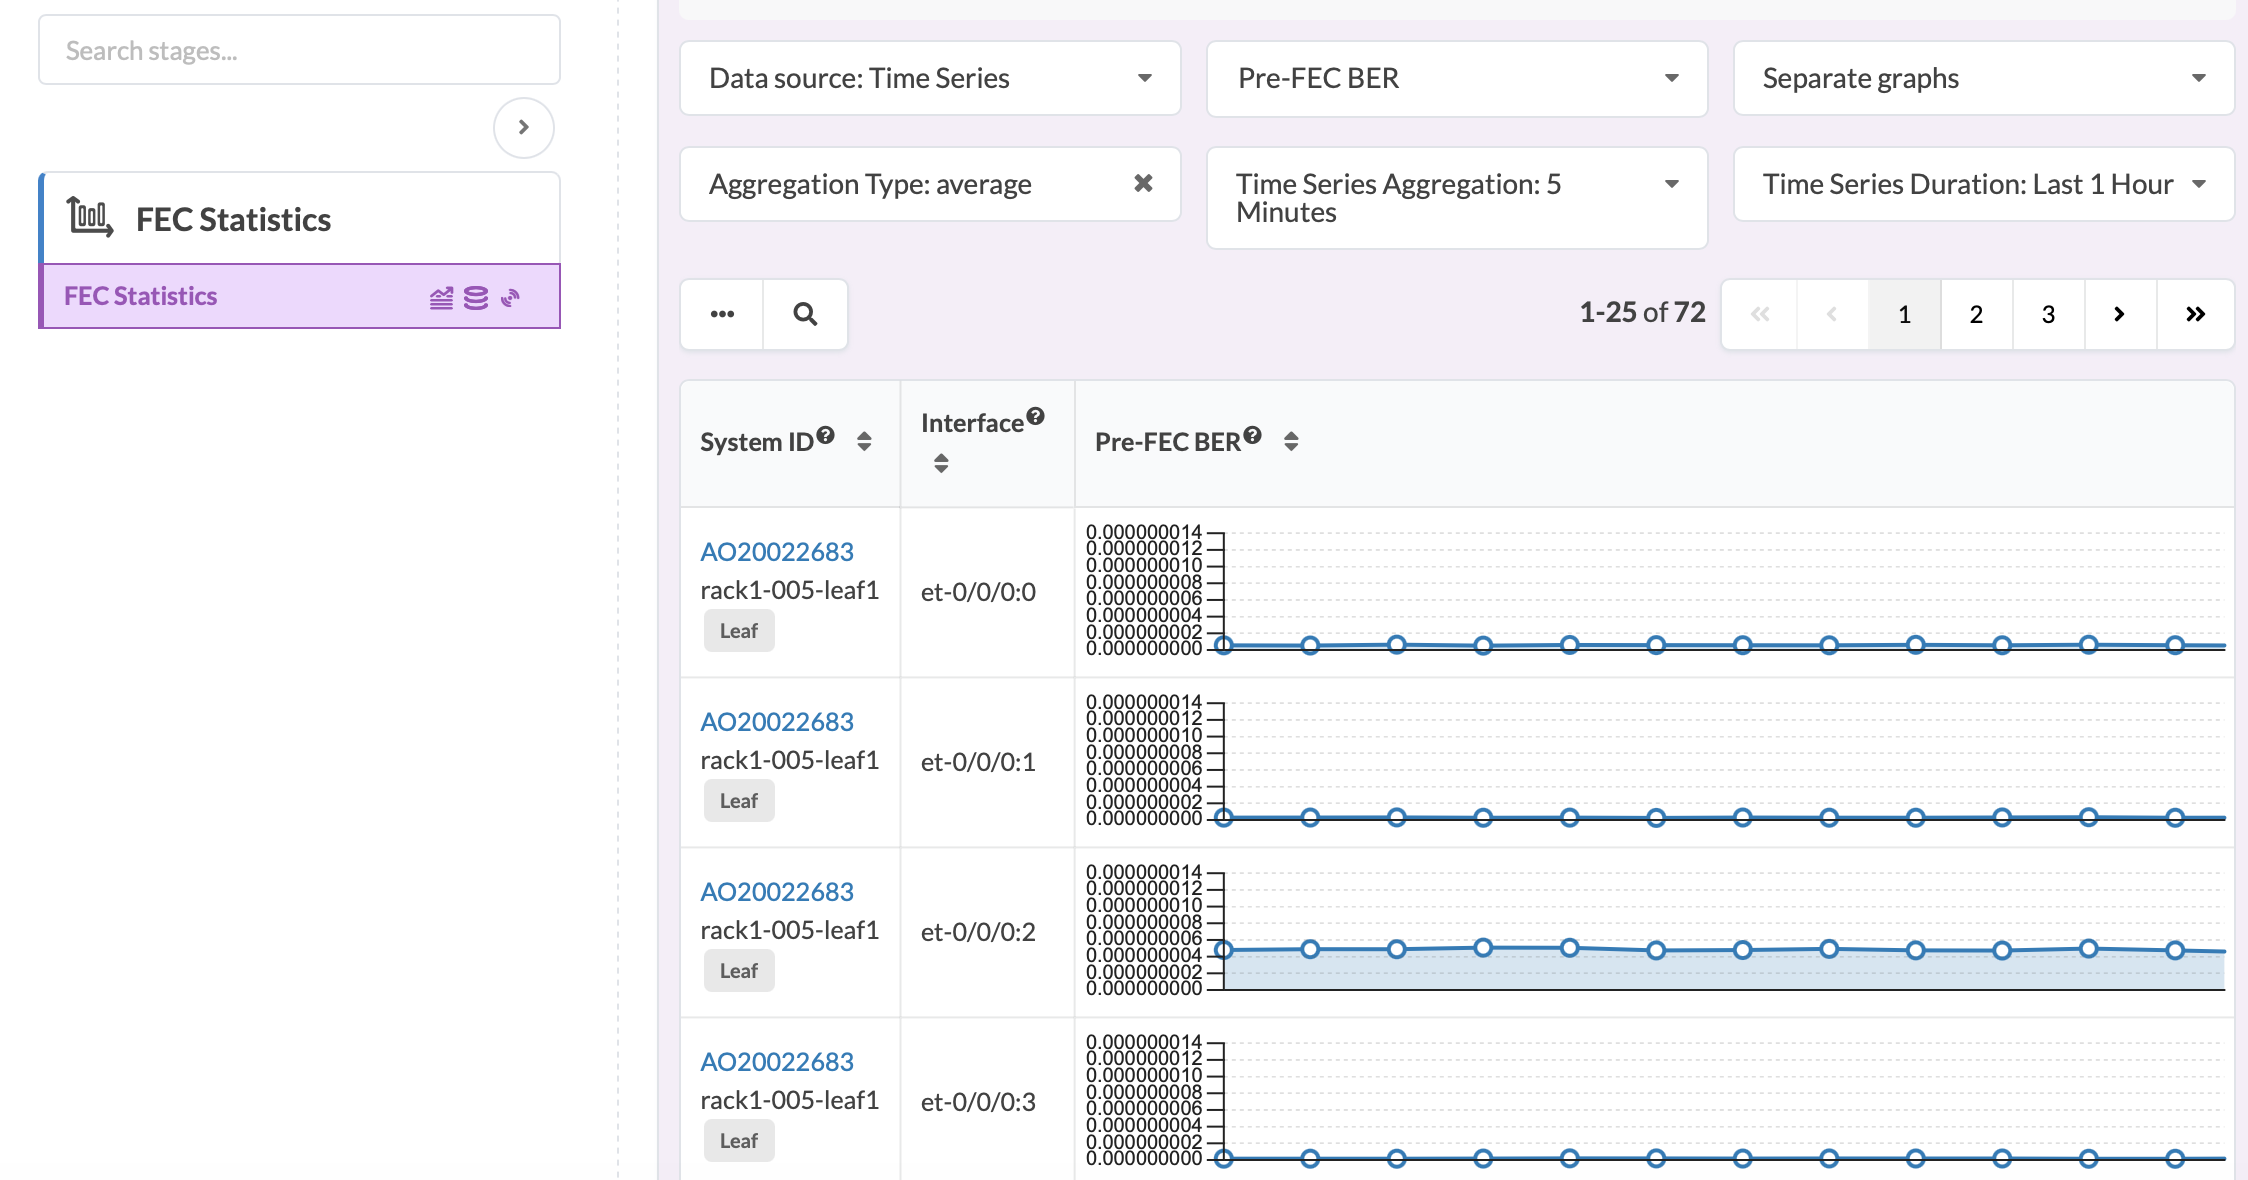
The processor shows example graphs for real-time and time-series metrics that track how measurements change over time, with real-time focusing on immediate processing and time-series focusing on sequential historical analysis.

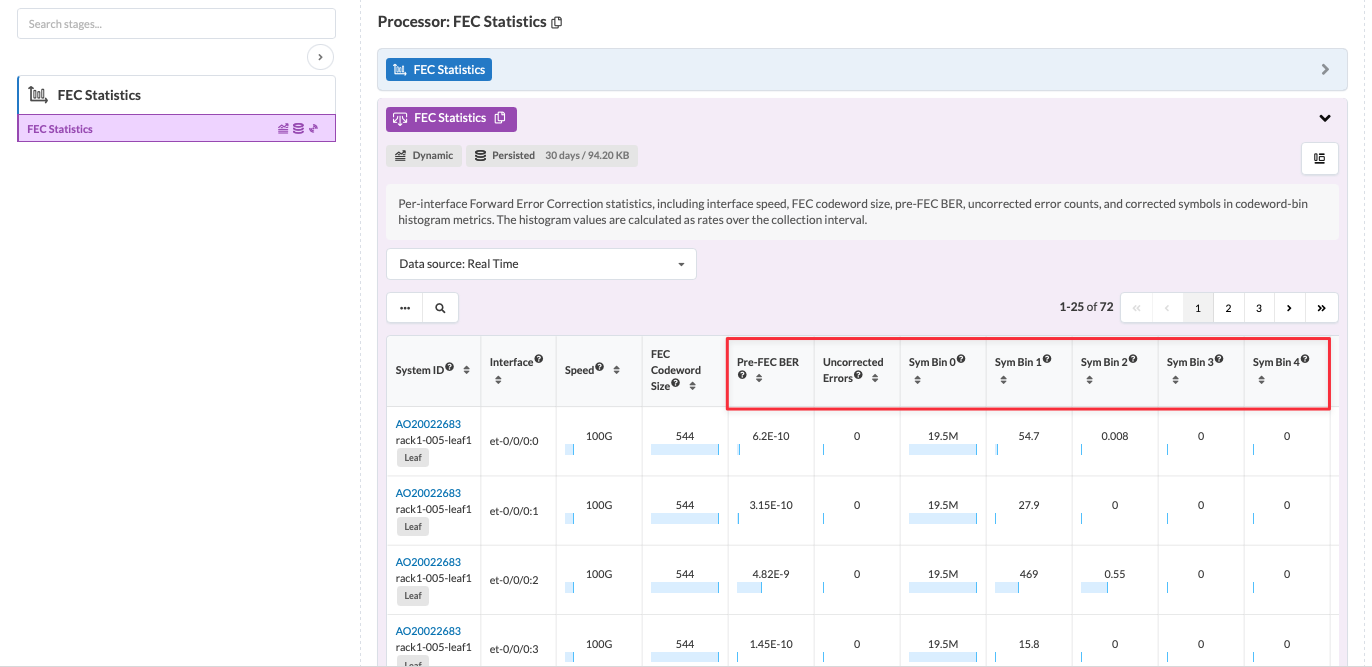
The metrics show per-interface FEC statistics, including interface speed, FEC codeword size, pre-FEC BER, uncorrected error counts, and corrected symbols in codeword-bin histogram metrics. The collected FEC histogram values are converted to a rate by calculating the delta per unit of time (with a default period of 2 minutes).

Note: All metrics are captured in single output stage.

Real Time Metrics

Monitoring interface displaying Forward Error Correction statistics, including system ID, network interface, speed, FEC codeword size, pre-FEC BER, uncorrected errors, and symbol bin metrics in a tabular format. Highlights error rates and symbol bins for network performance analysis.

Time Series Metrics

Dashboard interface for analyzing Forward Error Correction statistics, showing filters, settings, data table with system IDs and Pre-FEC BER values, and line graphs of BER trends over time.