Instantiate Predefined Probe

You can instantiate predefined intent-based analytics probes.

To instantiate a predefined probe using the Apstra GUI:
  1. From your blueprint, navigate to Analytics > Probes, click Create Probe, and select Instantiate Predefined Probe from the drop-down list.
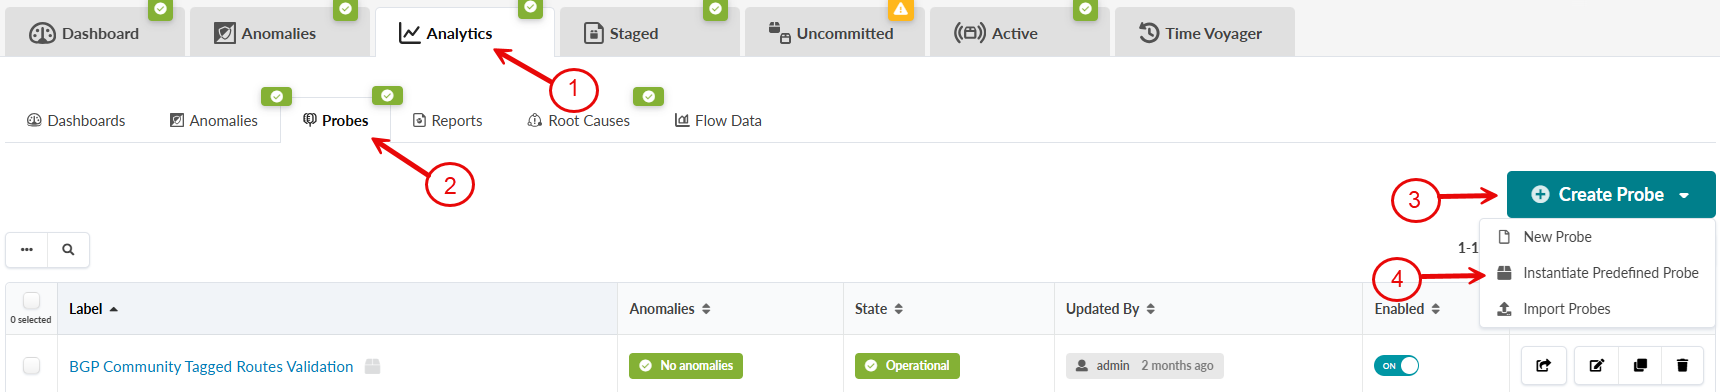
    User interface screenshot of a network monitoring tool showing a submenu under Analytics with Probes selected. Includes a Create Probe button, a table listing one probe labeled BGP Community Tagged Routes Validation with details such as no anomalies, operational state, updated by admin, enabled, and icons for editing, duplicating, or deleting. Red annotations highlight features for creating and managing probes.
    The Instantiate Predefined Probe window opens.
  2. Select a predefined probe from the drop-down list. Probe names must be unique. If you instantiate the same probe more than once, you'll need to change its name.
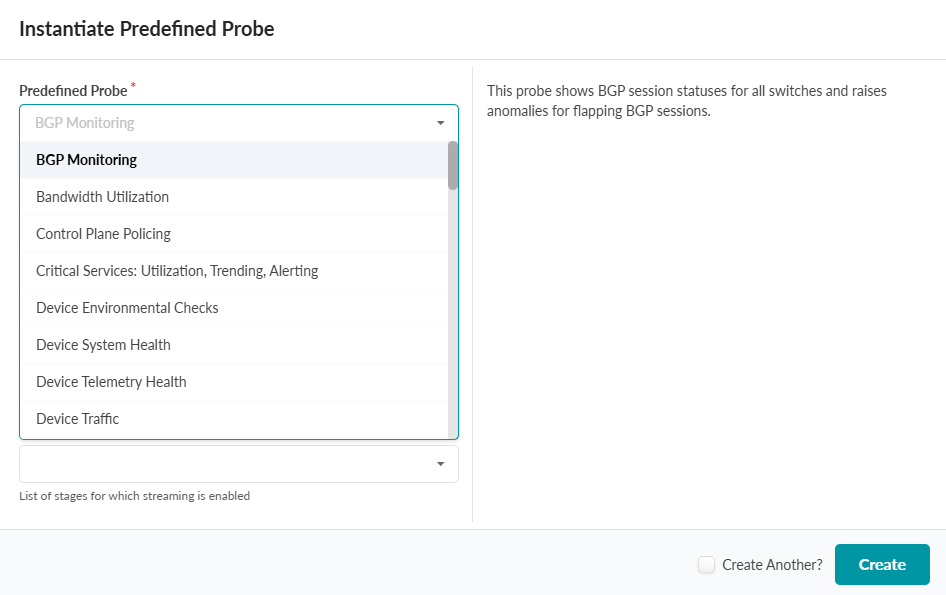
    User interface for selecting and creating predefined probes. Dropdown menu lists options like BGP Monitoring and Device System Health. Create button and Create Another option are visible.
  3. Configure the probe parameters as required.
    For parameter details specific to your probe, navigate to the Blueprint Analytics > Probes > Predefined Probe and select the probe. See the next section for information about the streaming stages parameter.
  4. Click Create to apply the configuration and instantiate the probe.
The probe is instantiated and you're returned to the table view.

Streaming Stages

Starting in Apstra Data Center Director 6.2, you can configure predefined probes for specific stages for data streaming without editing the probe pipeline. This parameter is available for all predefined probes during instantiation or when editing parameters of an existing instance. When specified, data streams from the configured stages to the designated receivers.

The following screenshot shows an example of the available streaming stages for the "Control Plane Policing" probe.
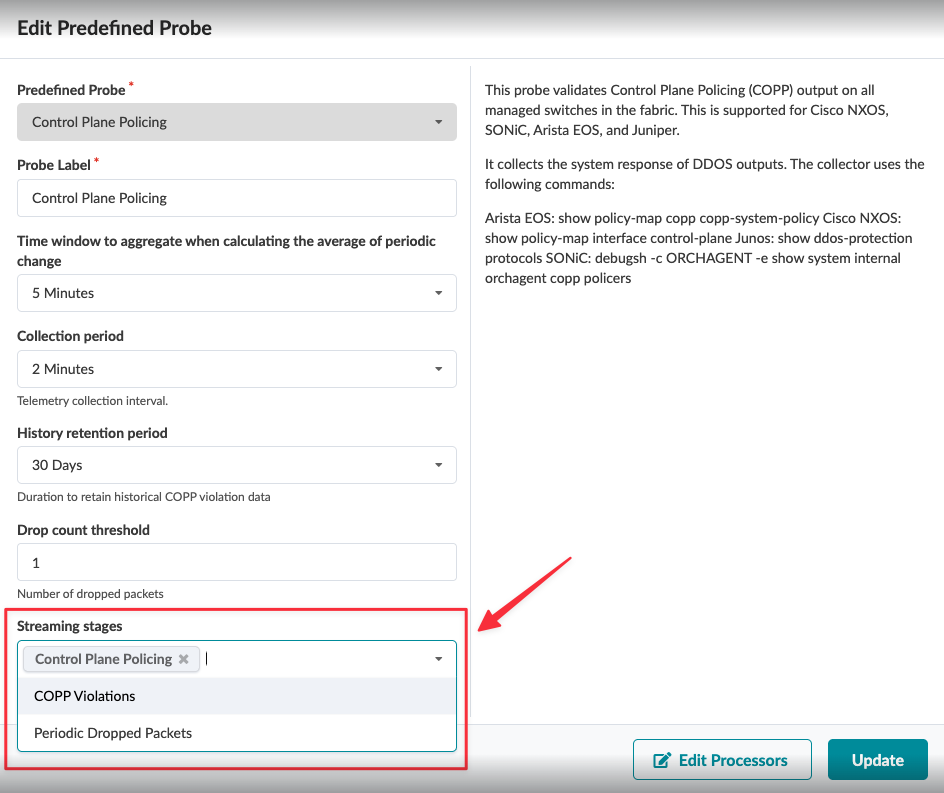
Configuration interface for editing a predefined probe for Control Plane Policing. Includes fields for probe type, label, time window, collection period, history retention, drop count threshold, and streaming stages. Provides probe description, supported systems, and collection commands. Buttons for editing processors and updating configuration.

See Stage Parameters for a list of parameters common to all stages.

Note: Apstra provides streaming support for all possible stages except for the MAC Processor.
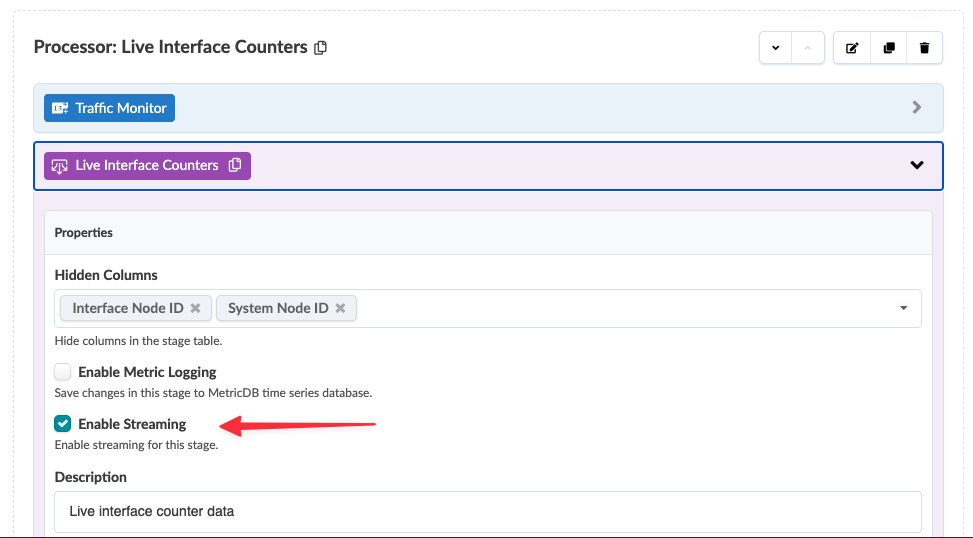
User interface for Live Interface Counters with sections for Traffic Monitor and Live Interface Counters. Hidden columns include Interface Node ID and System Node ID. Options for Metric Logging and Enable Streaming, with Enable Streaming checked. Description field mentions live interface counter data. Icons for editing and deleting actions.