Interfaces Introduction
Interfaces details in blueprints are in the interface table at Staged > Physical > Interfaces and in the interfaces section of specific routing zones at Staged > Virtual > Routing Zones.
Interface details are listed in an interfaces table in the blueprint. To go to the table, navigate to Staged > Physical > Interfaces. From the table, you can access additional details about the associated system node, links and the interface itself. You can tag physical interfaces and aggregated logical interfaces (port channels). Tags become part of the graph, which means you can use them for configuration. You can administratively disable and enable interfaces from the GUI.
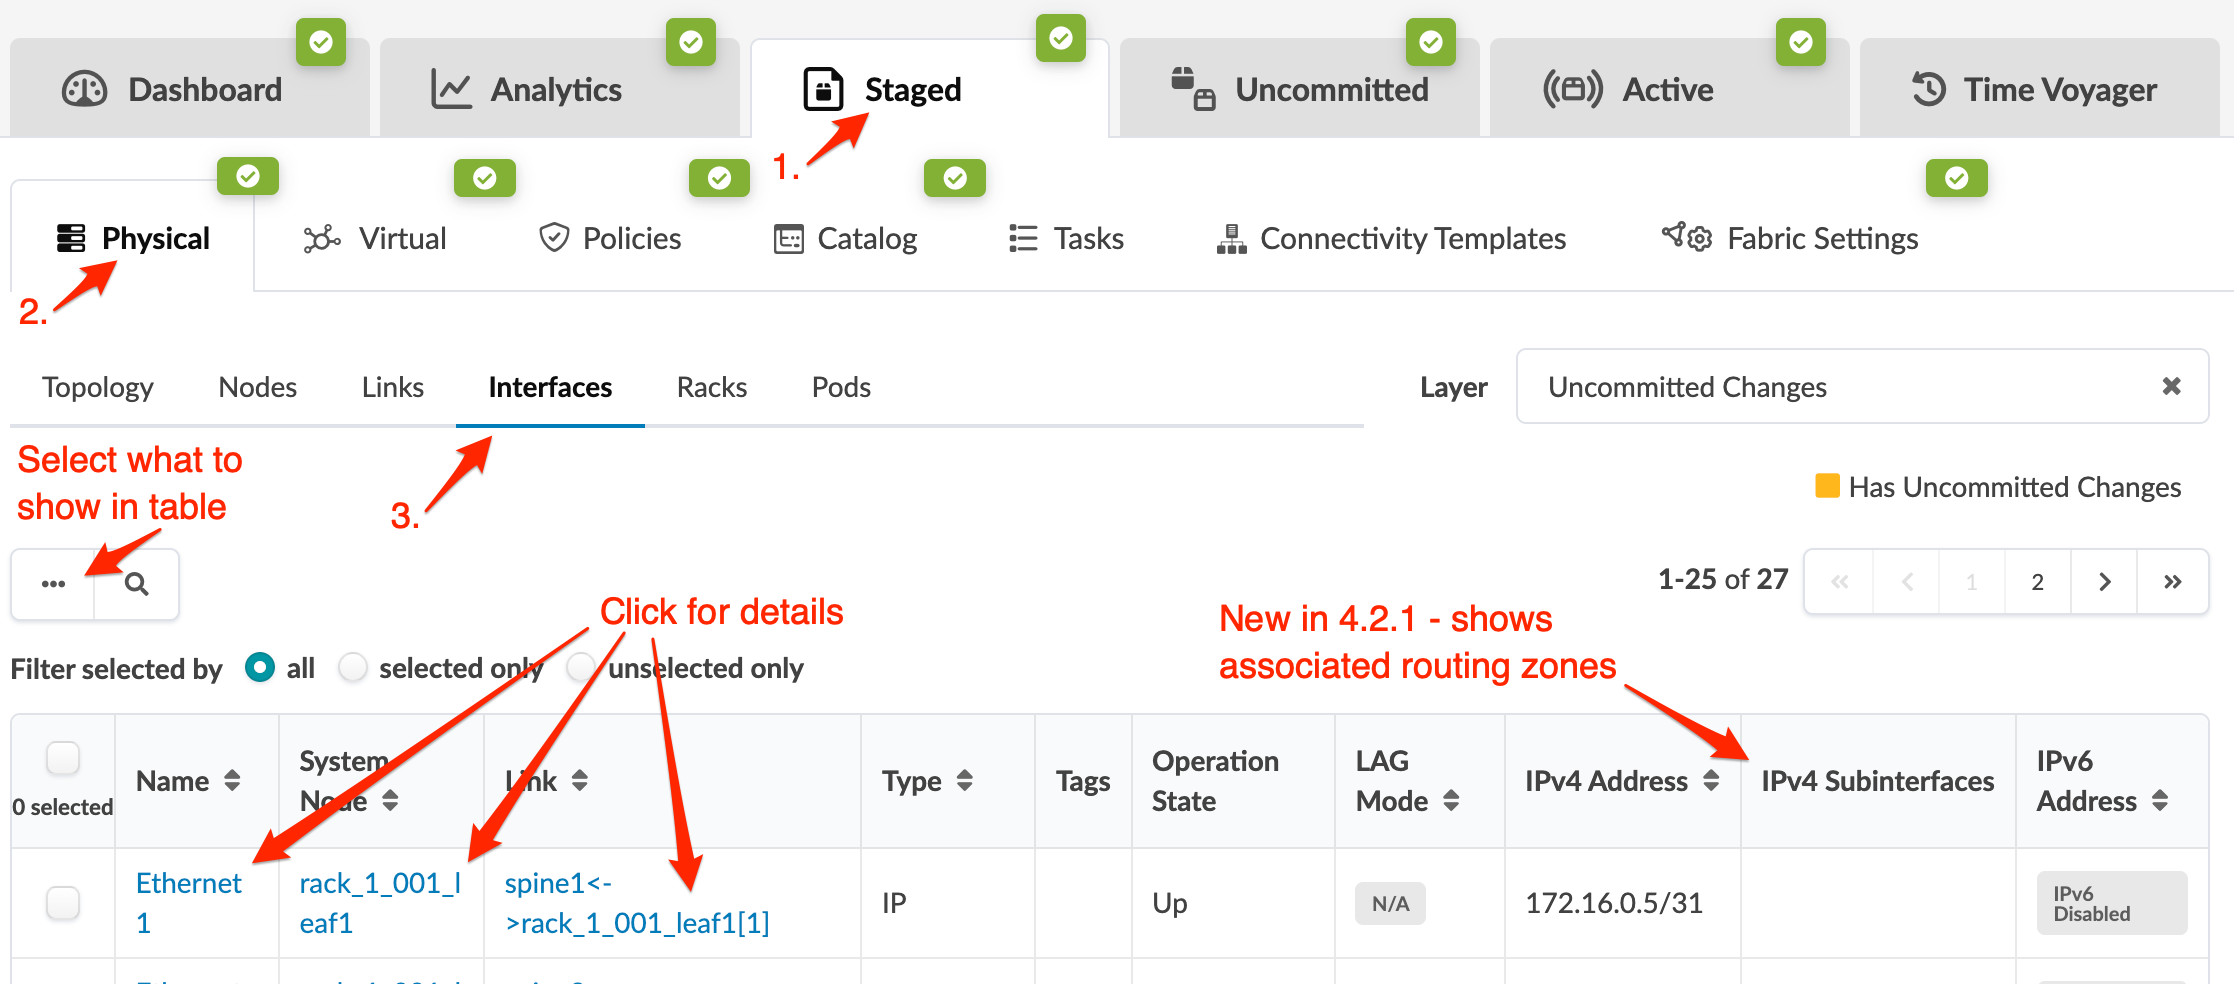
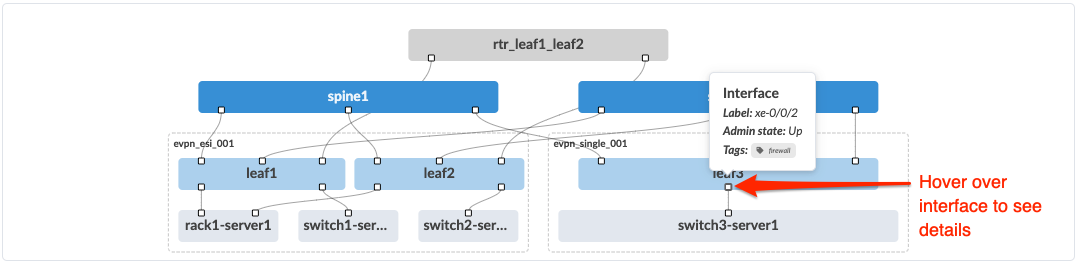
You can see interface tags from various locations in the GUI. The interfaces table includes a column for tags, as shown above. You can also see interface tags when you hover over an interface in the topology view (along with the admin state and other information).
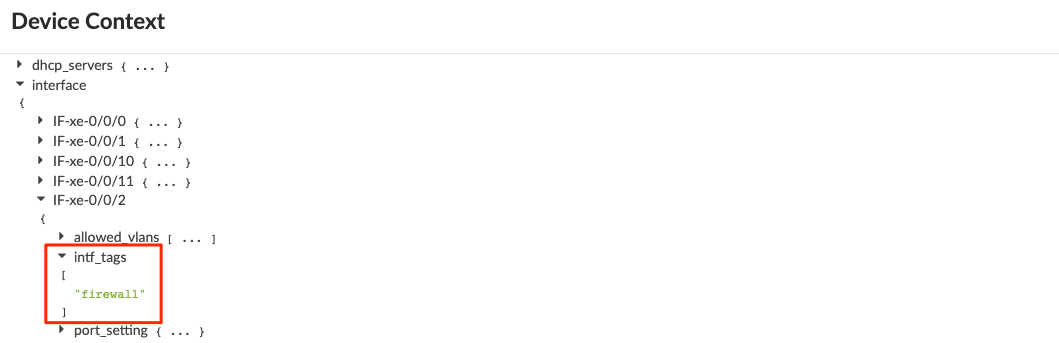
The device context also includes interface tag information. (Select a node, then from the Device tab on the right, at the bottom, click Device Context.)
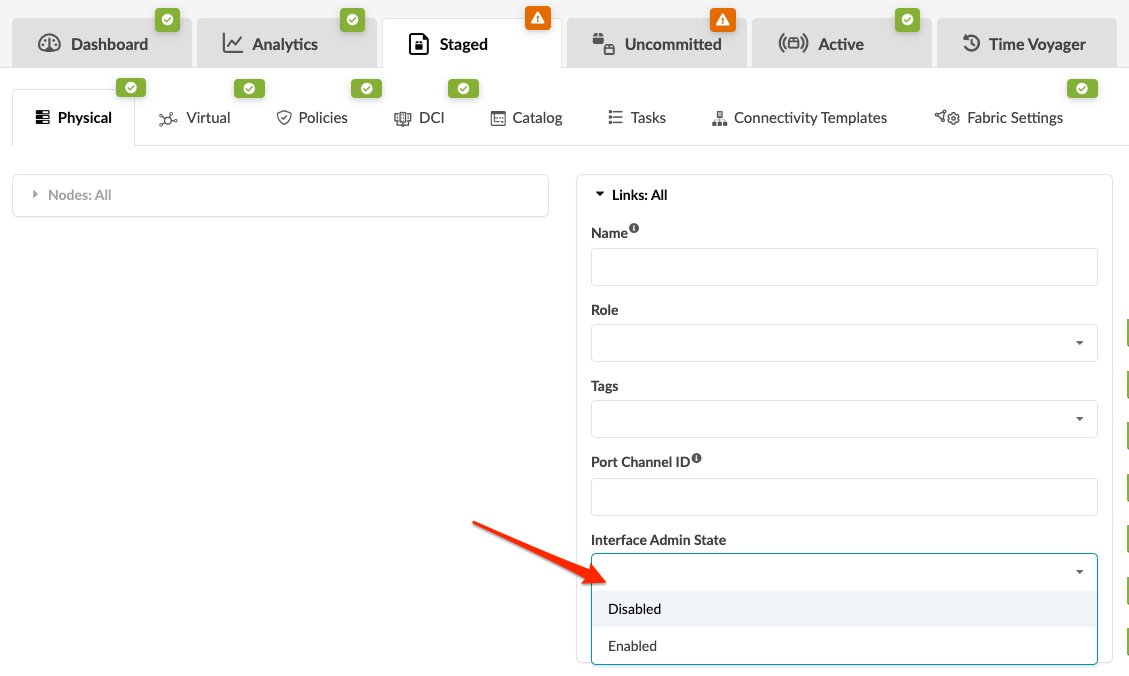
You can administratively disable and enable interfaces from the Apstra GUI. To show only the interfaces in the table that you've disabled or enabled, select the state from the Interface Admin State drop-down list in the Links filter.