Anomalies (Service)
This section covers service anomalies. For analytics anomalies see IBA Anomalies.
Discovery Anomalies
From your blueprint, navigate to Dashboard to see a high level view of your network with its different statuses and if/where you have anomalies.
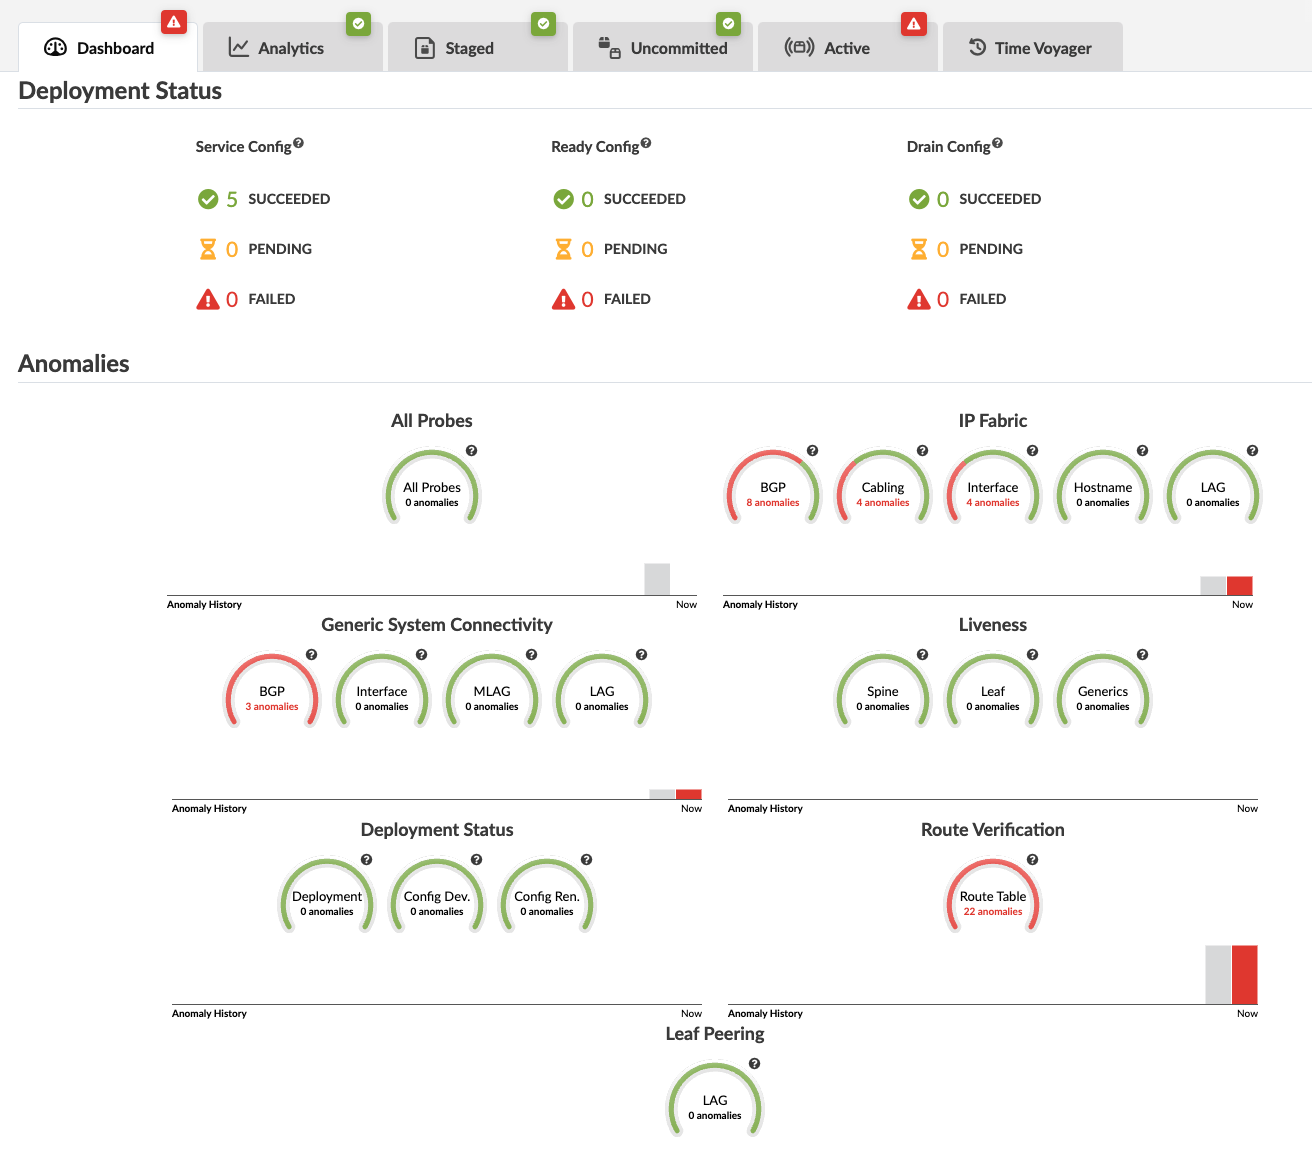
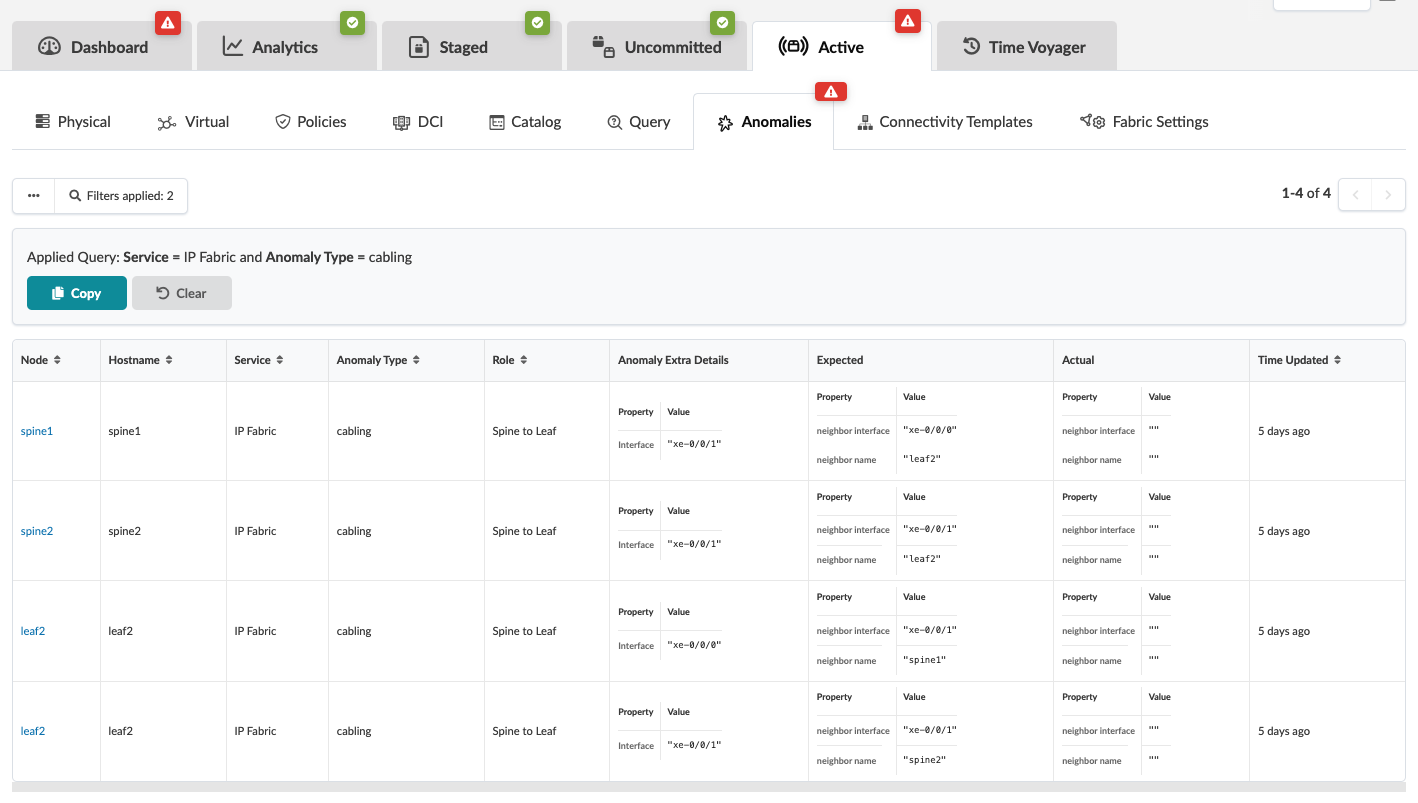
To see anomaly details, click one of the red indicators. The screenshot below is for IP fabric cabling anomalies.
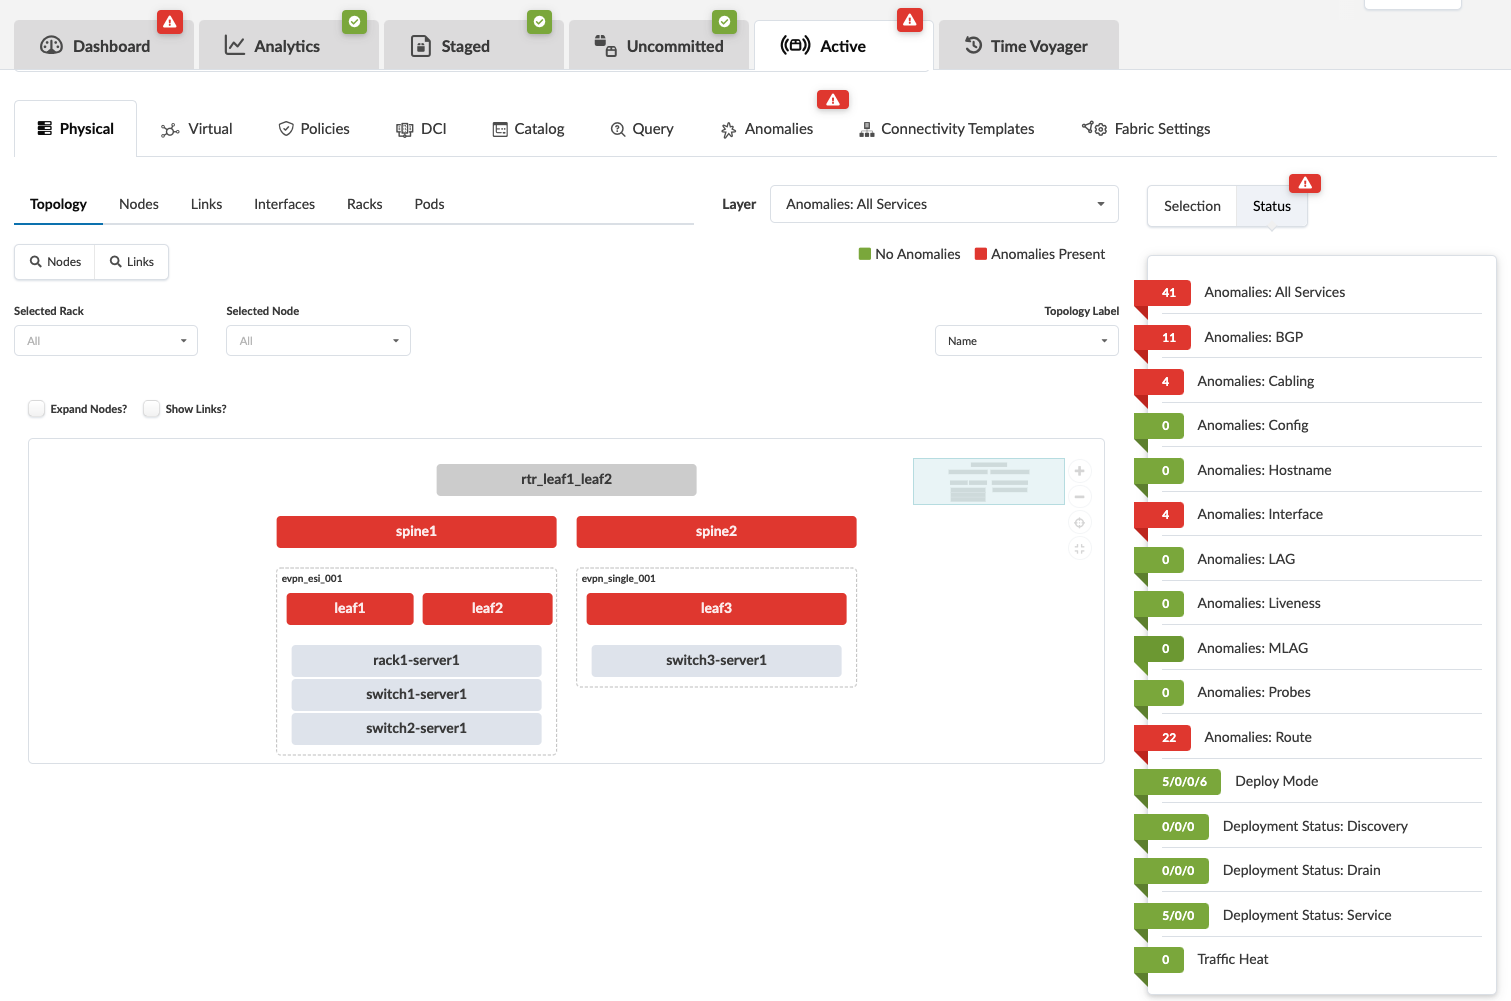
To see the anomalies in the topology view, click Active.
To see the topology view of a selection, click the node in the topology. The screenshot below is for spine1.
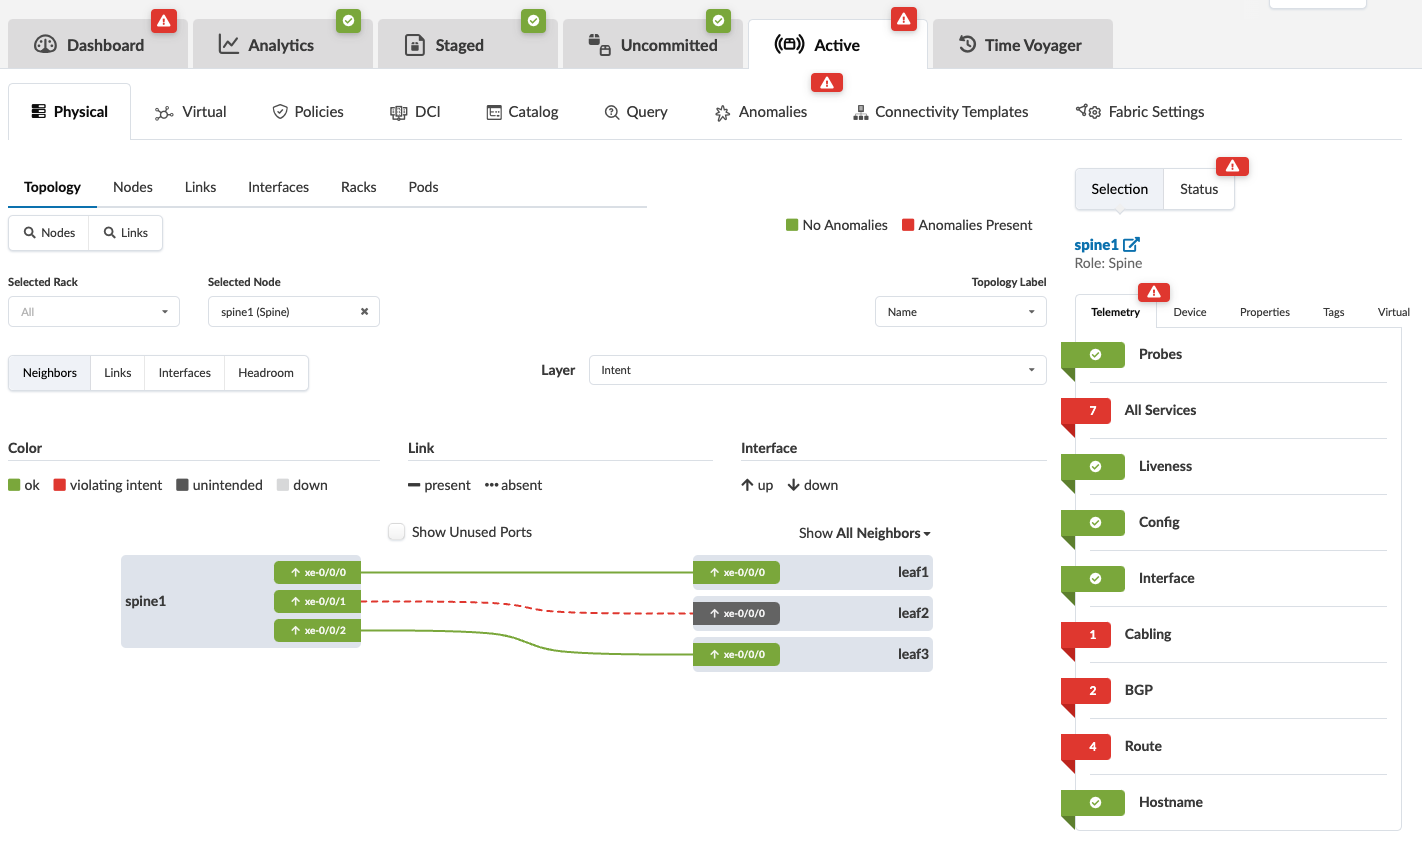
To see a comparison of expectations vs. actual, click All Services in the right panel. If other anomalies exist in addition to the cabling anomalies (our example), they're shown in this list as well.
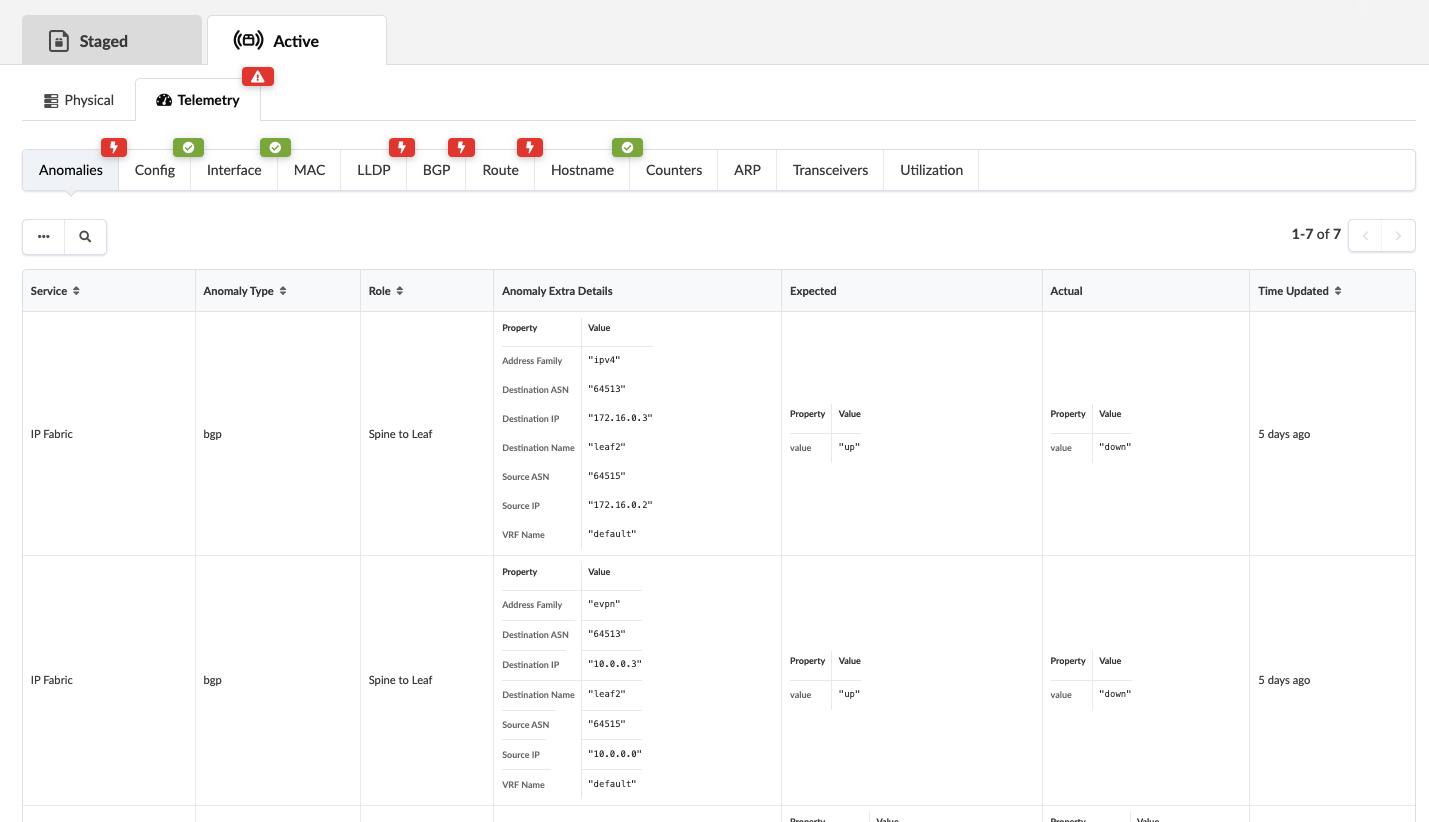
To see additional details, click one of the tabs, LLDP for example, click LLDP.
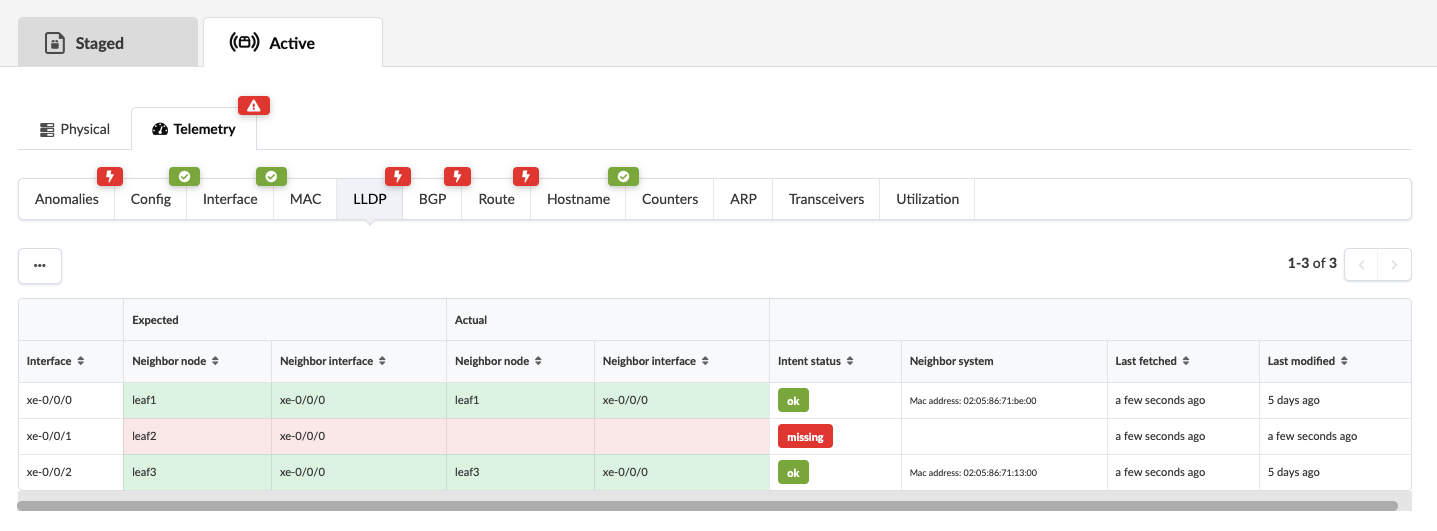
To see how to resolve these cabling issues, see Fetching Discovered LLDP Data.
Blueprint Anomaly History
You can see the history of blueprint anomalies in the Active tab of the blueprint.
From the blueprint, navigate to Active > Anomalies and click to toggle ON Time Series.
The screen below says this feature is a Tech Preview, but this feature is supported as of version 5.1.0.
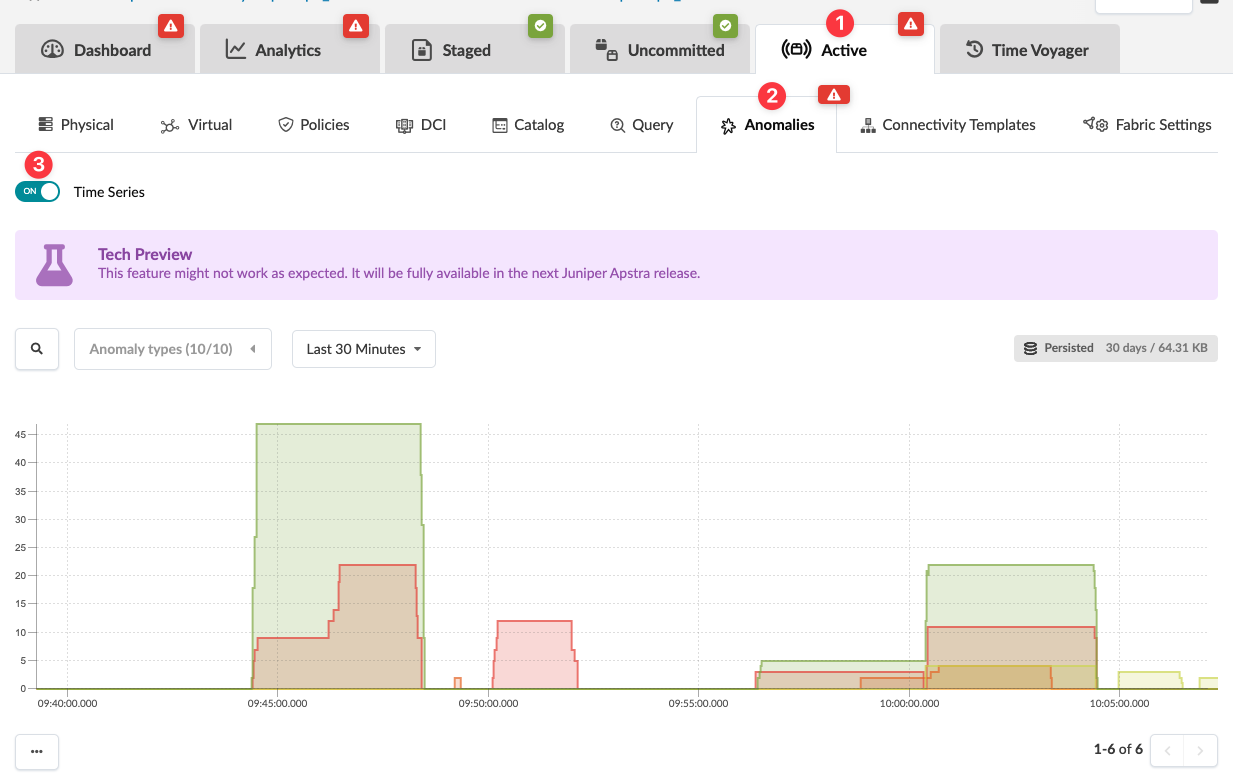
The Anomalies tab now shows a chart of the anomalies count over time, grouped per type of anomaly (BGP, cabling, route and so on). You can zoom in and zoom out to look for a specific time interval in detail.
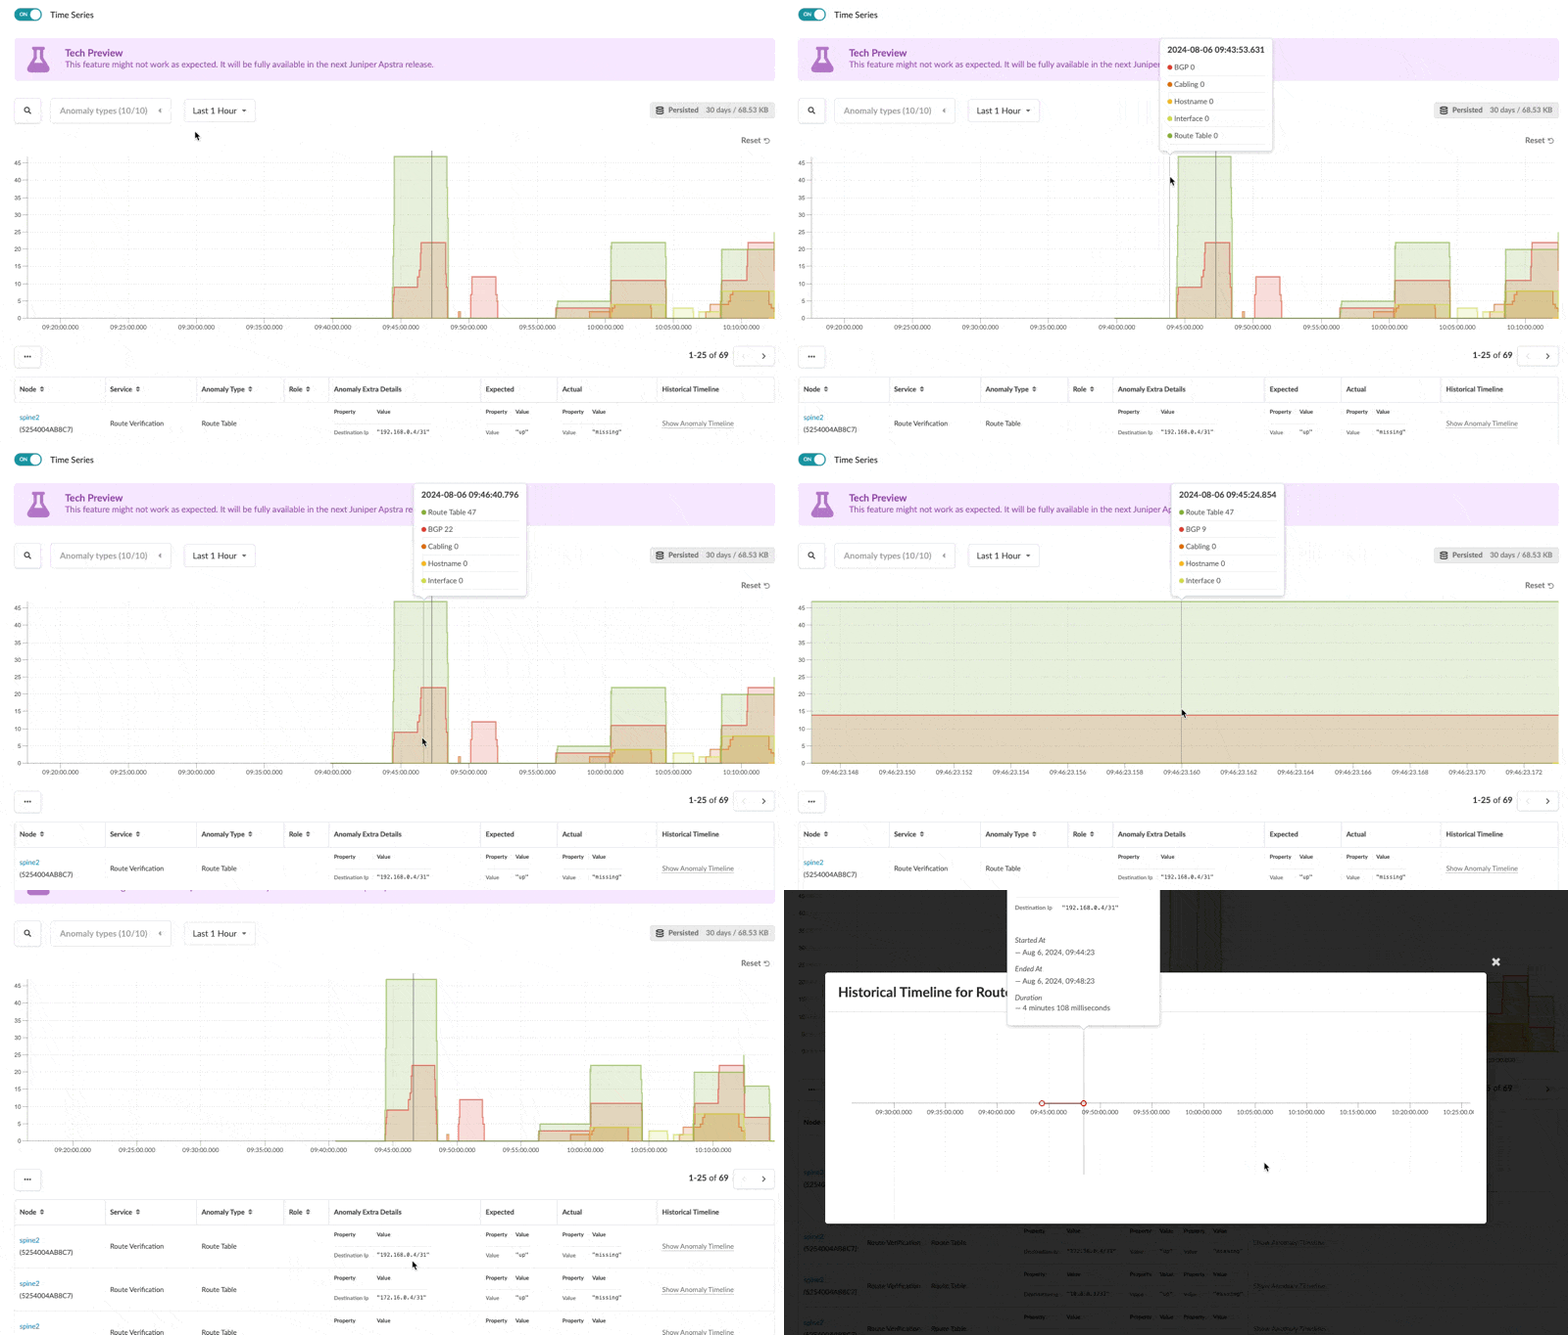
Selecting an individual anomaly you also can see the historical timeline of the anomaly to show the occurrences of that specific anomaly in the recent history. The default retention period is set to 30 days.
The screen below says this feature is a Tech Preview, but this feature is supported as of version 5.1.0.
Configuration Deviation
Running configurations on devices are continuously compared with the Golden Config. If a config deviation is found, a configuration anomaly is raised. Typically such deviations are seen when changes were made outside of the software (from the device CLI), or attempting to deploy configuration on a switch that is not able to take the change. These anomalies remain active until either the anomalous configuration is removed from the device or the anomaly is suppressed. (The screenshots below are from a previous version.)
- From the blueprint dashboard, any configuration deviations are displayed in the
Deployment Status section.
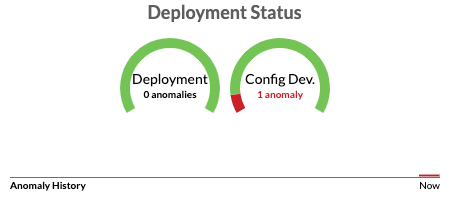
- Click Config Dev. to see the list of node(s) with
anomalies.
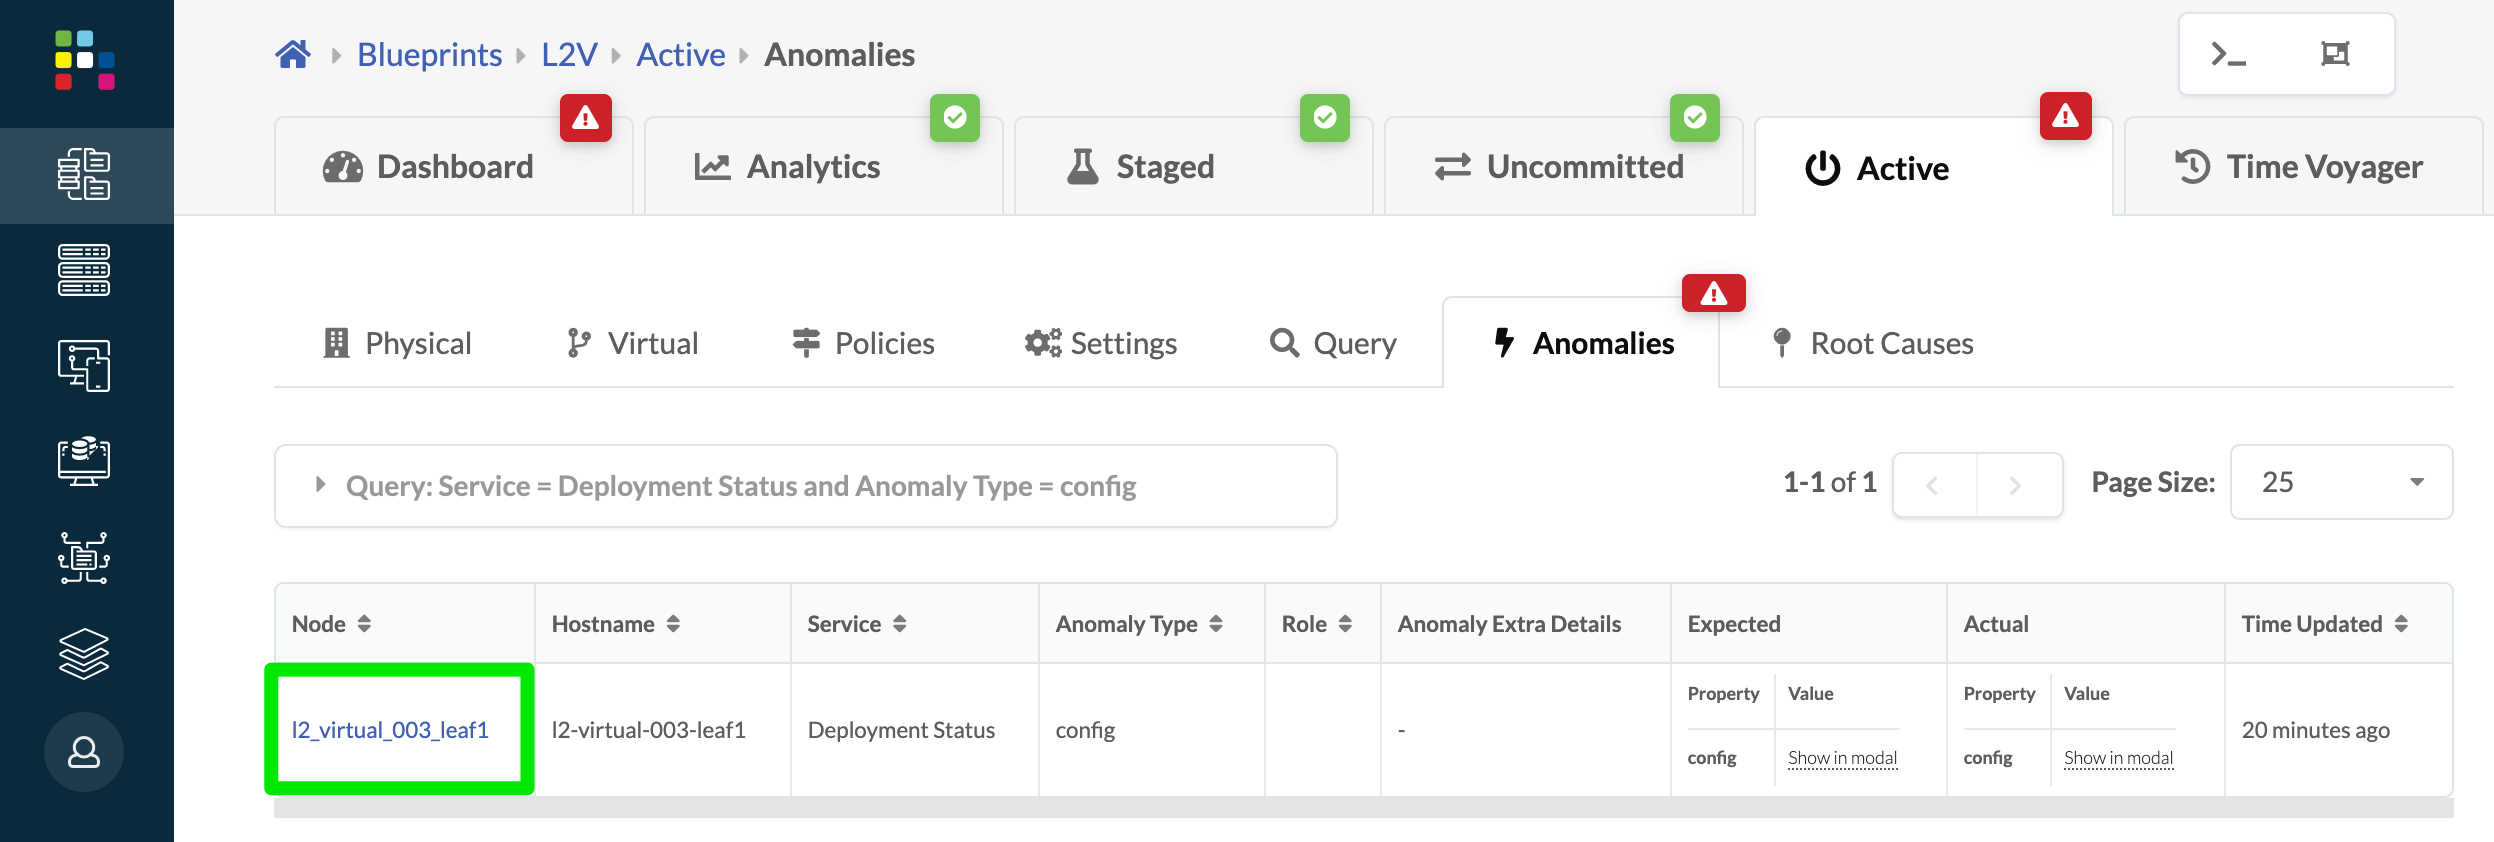
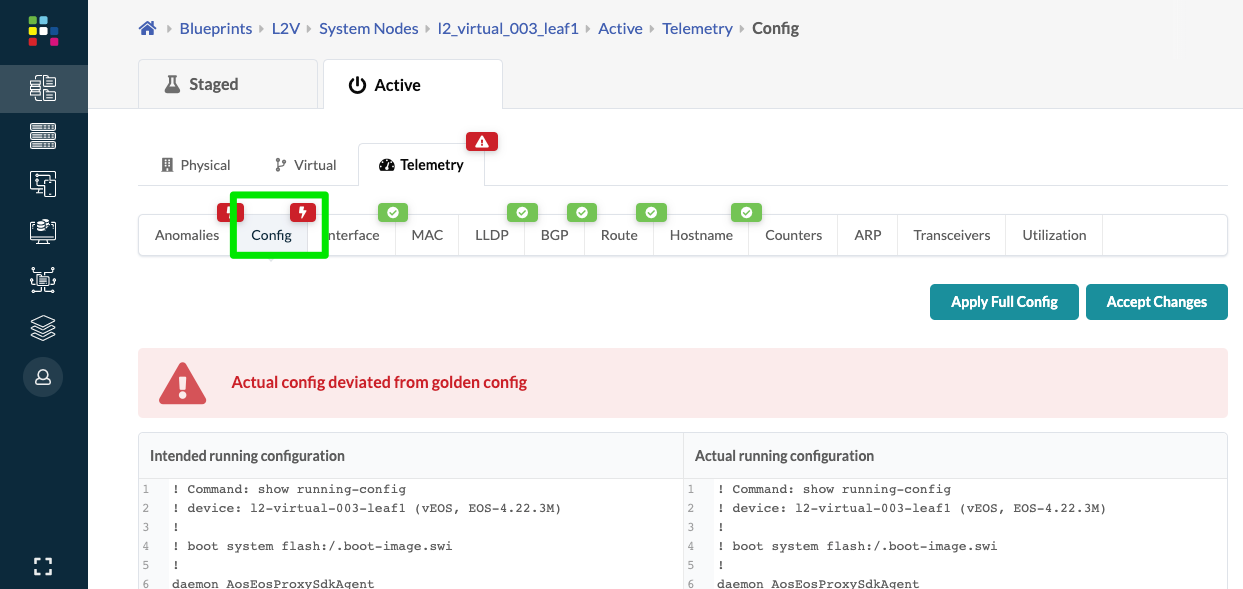
- Click a node name to see the device telemetry page, then click
Config to see a side-by-side comparison of the actual
config to the golden config. (The difference is not shown in the image below.)
- To keep the configuration difference, click Accept
Changes. This suppresses the configuration anomaly, and
does not affect "Intended" or rendered config. the primary purpose of "Accept
Changes" is to mitigate cosmetic configuration anomalies.Note:
Out-of-band (OOB) changes to the fabric are not supported. Do not Accept Changes to attempt to add OOB changes. For custom changes, use configlets.
CAUTION:- Depending on the change,the out-of-band changes may be overwritten. This can't be avoided. As such, always avoid OOB changes in the software environment.
- Using Accept Changes does not make the OOB change persistent. In the event of a full config push or the software writing to the same config, all OOB changes are discarded.
- To make the actual configuration conform to the intended configuration, click
Apply Full Config, then click Confirm. Applying the full
config erases the device's current (unintended) configuration before re-applying
the complete intended configuration. A full configuration push does not include
any OOB changes, and therefore erases them, regardless of their "Accepted"
state.CAUTION:
Applying a full config is a disruptive operation and results in a temporary loss of service to the device.
CAUTION:Never directly modify any rendered config that affects routing and connectivity. Doing so can potentially impact the network's operation. When in doubt, contact Juniper Support.
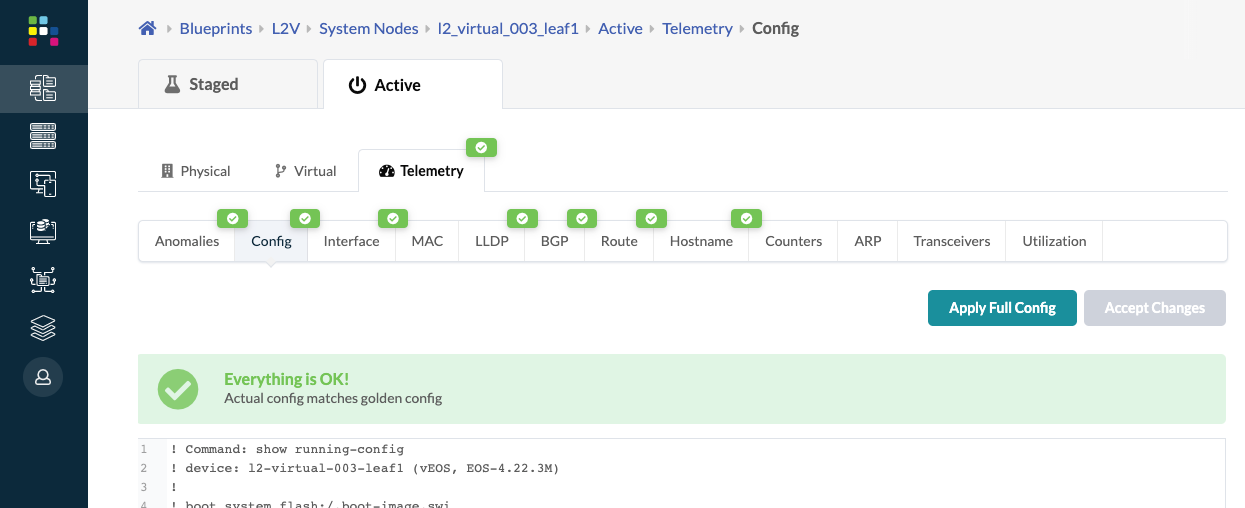
- After resolving the config deviation anomaly (accept changes or apply full
config) the actual config matches the golden config and the anomaly is cleared.
Config Deviation and Configlets
If an improperly-configured configlet causes deployment errors (when the device rejects the command), a service config deployment failure occurs. In this case, follow the steps below to resolve the anomaly.
- From the blueprint, navigate to Staged > Catalog > Configlets and delete the configlet.
- Click Uncommitted and commit the change. The configuration deviation remains because the golden config is empty. The golden config is the running config of the device after successful deployment of rendered config. If deployment fails there is no golden config, thus causing the config deviation.
- Click Dashboard, then click Config Dev. (in the Deployment Status section).
- Click the node name, then select Accept Changes to ignore the failure.