Anomalies (Analytics)
To go to IBA probe anomalies in the GUI:
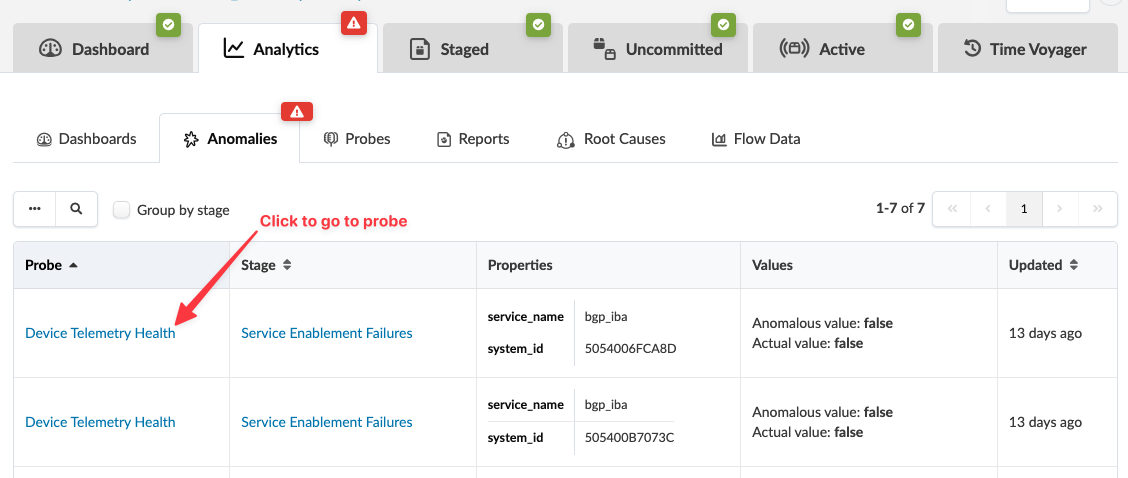
From the blueprint, navigate to Analytics > Anomalies.
From the Query box, you can search for specific anomalies by filtering Probe Label, Stage Name, and other properties.
To display a condensed view of the anomaly count per probe/stage, check the Group by stage check box. Example: If three stages of the first of two probes are generating anomalies, and two stages of the second probe are generating anomalies, Group by Stage shows five entries in a table, each one representing one stage with anomalies.
To go to the probe for more information, click its name.
Blueprints Dashboard
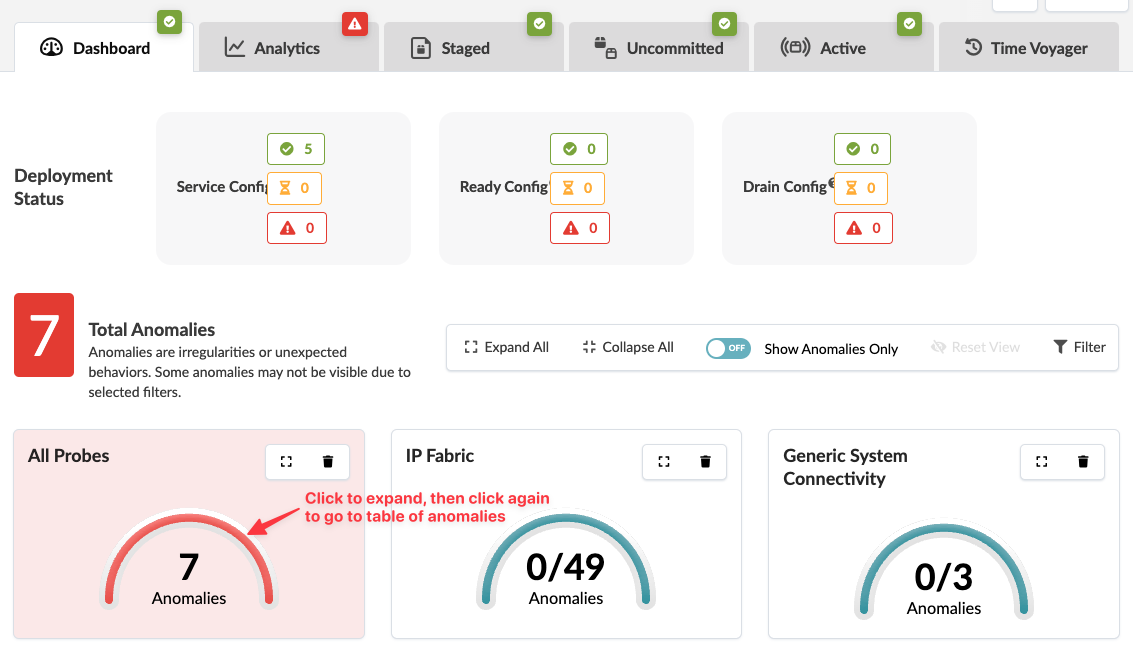
The Blueprints Dashboard shows a summary of all anomalies including those that IBA probes generated. Another way to get to the Analytics > Anomalies page is to click the All Probes gauge on the dashboard to expand it, then click it again.