Interface Flapping (Fabric Interfaces) Probe
The Interface Flapping (Fabric Interfaces) probe determines if any fabric interfaces are flapping and raises anomalies accordingly.
Probe Overview
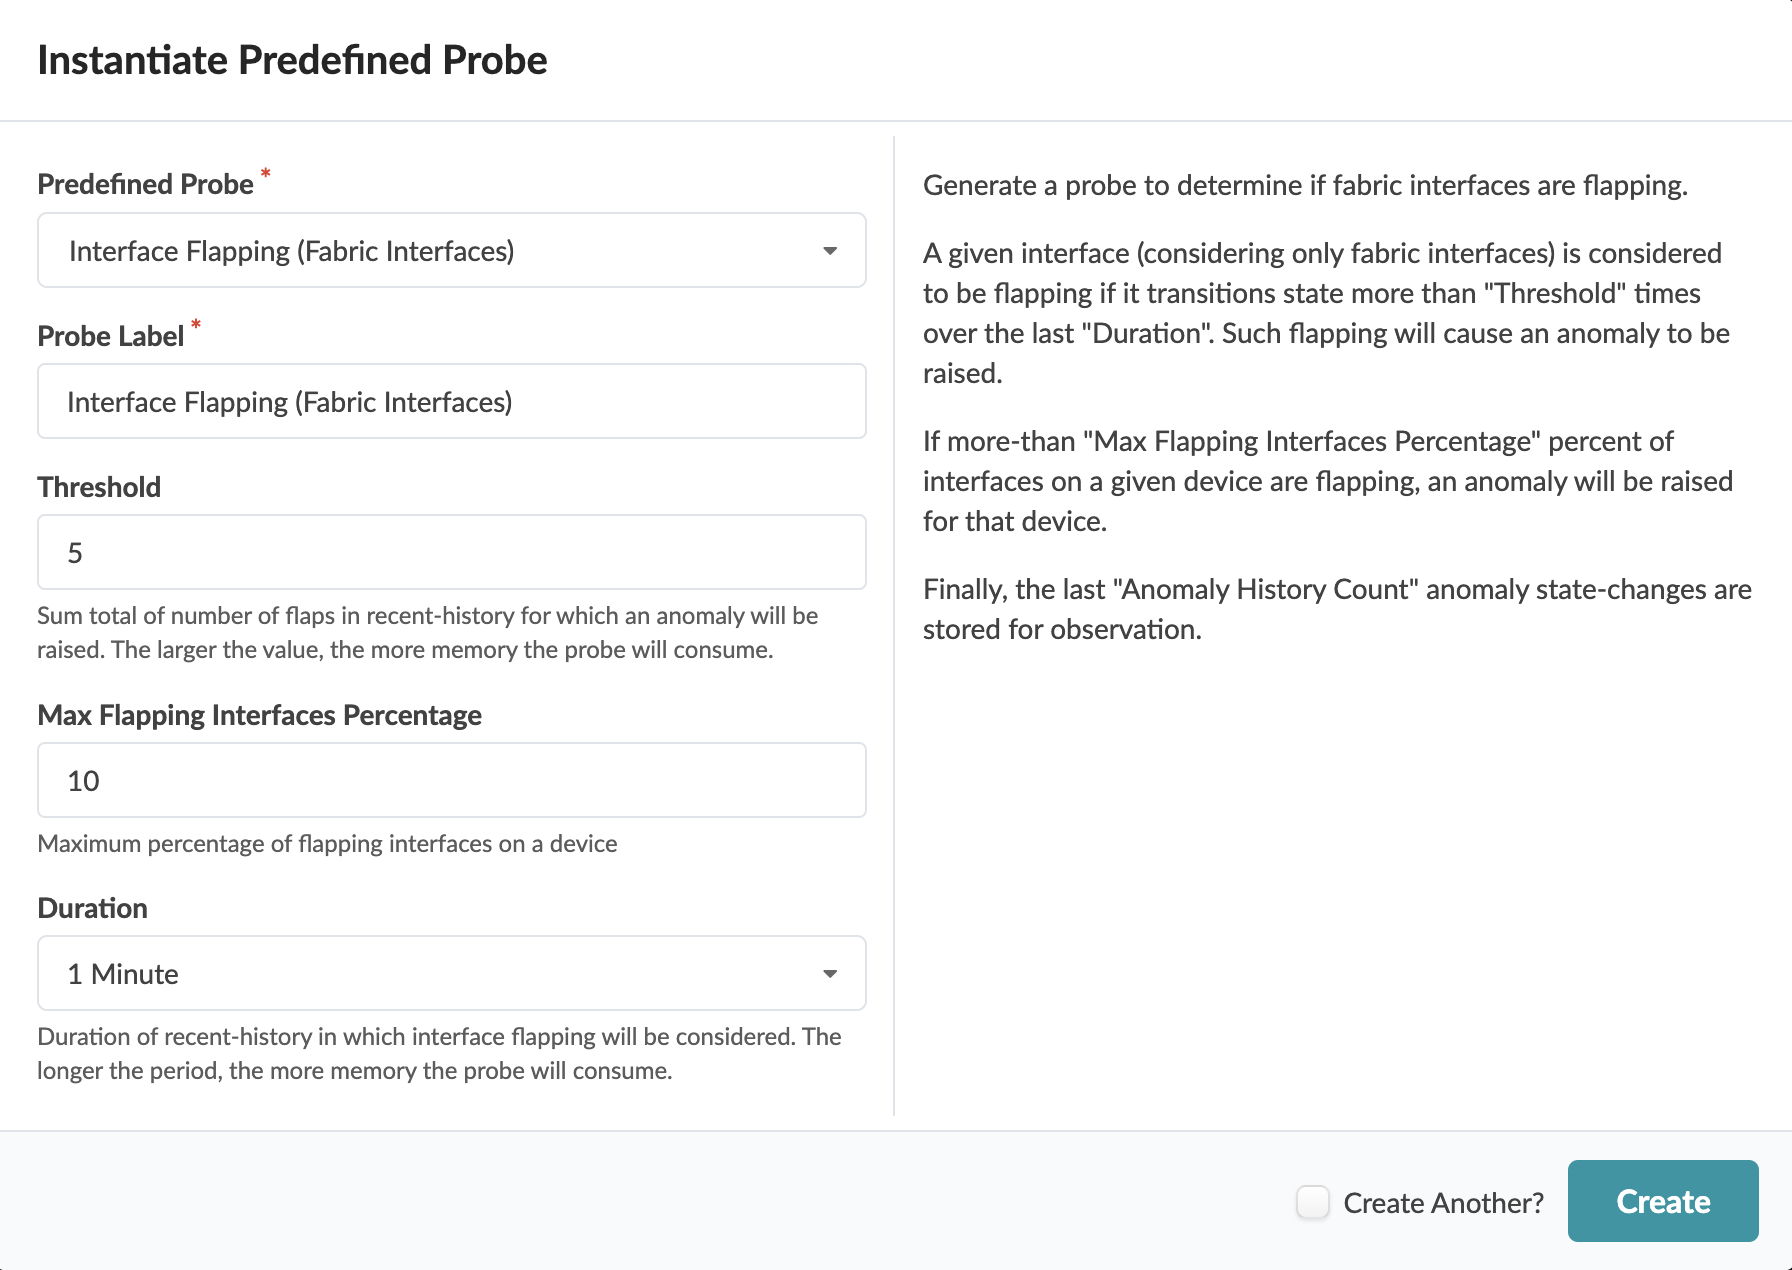
If the number of times that the operational state of any fabric interface changes is greater than a specified number (Threshold) over a specified amount of time (Duration), then the interface is flapping and an anomaly is raised. Also, if the percentage of flapping interfaces exceeds the specified percentage (Max Flapping Interfaces Percentage), then an anomaly is raised for that device.
Probe Parameters
When you instantiate the predefined Interface Flapping (Fabric Interfaces) probe you can customize the above mentioned parameters or leave default values as is, as shown in the screenshot below.
Probe Stages
The following stages are used in the interface flapping probe for all fabric interfaces:
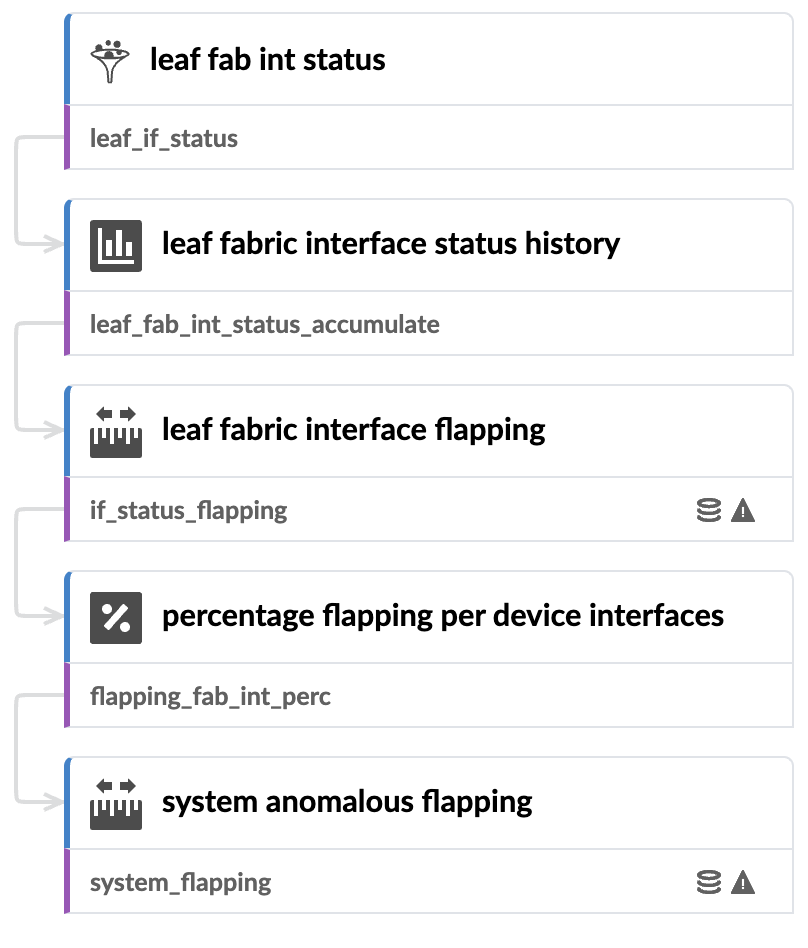
The probe performs the following tasks in stages:
Identify fabric interfaces (leafs facing spines) on all leafs (using the leaf fab int status processor).
For each interface, count the number of times that the operational state changes and create a time series from it (using the leaf fabric interface status history processor).
If the number of state changes during the specified duration is more than the specified upper limit, then generate an anomaly (using the leaf fabric interface flapping processor
If an anomaly was created based on the previous stage, create a time series for it (using the
Calculate the percentage of interfaces on devices with the anomaly. If the percentage is higher than the specified threshold, then raise device level anomaly(so that recent history of existence and clearing of anomaly can be inspected).
Create time series for the anomaly so that recent history can be inspected. the last "Anomaly History Count" anomaly state-changes are stored for observation.
The sections below discuss the stages in detailed.
Leaf Fabric Interface Status Processor
- Leaf Fabric Interface Status Service Collector (Input)
- leaf fabric interface status history
- leaf fabric interface flapping
- percentage flapping per device interfaces
- system anomalous flapping
Leaf Fabric Interface Status Service Collector (Input)
We begin with the source processor (no inputs), which is a Service Collector configured to collect interface status telemetry for all fabric interfaces on leaf devices, as shown in the screenshot below.
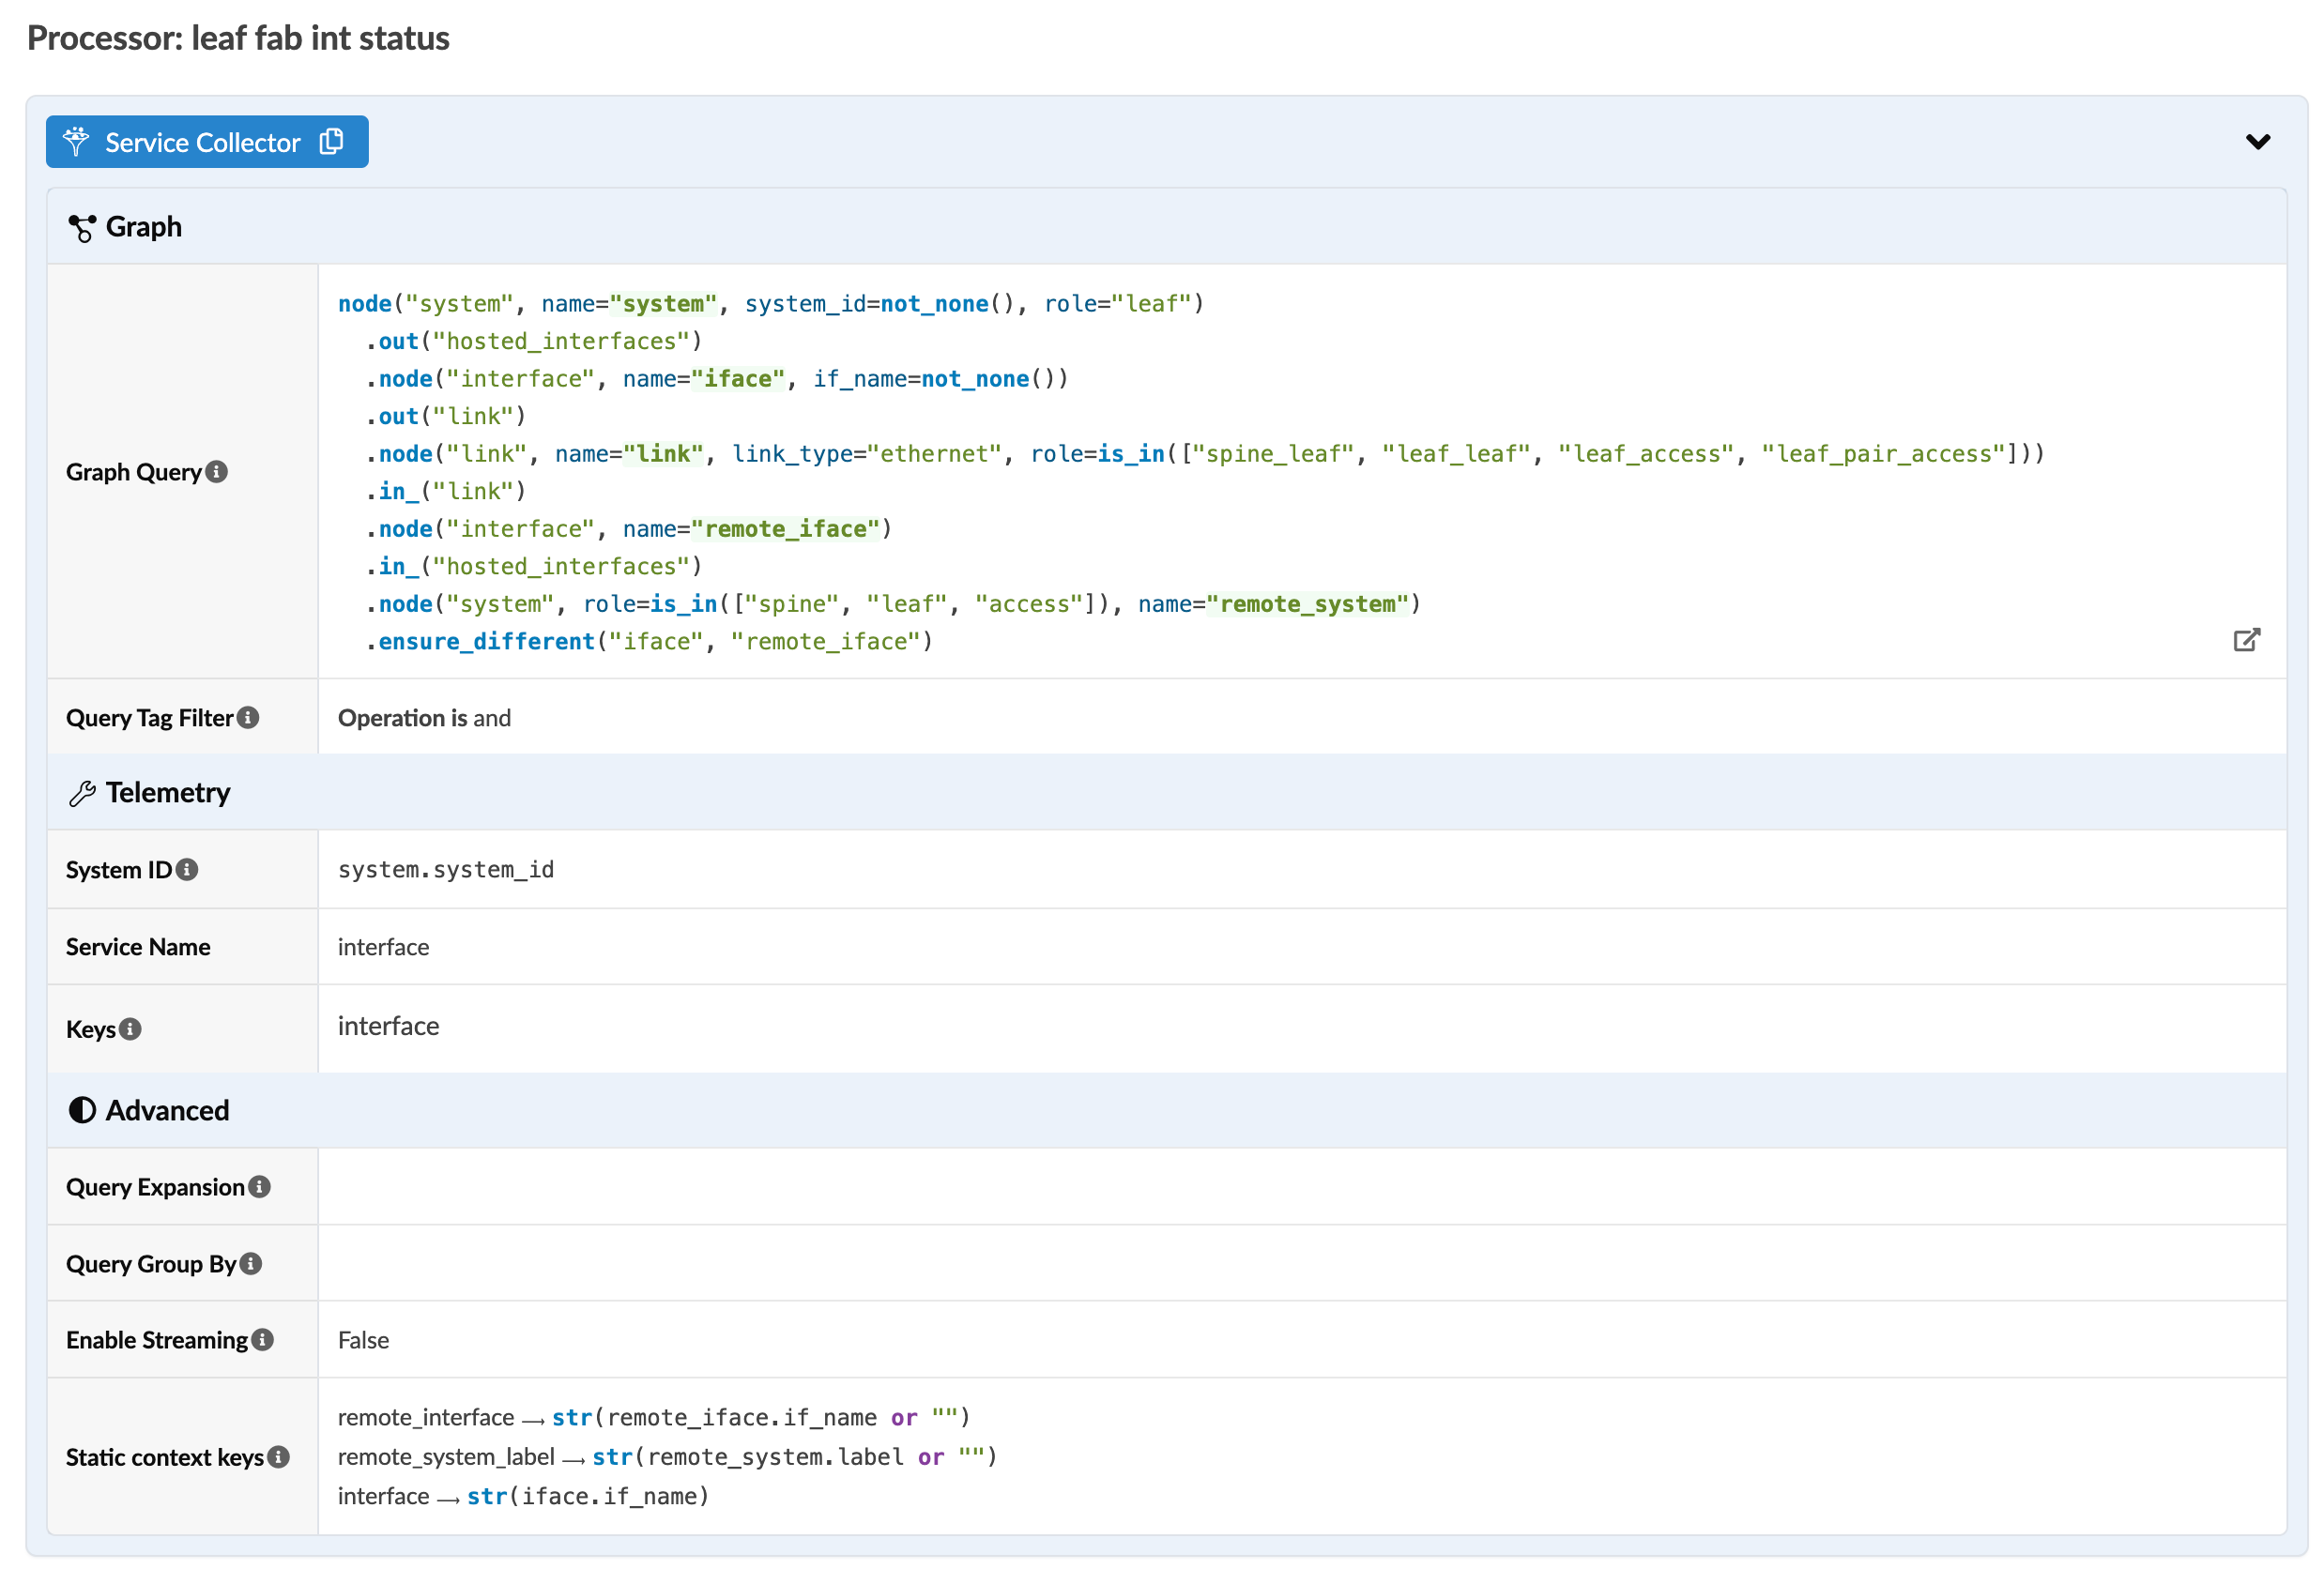
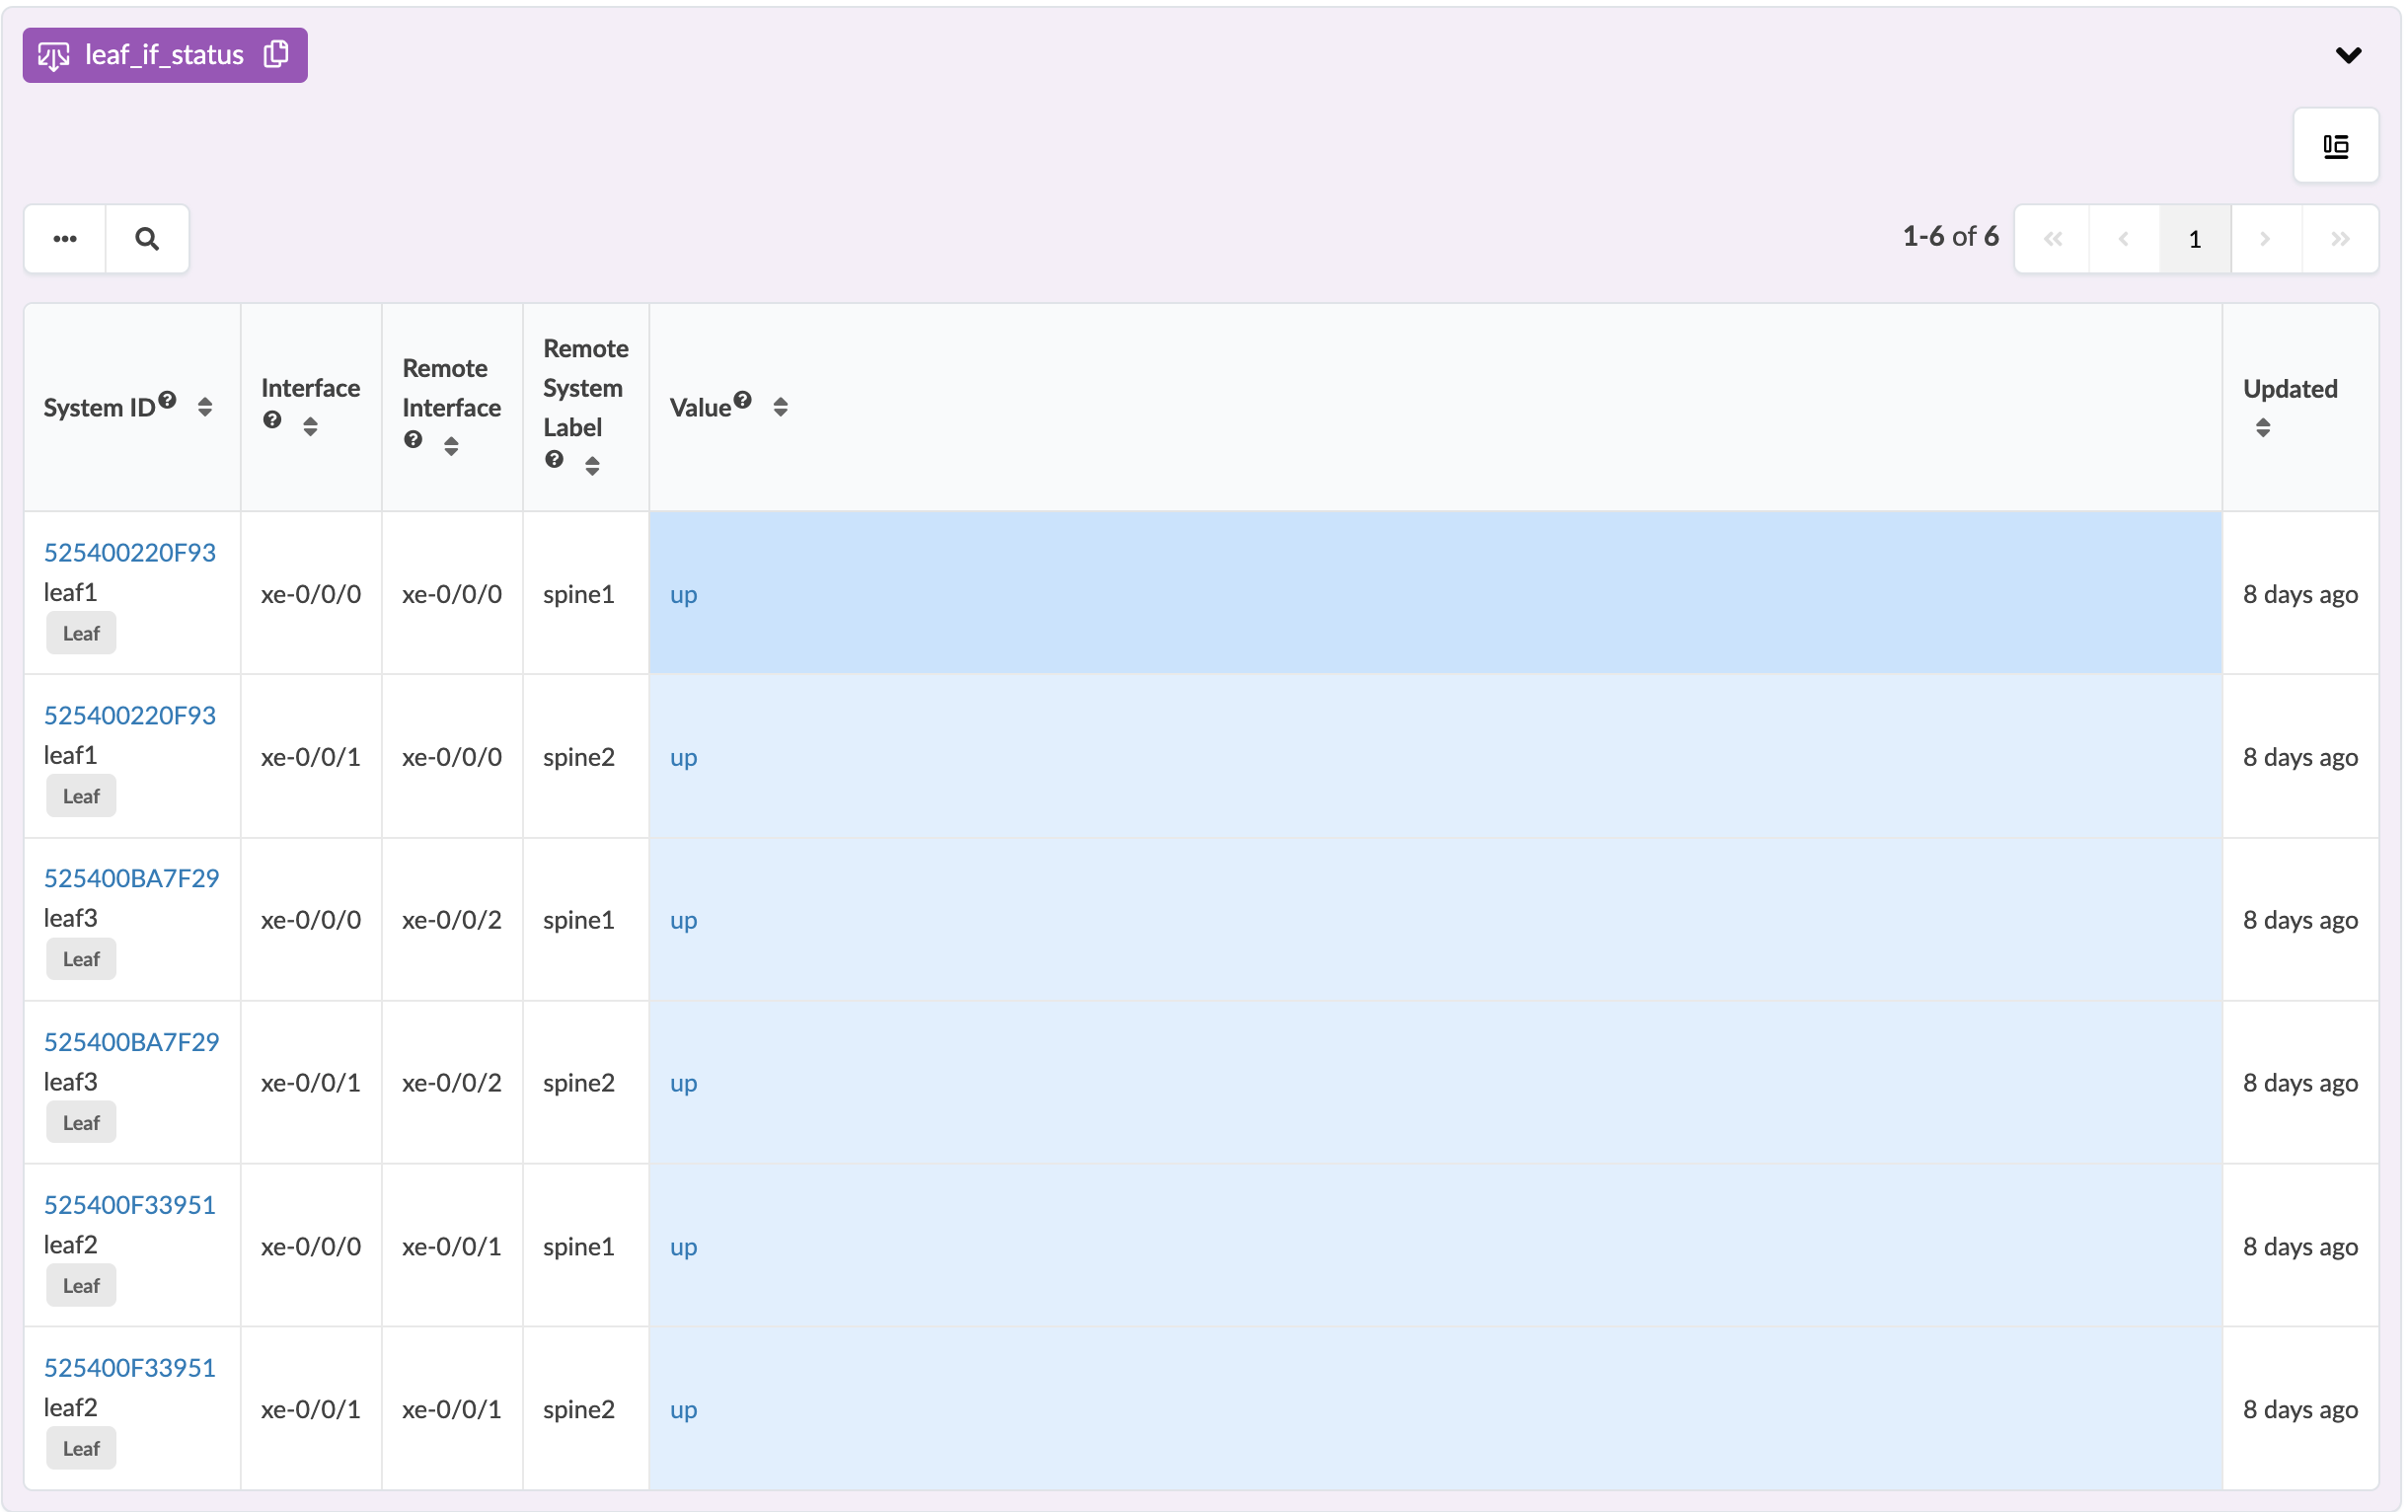
This processor keeps track of when the operational state (up, down) of the interface changes. It collects and outputs this information as leaf interface status (leaf_if_status). Each interface is identified by its system ID and interface name. Operational state and a few other details are included in the output as shown in the list below:
-
System ID - ID of the leaf device, usually the serial number
-
Interface - name of the interface
-
Remote Interface - interface name on the other end
-
Remote System Label - the device name on the other end
-
Value - operational state of the device (up, down)
-
Updated - when the state was last updated
The following screenshot is an example of the details that are collected from this processor.
leaf fabric interface status history
The output from the prevous stage (leaf_if_status) becomes the input for this one (leaf_fab_int_status_accumulate). The leaf fabric interface status history is a set of interface status time series (for each spine facing interface on each leaf). Each set member has the following keys to identify it: system_id (id of the leaf system, usually serial number), interface (name of the interface).
Purpose: create recent history time series for each interface status In terms of the number of samples, the time series will hold the smaller of: 1024 samples or samples collected during the last 'total_duration' seconds (facade parameter).
For this stage, the Accumulate processor is configured for collecting leaf fabric status history as shown in the screenshot below. The defaults are shown in the screenshot below. It states if the status changes more than 5 times within one minute
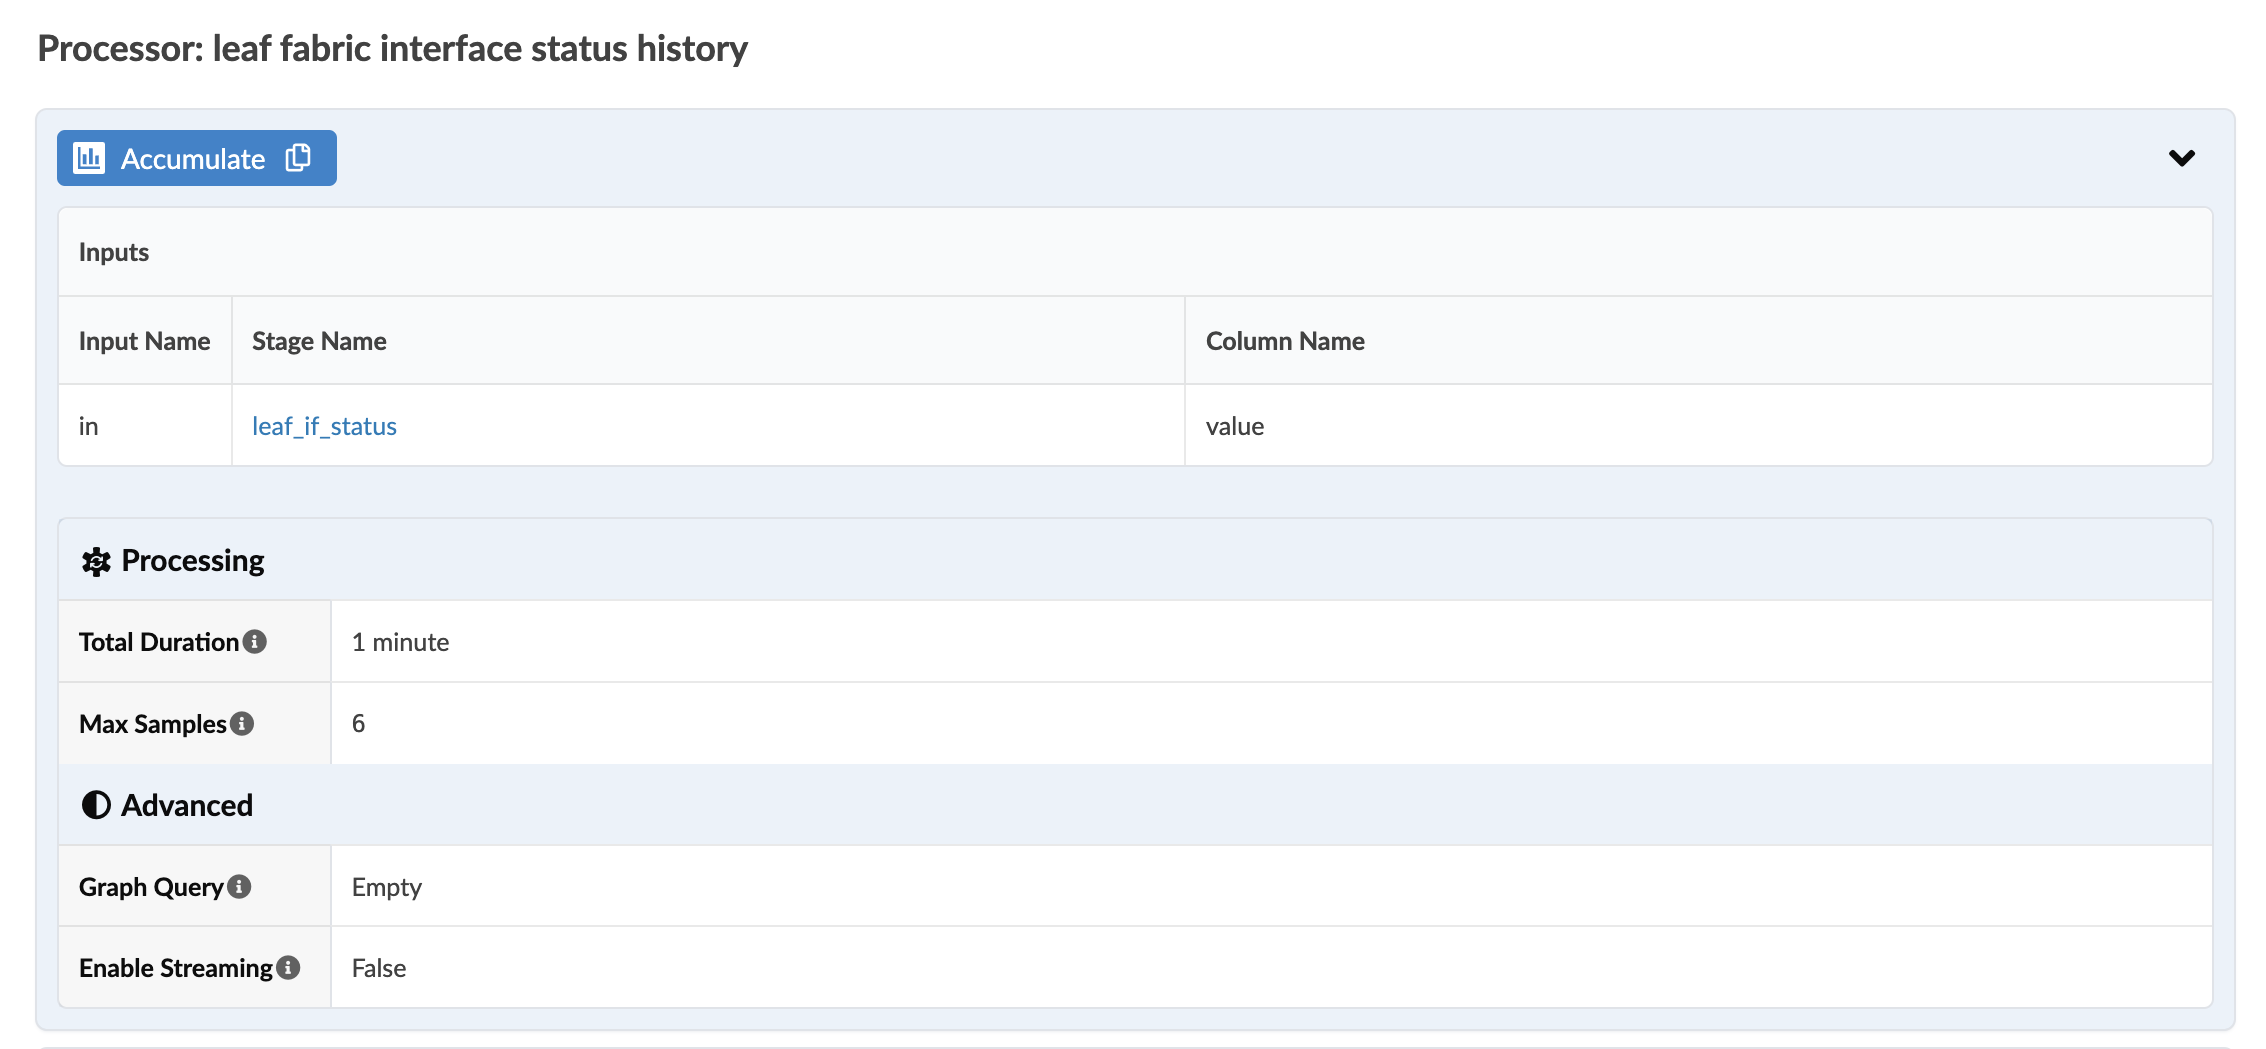
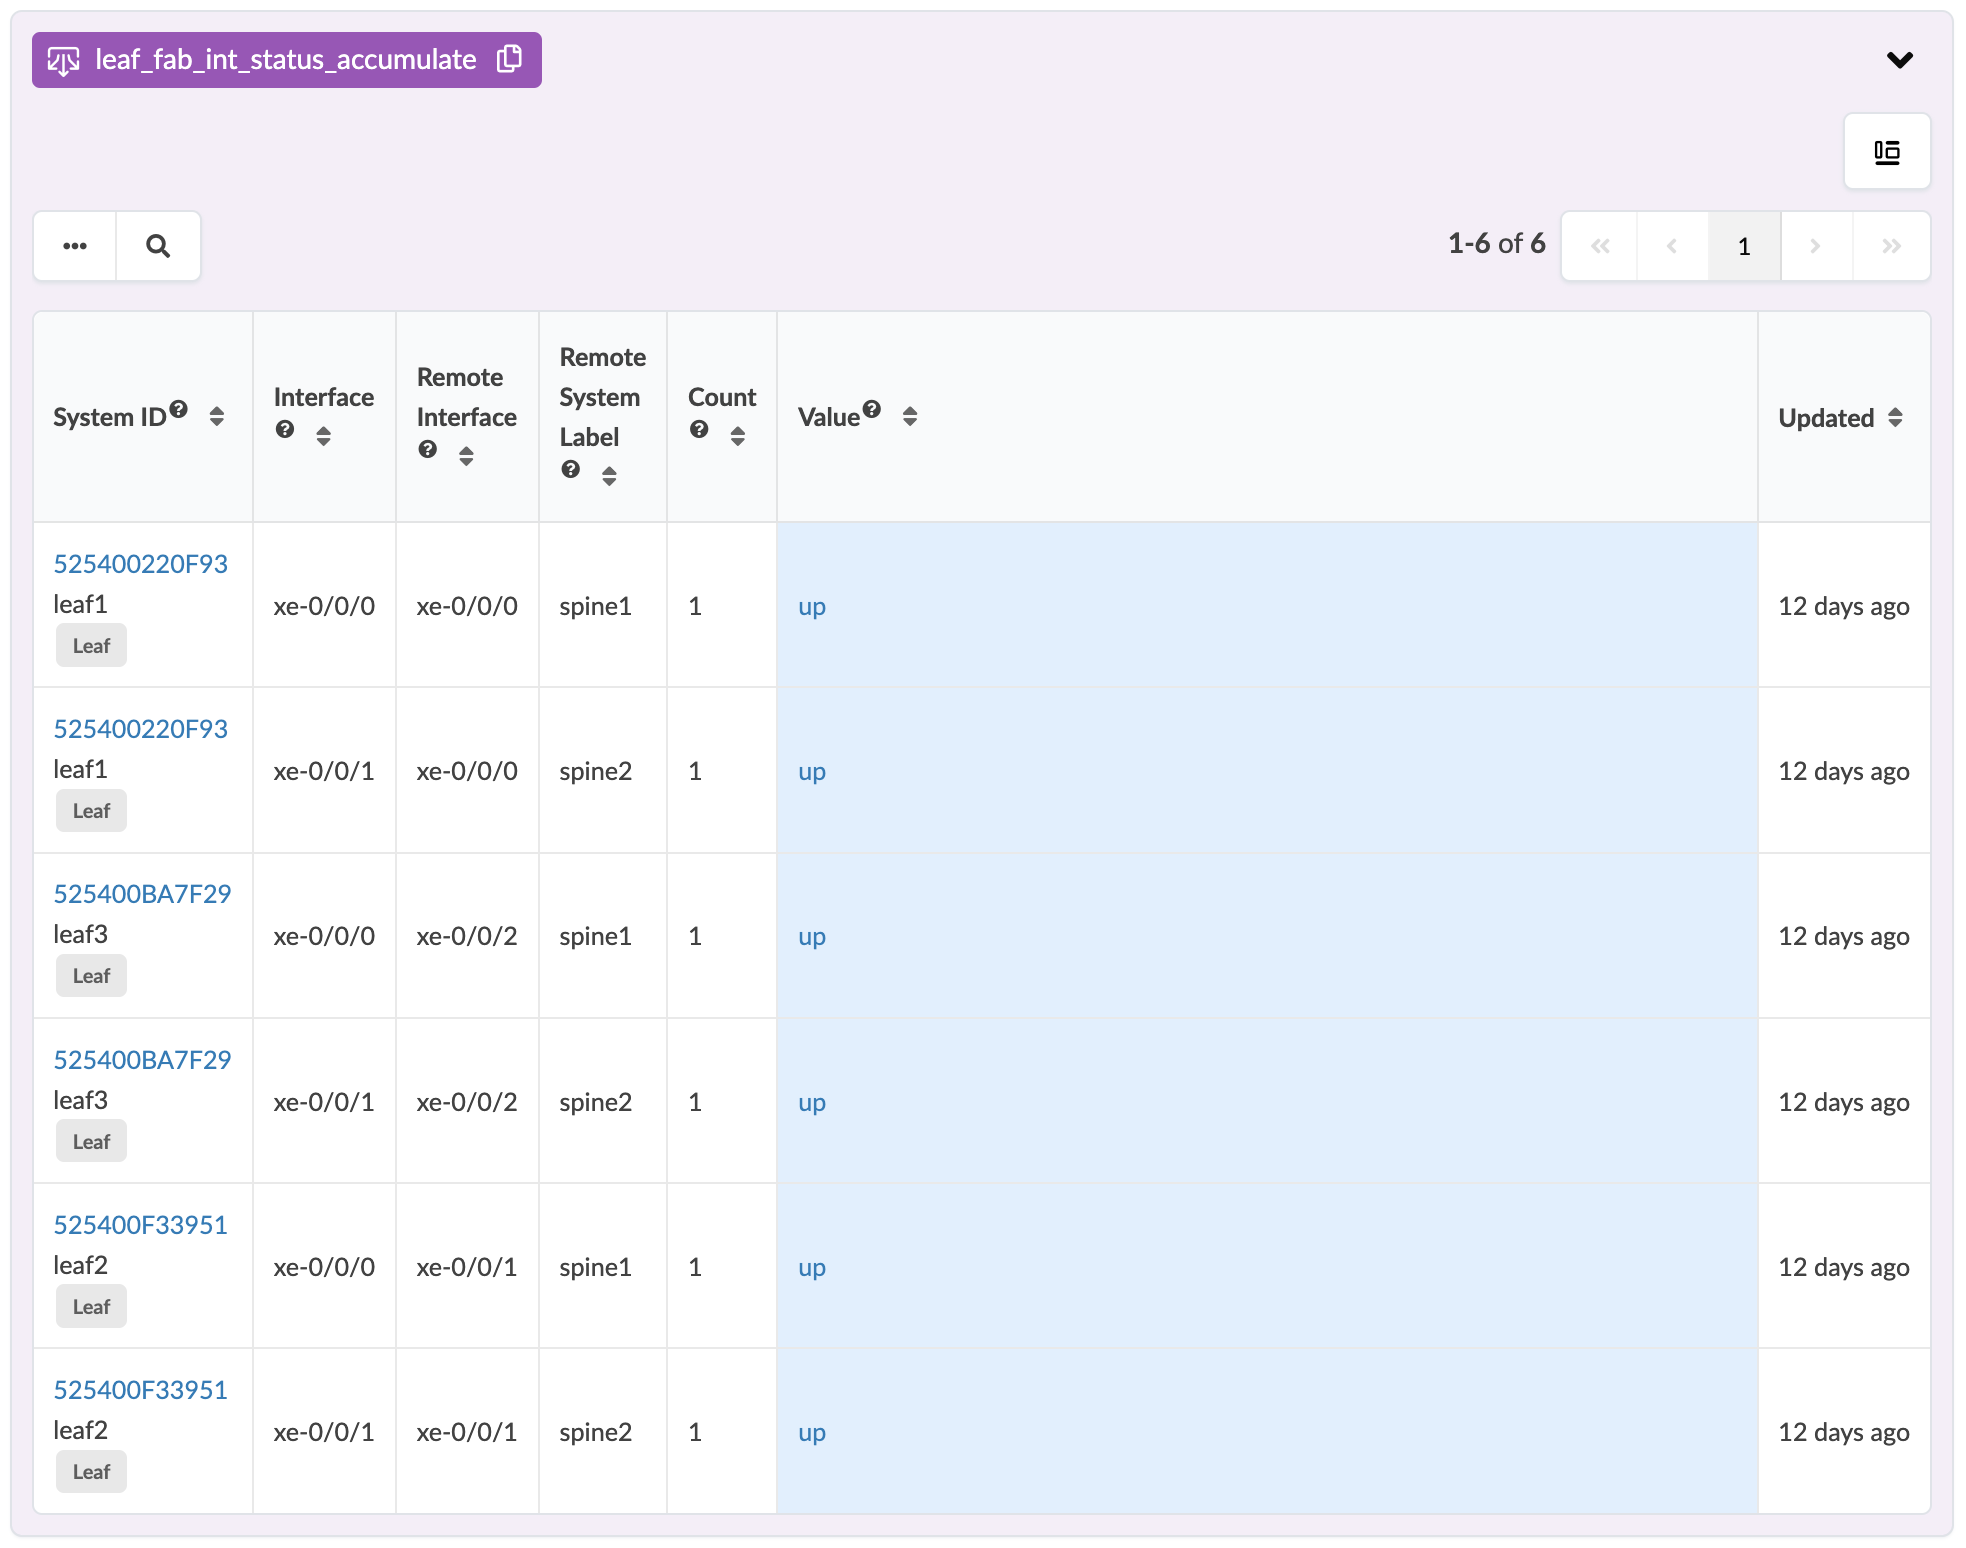
This processor collects and outputs leaf fabric interface status accumulate (leaf_fab_int_status_accumulate). Each interface is identified by its system ID and interface name. The inputs here are the same as the outputs from the previous processor with the addition of Count, which counts the transition states as shown below
-
System ID - ID of the leaf device, usually the serial number
-
Interface - name of the interface
-
Remote Interface - interface name on the other end
-
Remote System Label - the device name on the other end
-
Count -
-
Value - operational state of the device (up, down)
-
Updated - when the state was last updated
leaf fabric interface flapping
We begin with the source processor (no inputs), which is a Service Collector configured to collect interface status telemetry for all fabric interfaces on leaf devices, as shown in the screenshot below.
The output from the prevous stage (leaf_if_status) becomes the input for this one (leaf_fab_int_status_accumulate). The leaf fabric interface status history is a set of interface status time series (for each spine facing interface on each leaf). Each set member has the following keys to identify it: system_id (id of the leaf system, usually serial number), interface (name of the interface).
Purpose: create recent history time series for each interface status In terms of the number of samples, the time series will hold the smaller of: 1024 samples or samples collected during the last 'total_duration' seconds (facade parameter).
For this stage, the Accumulate Processor is configured for collecting leaf fabric status history as shown in the screenshot below. The defaults are shown in the screenshot below. It states if the status changes more than 5 times within one minute
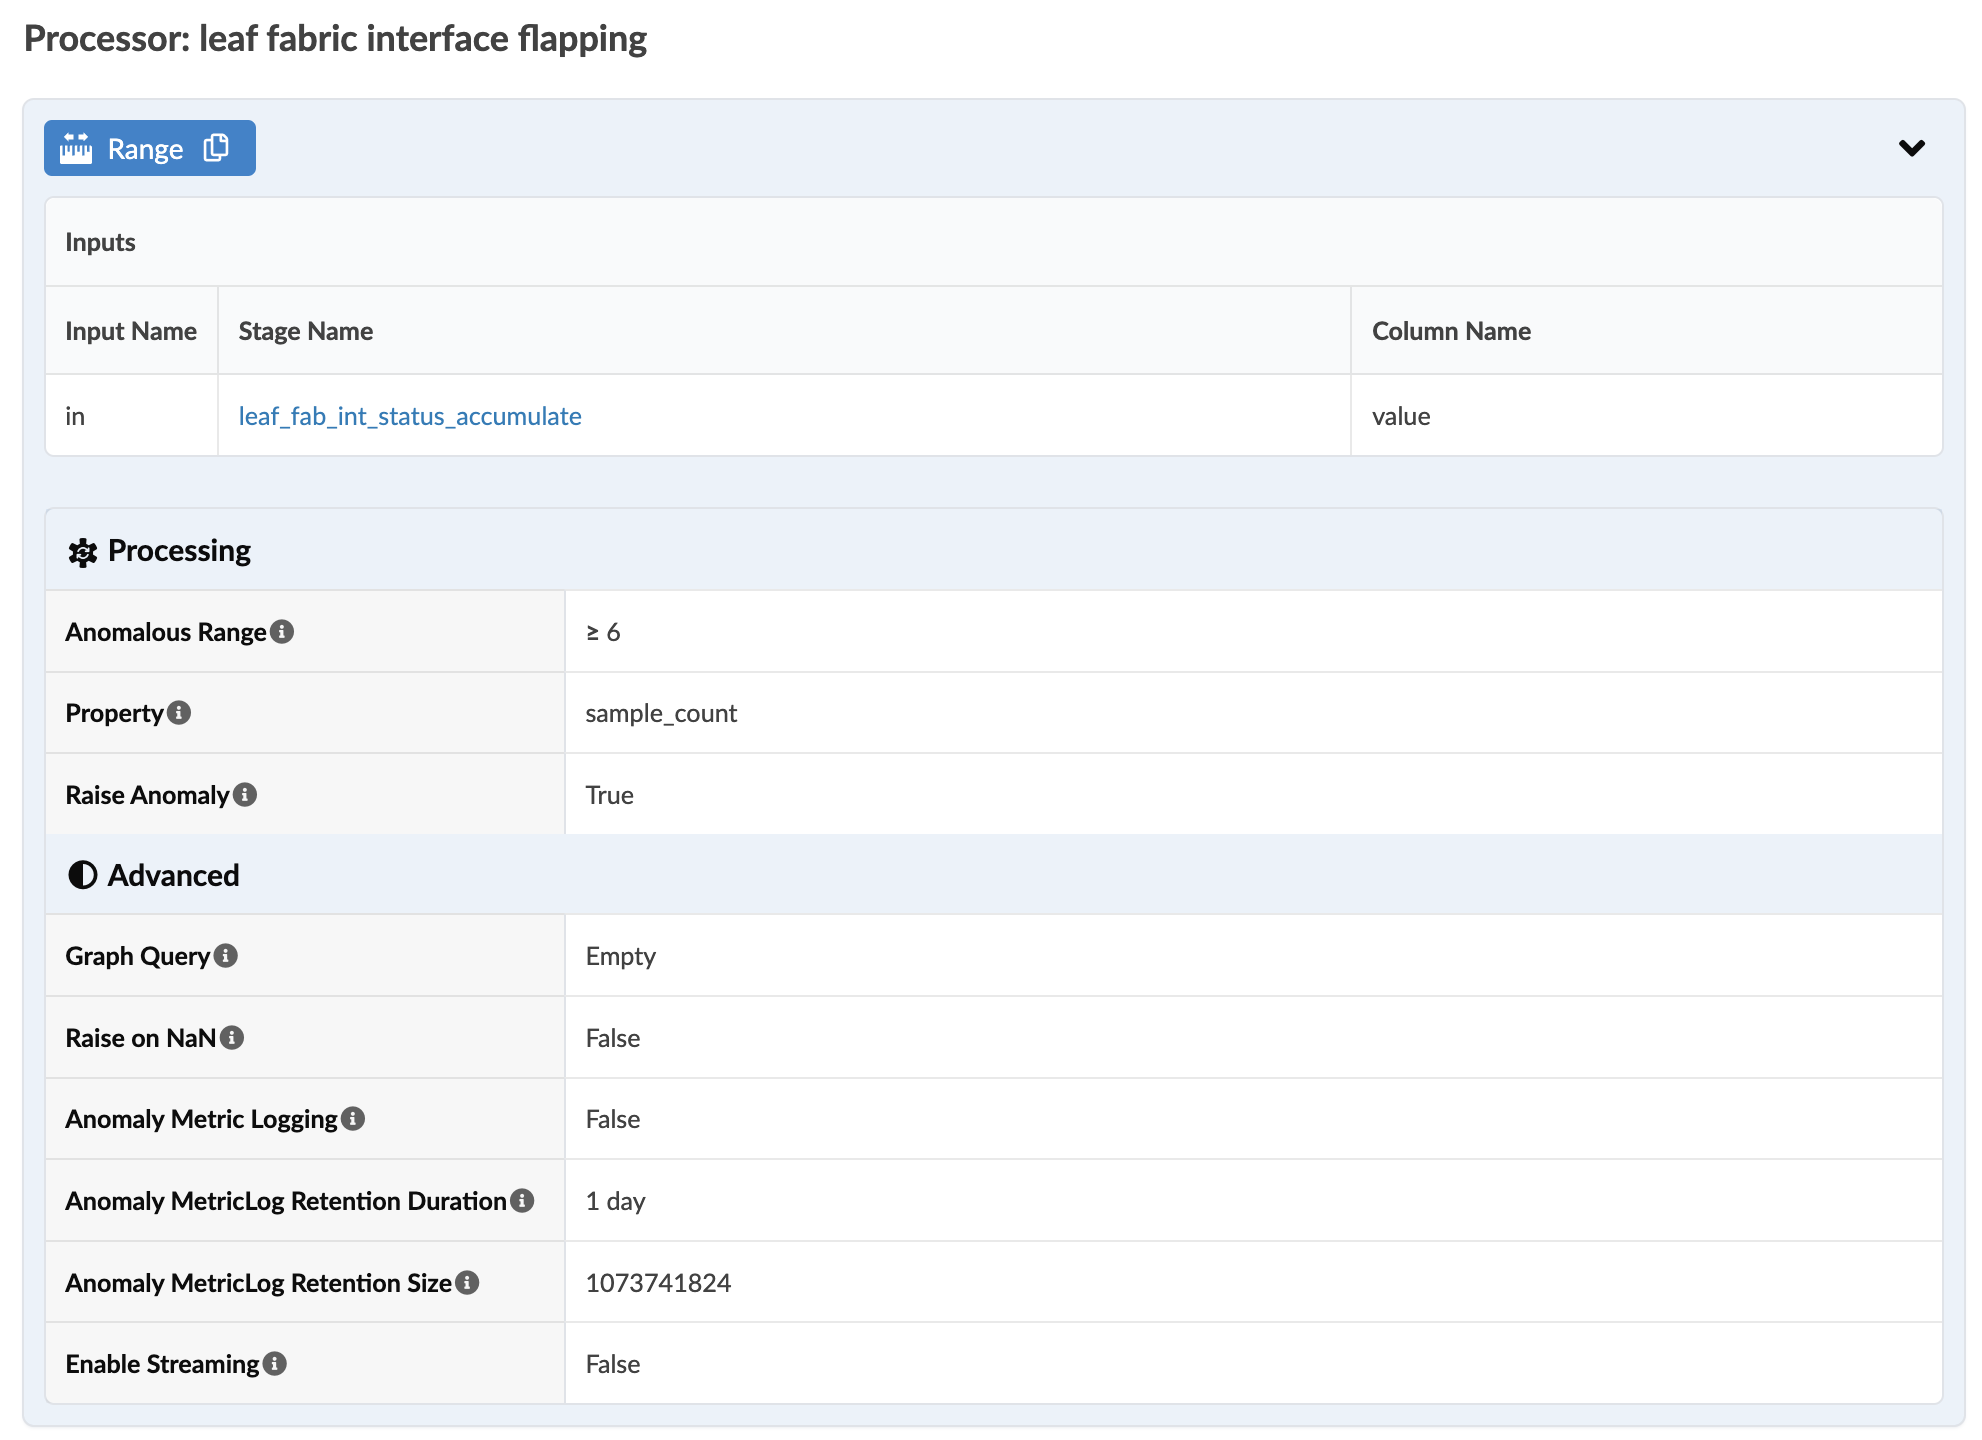
| leaf fabric interface flapping (Range) |
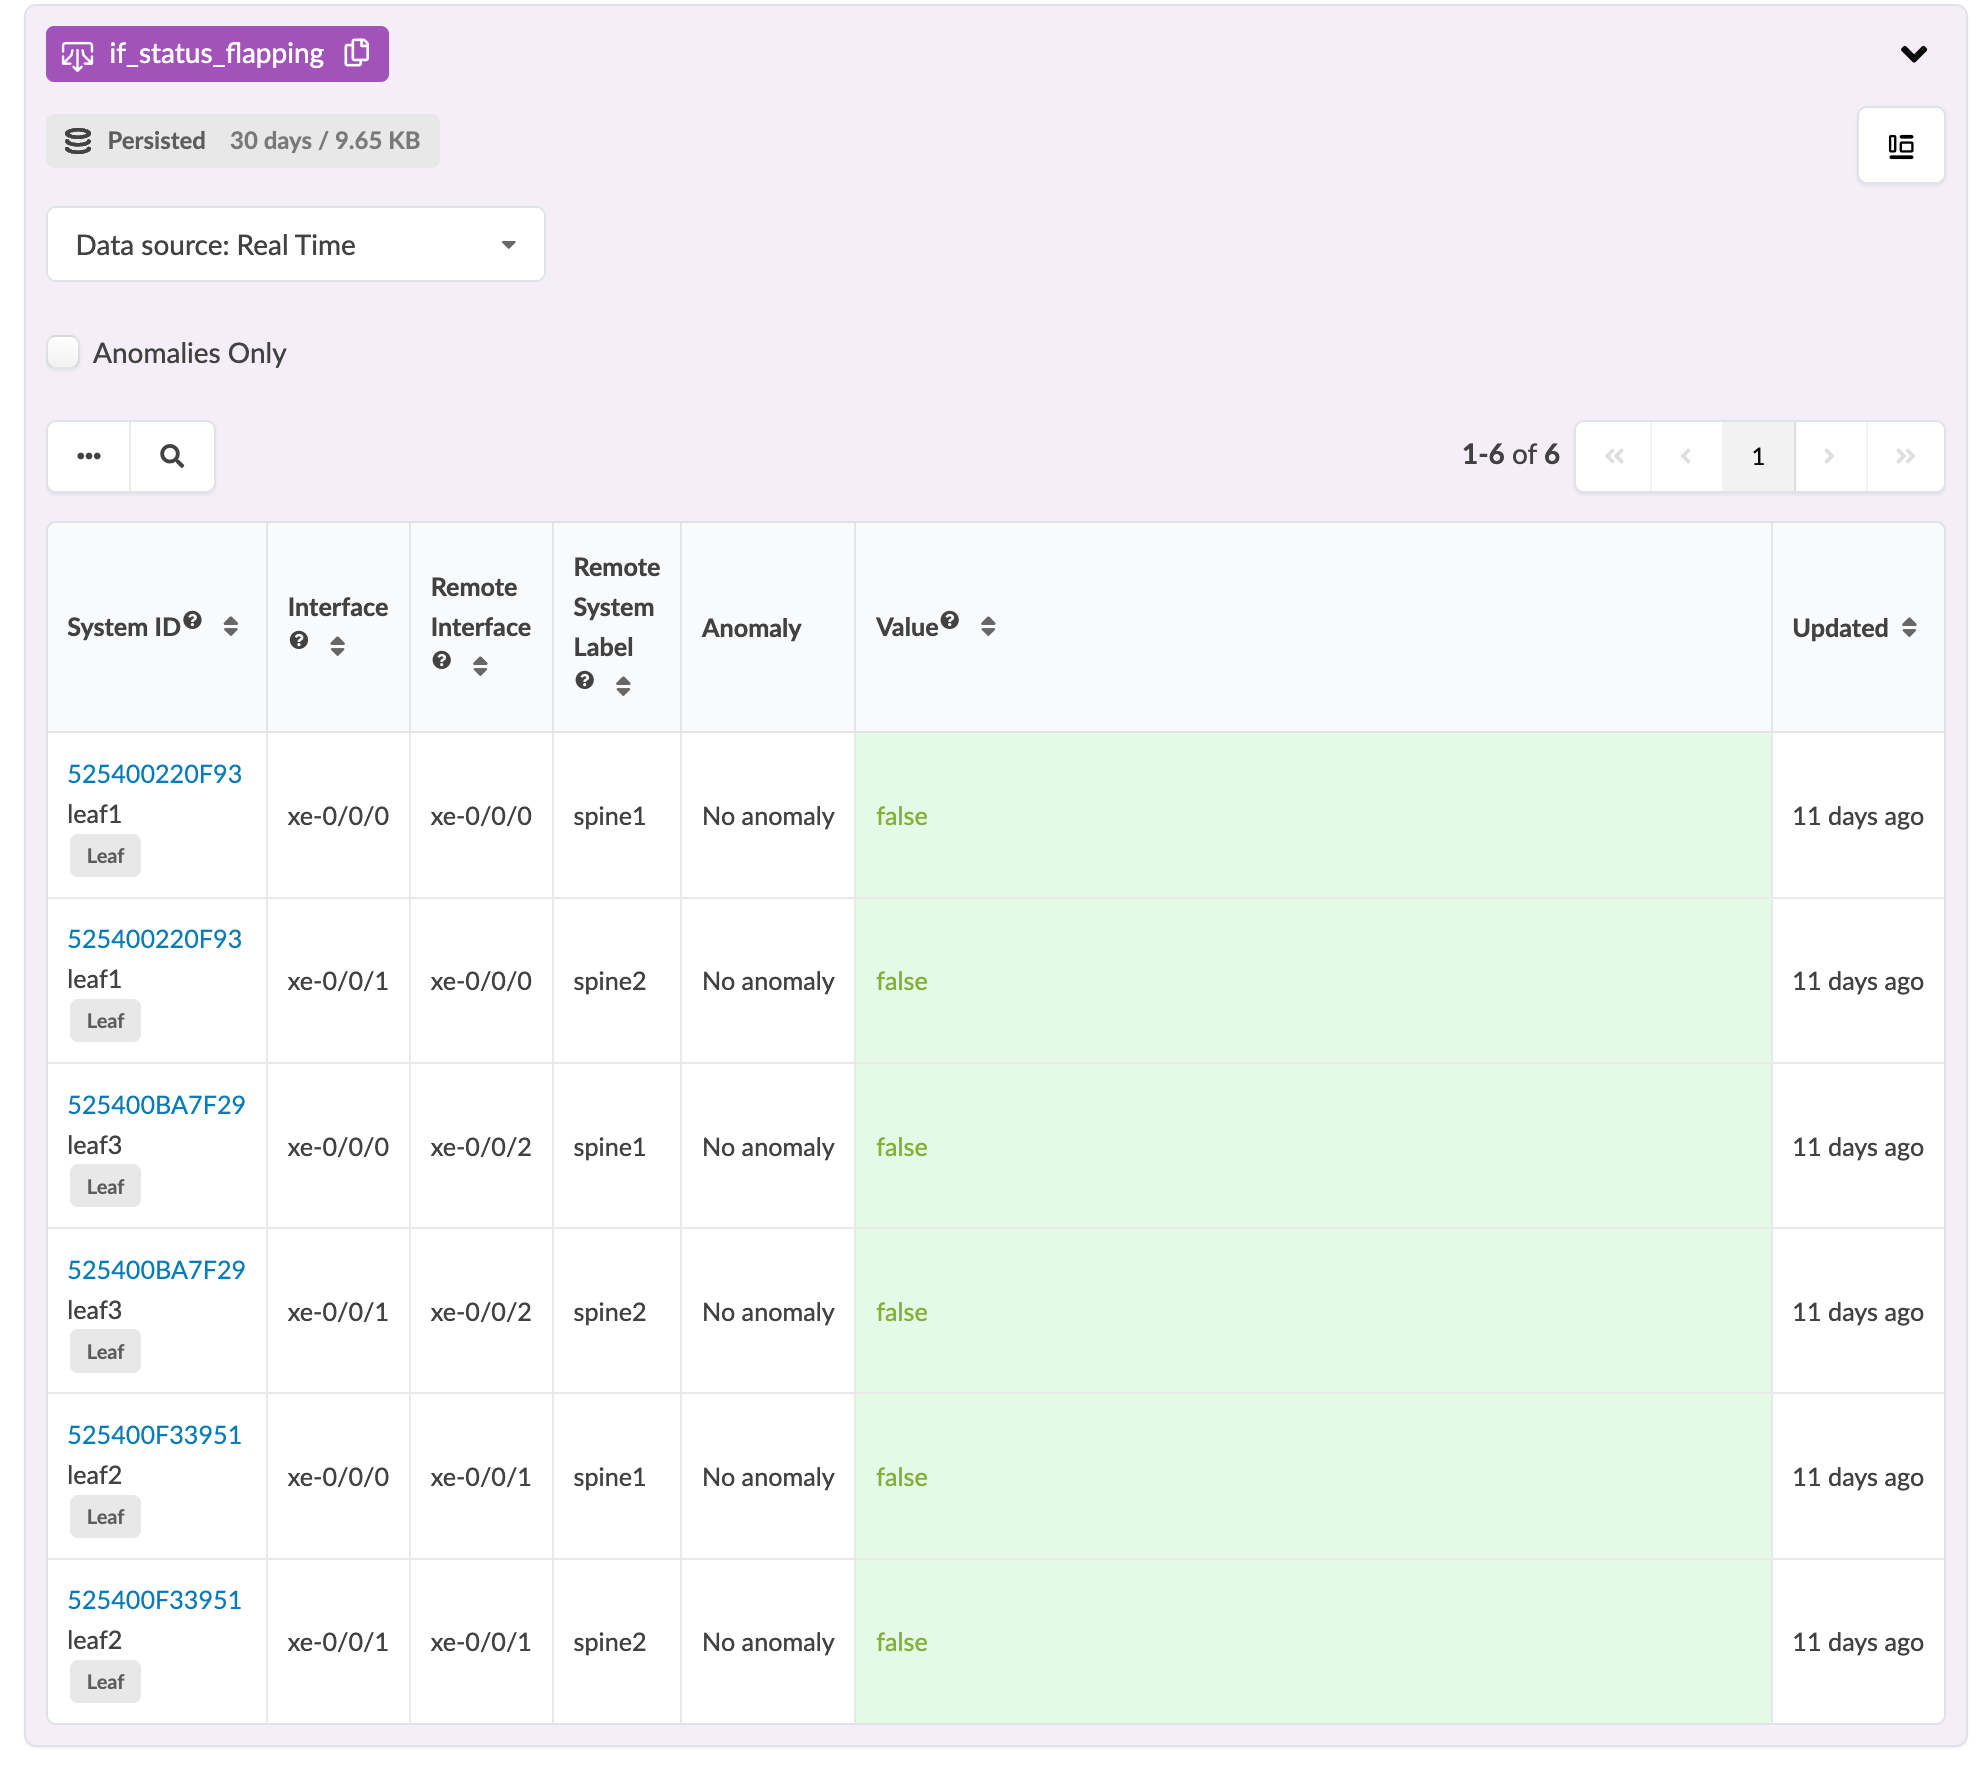
Purpose: Count the number of state changes in the leaf_fab_int_status_accumulate ("up" to "down" and "down" to "up"). If the count is higher than 'threshold' facade parameter return "true", otherwise "false". Input Stage: leaf_fab_int_status_accumulate
|
For this stage, the Range processor is configured for (collecting leaf fabric interface flapping) as shown in the screenshot below.
percentage flapping per device interfaces
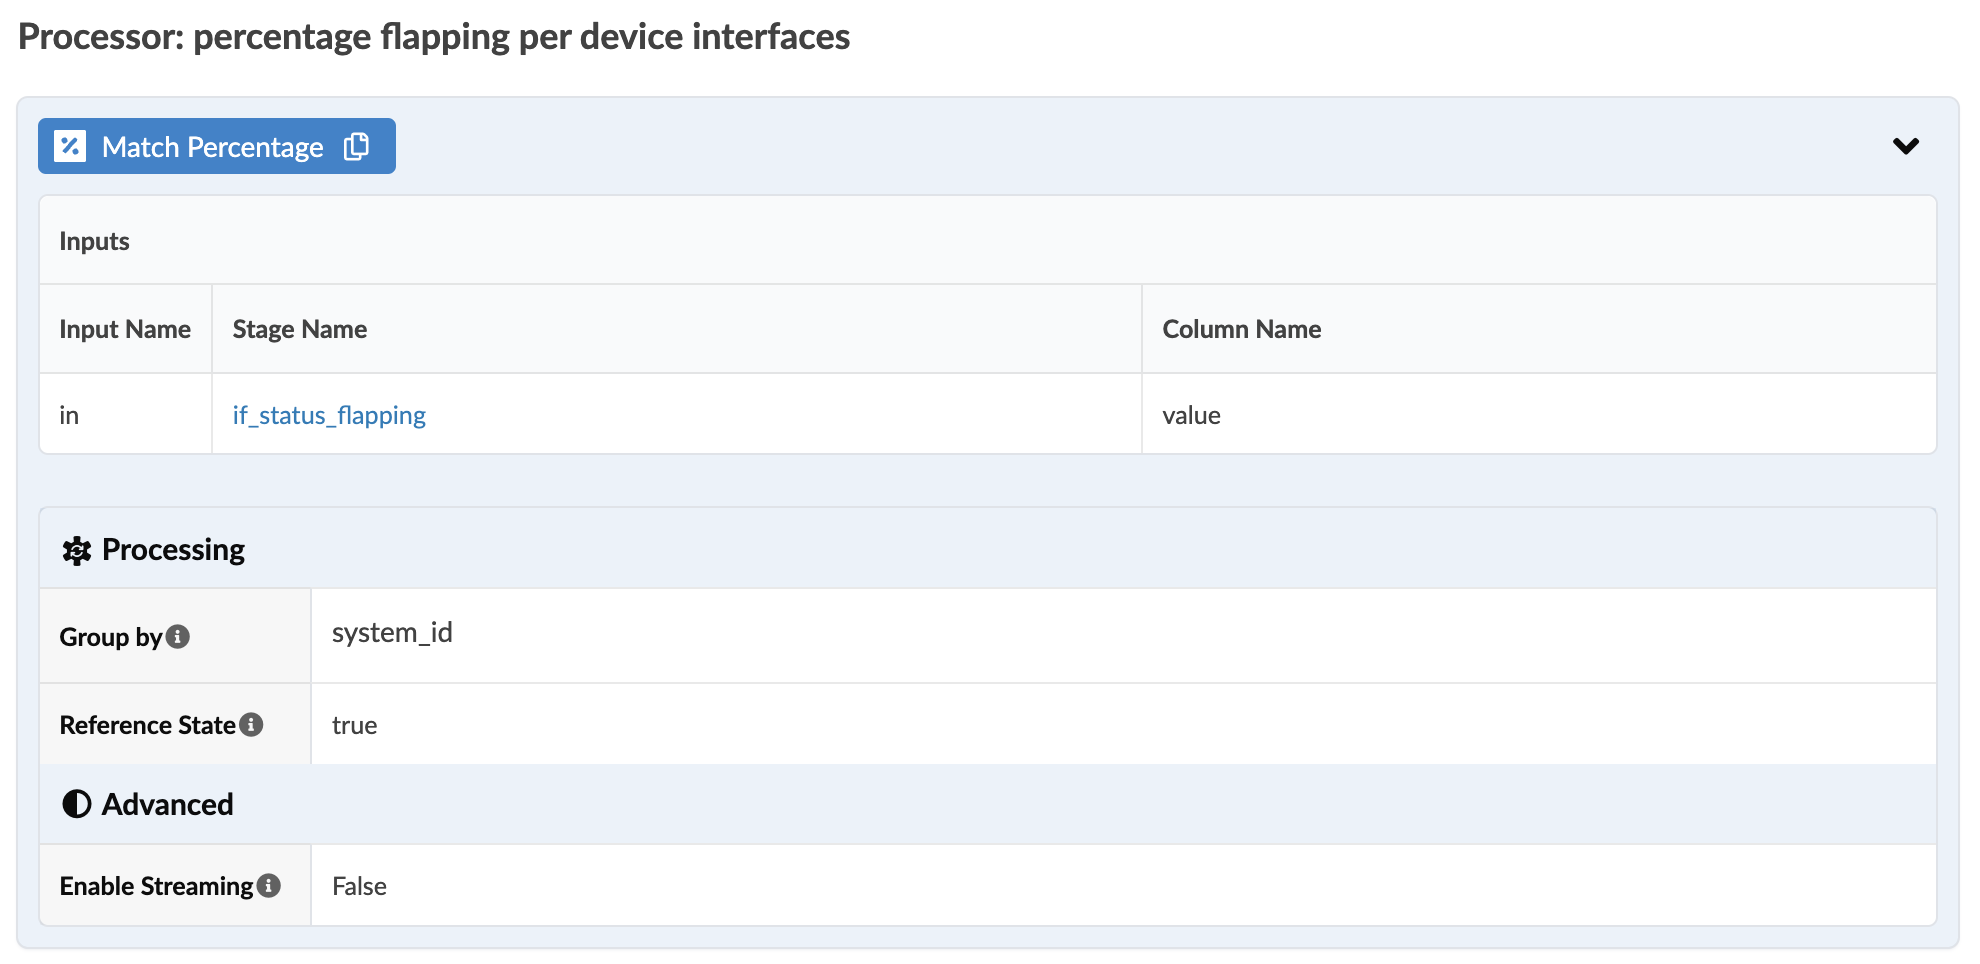
| percentage flapping per device interfaces (MatchPercentage) |
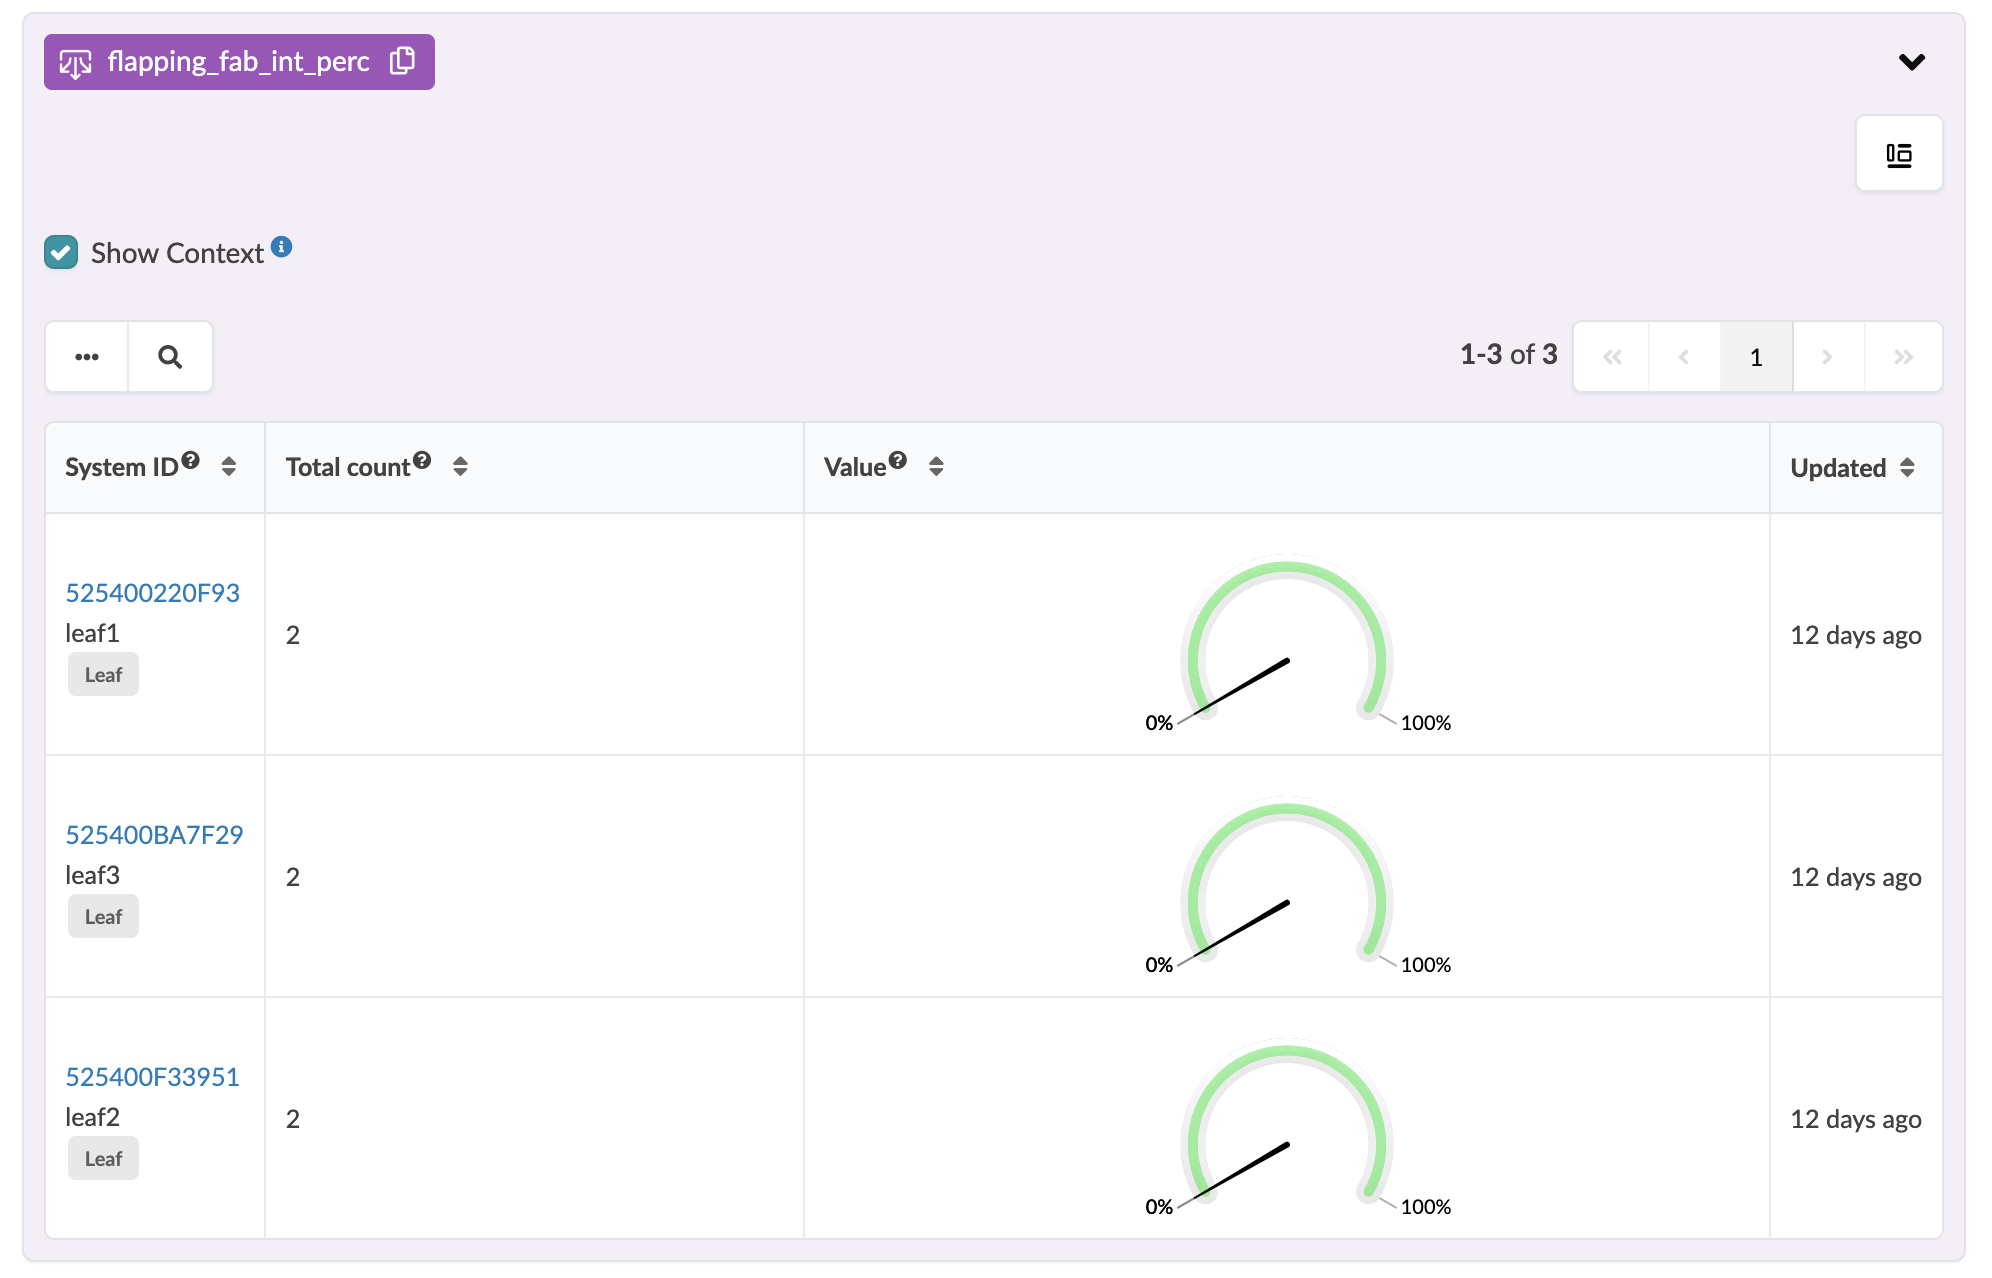
Input Stage: if_status_flapping Output Stage: flapping_fab_int_perc |
The Match Percentage Processor is configured for collecting flapping per device interfaces.
For this stage, the Match Percentage processor is configured for (collecting leaf fabric interface flapping) as shown in the screenshot below.
system anomalous flapping
| system anomalous flapping (Range) |
Input Stage: flapping_fab_int_perc
|
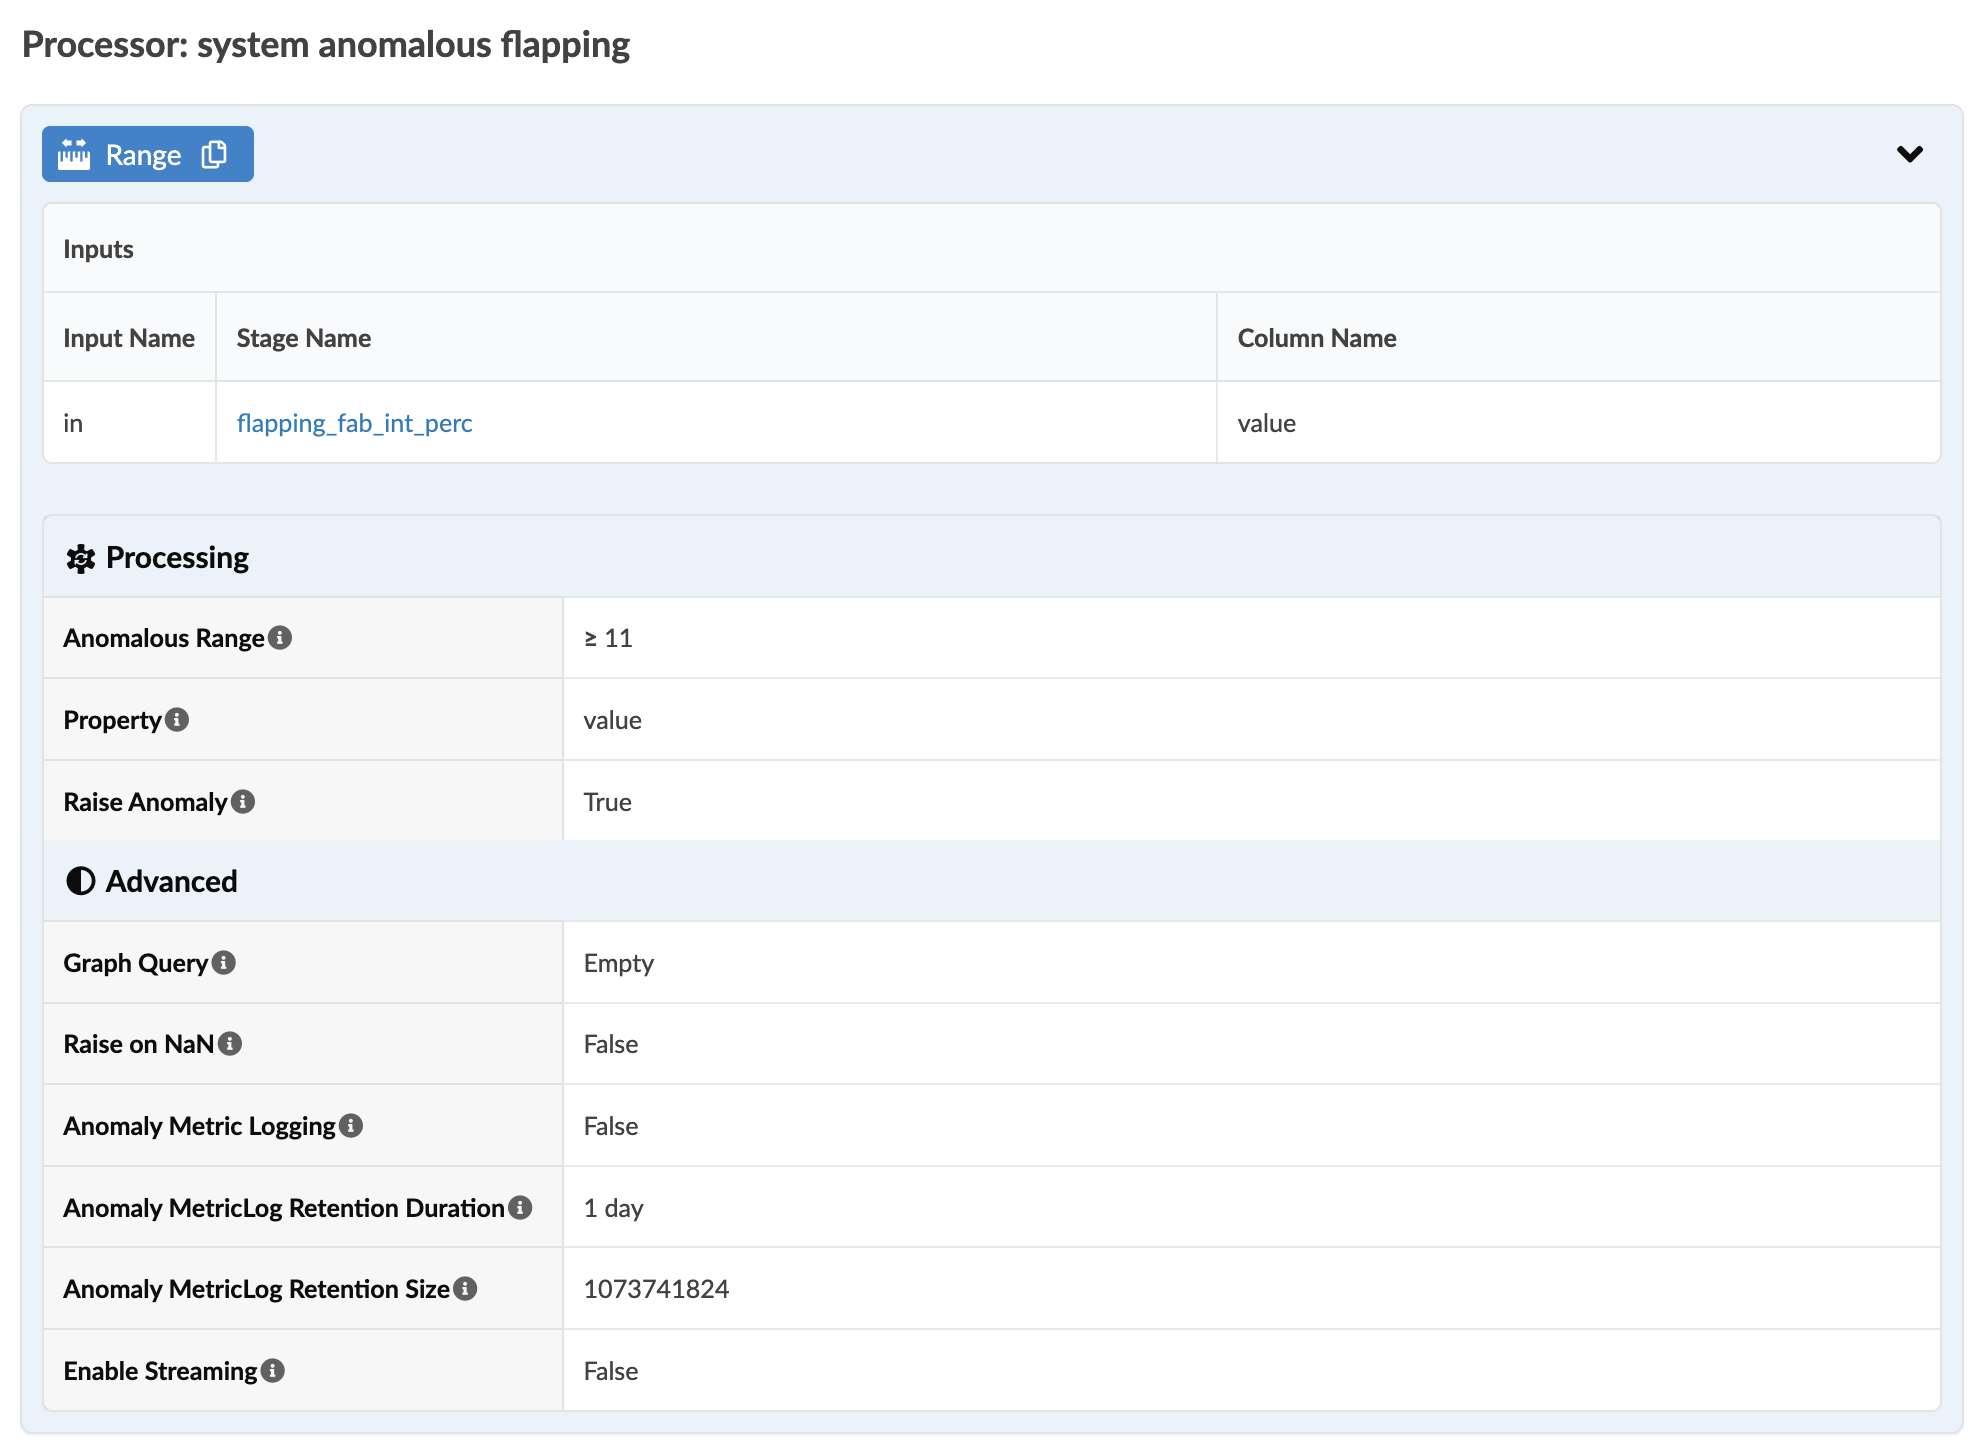
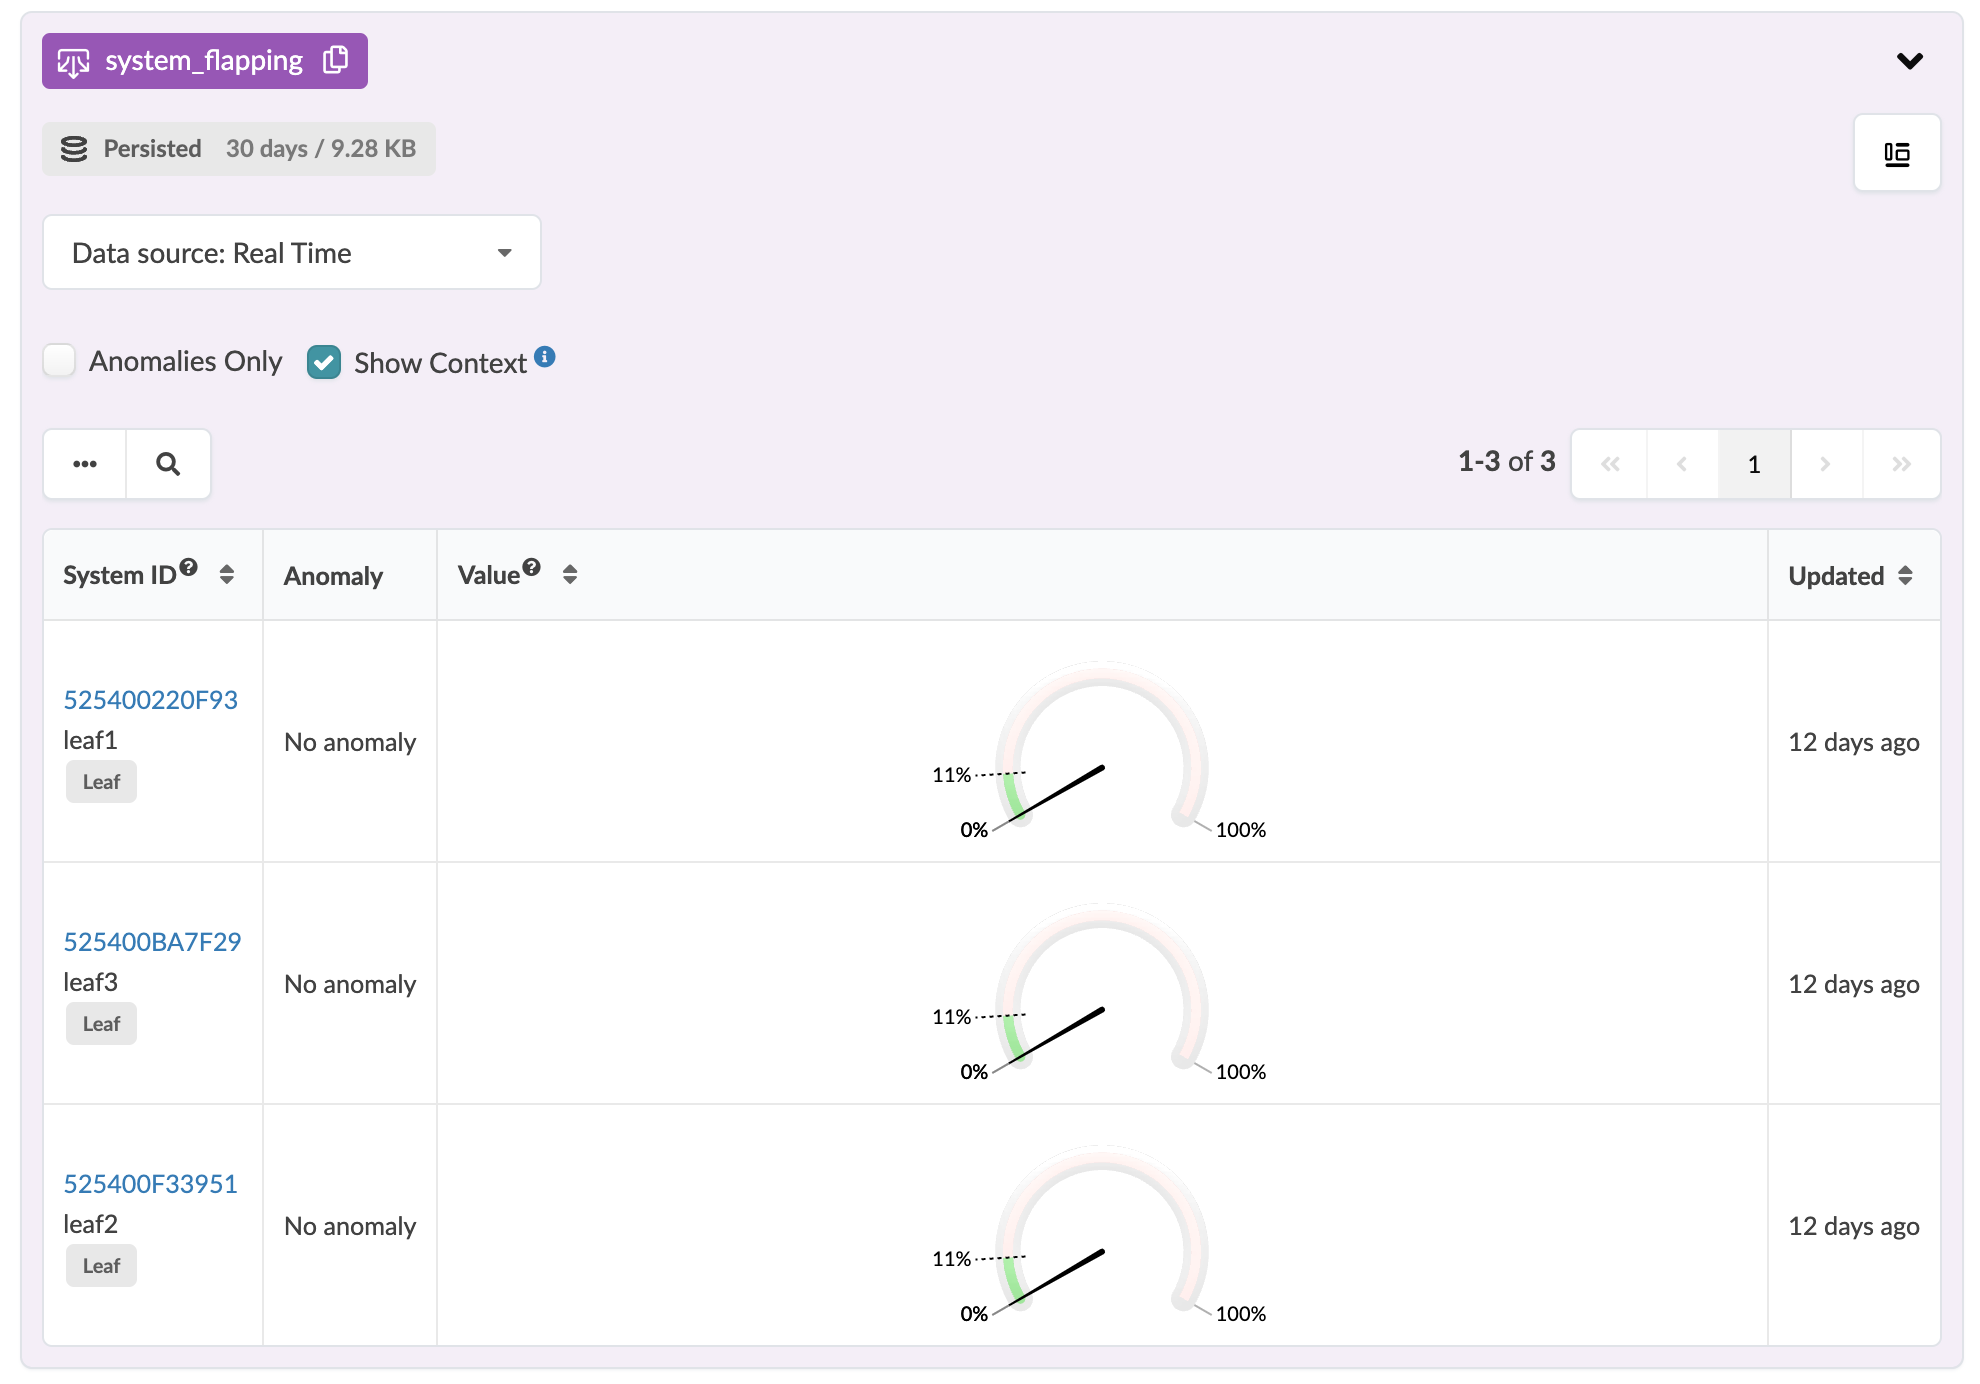
The Range Processor is configured for collecting system anomalous flapping.
For this stage, the Range processor is configured for (collecting leaf fabric interface flapping) as shown in the screenshot below.