Device Traffic Probe
The device traffic probe (previously known as headroom probe) provides insights about link capacity between two points in the network. It provides multiple interface counters (rx, tx, discard, errors and so on) for all managed devices. It displays all interface counters available for the system, their utilization on a per-port and aggregated utilization per-system basis. If rules are violated, it raises anomalies.
The predefined device traffic probe is now enabled by default and consolidates capabilities that were previously provided by six separate IBA probes. As a result, you no longer need to manually instantiate multiple probes to monitor traffic utilization, packet loss, interface errors, and ECMP load balancing.
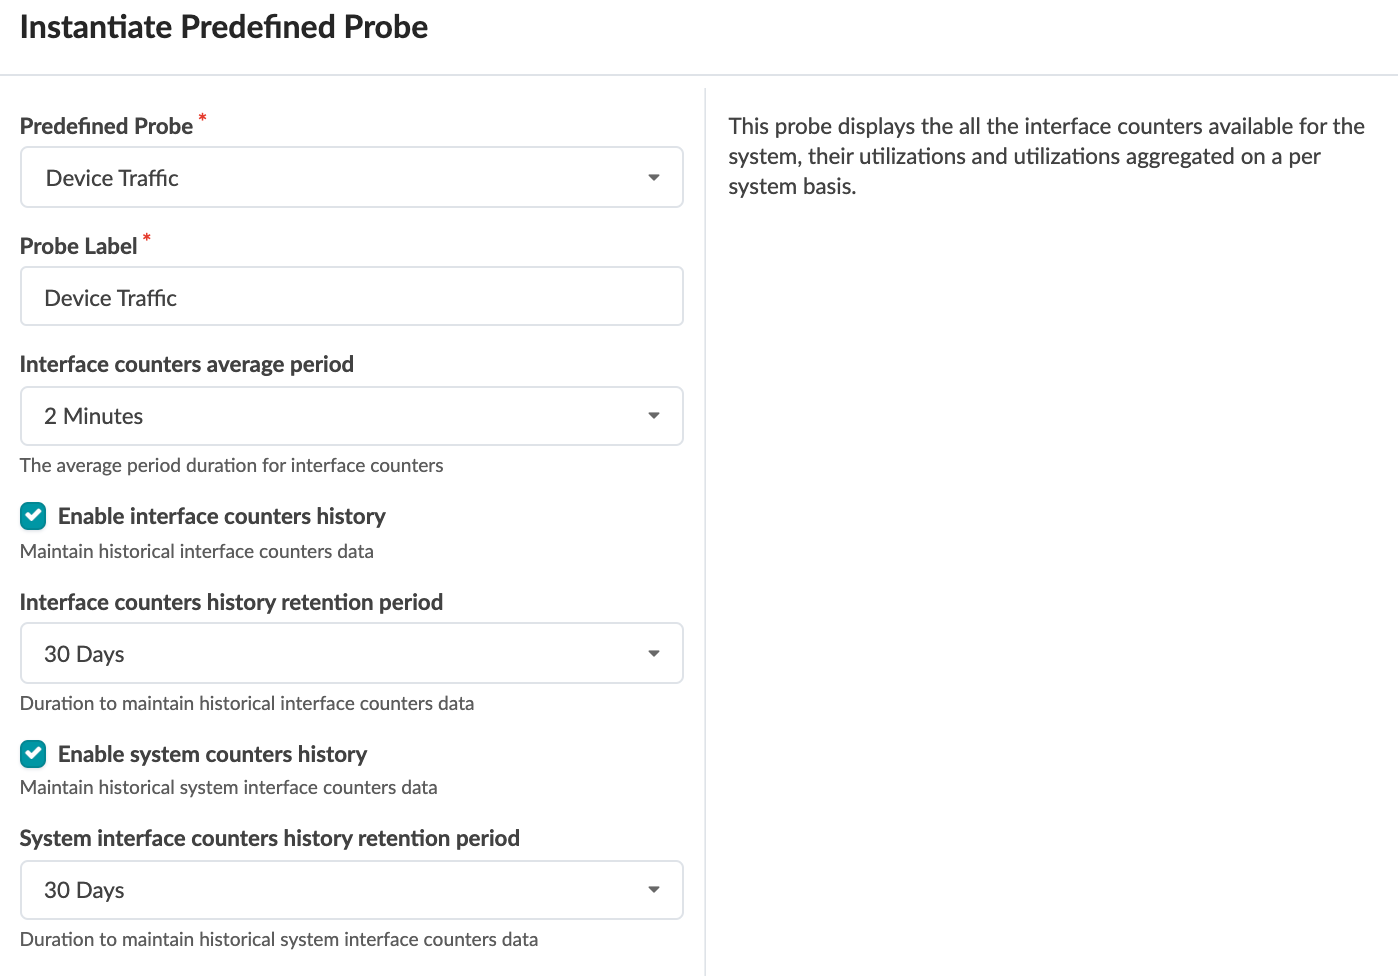
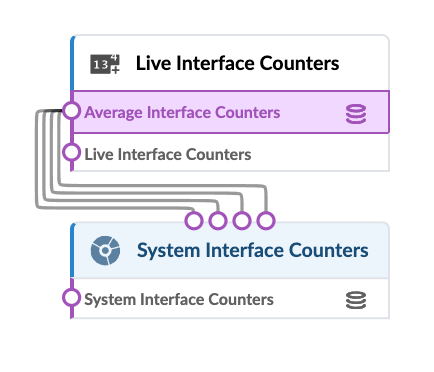
You can change probe inputs, but if you change the probe processors then the probe is not a predefined probe anymore and the traffic layer view is not available in the active topology. For more information about the traffic layer view, see Physical Blueprint.
| Source Processor |
|
||||||||
| Additional Processor(s) |
|
To see traffic between a particular source and destination from the device traffic probe,
click System Interface Counters, check the Show Context
check box, then select a source and destination from the drop-down lists. Roll over
different sections to display relevant information. Different colors represent link
capacity, where green means plenty of capacity and red means that the link is running
out of capacity. 
This probe now supports the same interface counters and functionality for GPU server interfaces.
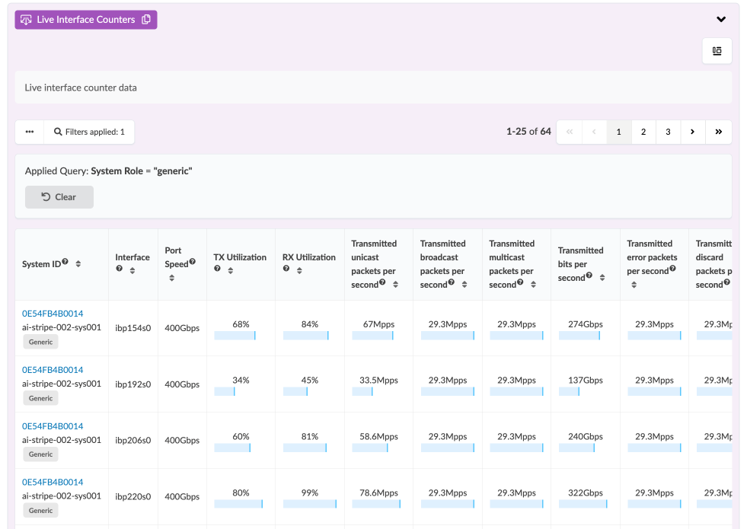
The following probe analytics are now incorporated into the Device Traffic probe:
- Hot/Cold Interface Counters (Fabric Interfaces)
- Hot/Cold Interface Counters (Spine-to-Superspine Interfaces)
- Hot/Cold Interface Counters (Specific Interfaces)
- ECMP Imbalance (Fabric Interfaces)
- ECMP Imbalance (Spine-to-Superspine Interfaces)
- Packet Discard Percentage
Rather than replicating the behavior of the existing probes, the Device Traffic probe streamlines configuration and focuses on the most valuable operational insights. The simplified design reduces configuration complexity while maintaining comprehensive visibility into network traffic conditions.
Packet Discards and Errors
The probe monitors ingress (RX) and egress (TX) packet discards and raises an anomaly when values exceed the threshold configured by Discard Percentage Threshold PPS.
The probe also monitors ingress (RX) and egress (TX) interface errors and raises an anomaly when values exceed the threshold configured by Max Error Counter Threshold PPS.
Hot Interface Counters
The probe evaluates interface counters averaged over the period configured by Interface Counters Average Period.
When utilization exceeds the threshold configured by Max Traffic Utilization Threshold Percentage, the interface is classified as hot and an anomaly is raised.
A device-level anomaly is generated when the percentage of hot interfaces exceeds the value configured by Max Hot Interface Percentage.
By default, the probe monitors:
- TX_Broadcast_PPS
- RX_Broadcast_PPS
You can extend monitoring to additional traffic types by using the Hot Traffic Counters Type setting.
ECMP Imbalance
The probe groups fabric-facing interfaces on a per-device basis and calculates the standard deviation of the TX_Bytes and RX_Bytes counters.
An anomaly is raised when the calculated traffic imbalance exceeds the threshold configured by ECMP Max Standard Deviation.
Probe Configuration
The predefined probe menu organizes settings into four functional sections to simplify navigation and configuration.
Average Periods and Retention Durations
Configure averaging intervals and data retention settings.
Bandwidth Utilization and ECMP Imbalance
Configure utilization and ECMP imbalance thresholds.
Previous releases distinguished between fabric interfaces and spine-to-superspine interfaces for ECMP monitoring. Because spine-to-superspine links are fabric interfaces, these configurations have been consolidated into a single monitoring domain. This simplification reduces configuration overhead and minimizes unnecessary anomaly variations.
Error and Packet Discard Thresholds
The probe monitors packet errors and packet discards independently for ingress (RX) and egress (TX) traffic.
This enhancement provides greater visibility than previous implementations, which monitored only ingress packet discards and did not account for egress packet drops.
Hot Interface Counters
The following counter types are available:
- TX_Unicast_PPS
- RX_Unicast_PPS
- TX_Multicast_PPS
- RX_Multicast_PPS
- TX_Broadcast_PPS (default)
- RX_Broadcast_PPS (default)
The probe monitors broadcast traffic by default because elevated broadcast rates are typically unexpected in data center environments. To monitor additional traffic types, modify the Hot Traffic Counters Type setting.
A new Minimum Interface Bandwidth Usage Percentage parameter defines the minimum traffic level required before hot-counter anomalies are evaluated. This safeguard helps prevent false positives during periods of very low traffic, where high relative broadcast percentages may not indicate an operational issue.
The cold-counter functionality included in previous Hot/Cold Interface Counter probes has been removed. Low traffic levels are expected in normal network operation and do not typically provide actionable insight.
Hot-counter thresholds are now configured as utilization percentages rather than absolute bandwidth values. This approach eliminates manual bandwidth calculations, simplifies deployment, and automatically accommodates interfaces with different speeds.
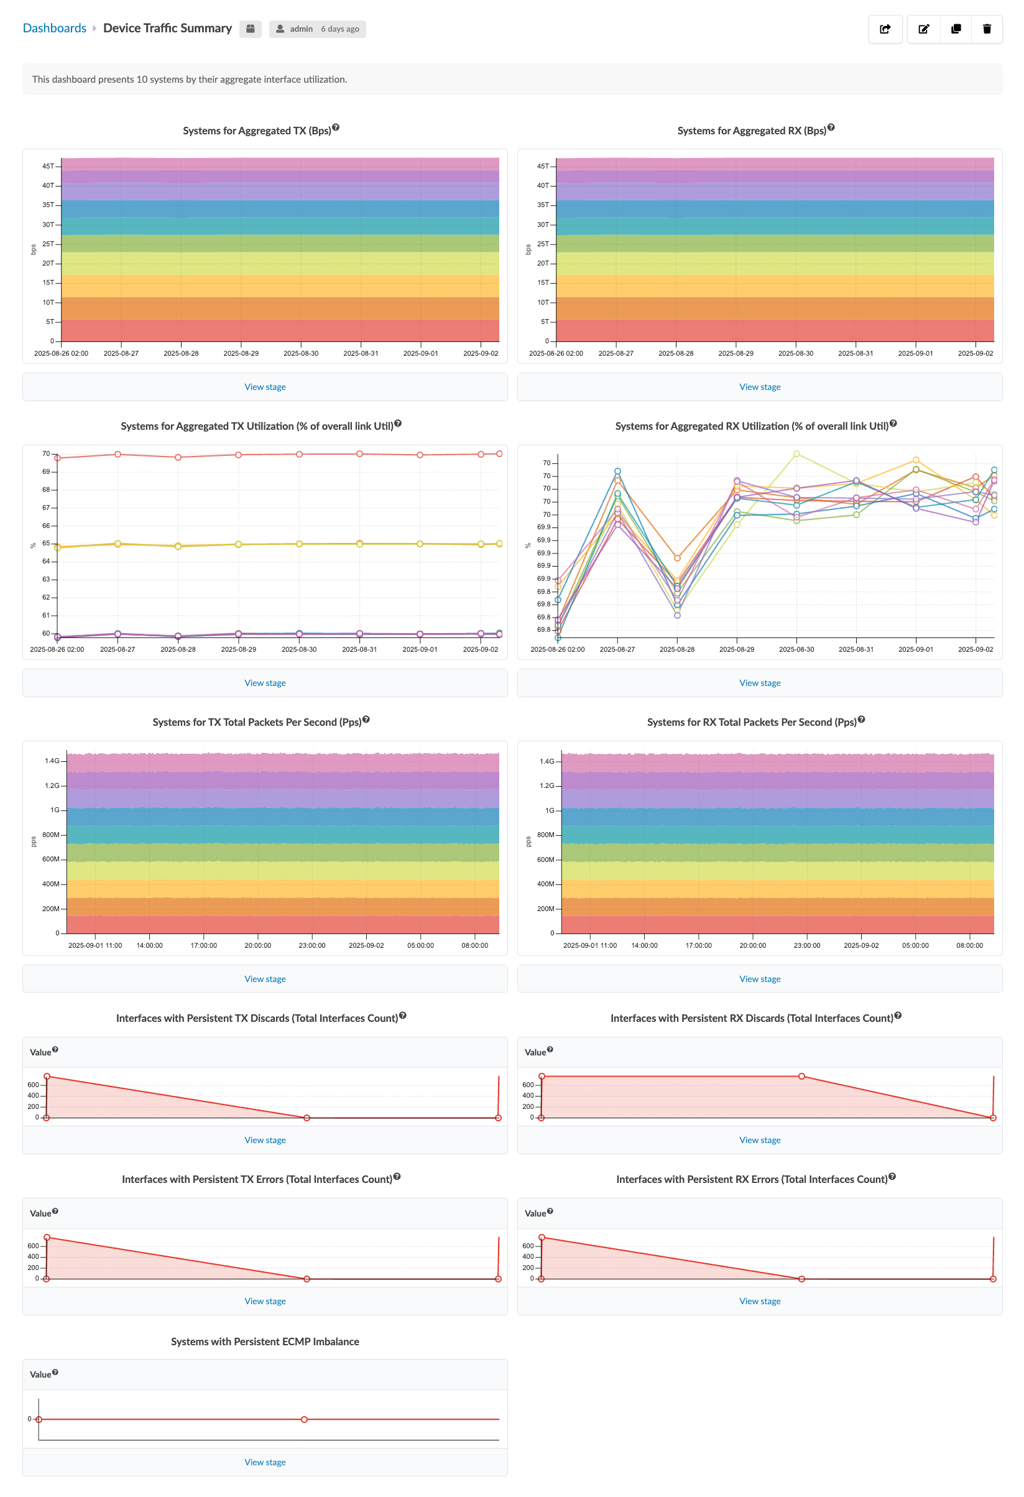
Device Traffic Summary Dashboard
A new Device Traffic Summary dashboard provides a 30-day time-series view of key traffic metrics.
The dashboard contains 11 widgets.
The first 10 widgets present system-level and interface-level metrics with separate TX and RX views:
- Systems by Aggregated Traffic (bps)
- Systems by Aggregated Traffic Utilization (%)
- Systems by Aggregated Traffic (packets per second)
- Interfaces by Packet Discards (interface count)
- Interfaces by Packet Errors (interface count)
The final widget provides visibility into ECMP load-balancing behavior:
- Systems with Persistent ECMP Imbalance (system count)
The Device Traffic Summary dashboard replaces the Device Traffic Hotspots dashboard, which has been removed.
For more information about this probe, from the blueprint, navigate to Analytics > Probes, click Create Probe, then select Instantiate Predefined Probe from the drop-down list. Select the probe from the Predefined Probe drop-down list to see details specific to the probe.