Application Security on NFX Devices
Application Security on NFX Devices
The AppSecure feature is a suite of application-aware security services that deliver security services to provide visibility and control over the types of applications traversing in the networks. AppSecure uses a sophisticated classification engine to accurately identify applications regardless of port or protocol, including nested applications that reside within trusted network services.
The AppSecure feature comprises of the following services:
Application identification (AppID)- Recognizes traffic at different network layers using characteristics other than port number. Once the application is determined, AppSecure service modules can be configured to monitor and control traffic for tracking, prioritization, access control, detection, and prevention based on the application ID of the traffic. For more information, see Application Identification for NFX Devices .
Application Tracking (AppTrack)—Tracks and reports applications passing through the device. For more information, see Application Tracking on NFX Devices .
Application Firewall (AppFW)—Implements an application firewall using application-based rules. For more information, see Application Firewall on NFX Devices .
Application Quality of Experience (AppQoE)—AppQoE leverages the capabilities of two application security services: Application Identification (AppID) and Advanced Policy-Based Routing (APBR). For more information, see Application Quality of Experience.
Advanced policy-based routing (APBR)— Classifies session based on applications and applies the configured rules to reroute the traffic. For more information, see Application Policy-Based Routing on NFX Devices .
AppSecure works with additional content security on the device through integrated Content Security , intrusion prevention systems (IPS), and Juniper Networks Juniper Advanced Threat Prevention Cloud (ATP Cloud) for deeper protection against malware, spam, phishing, and application exploits.
See Also
Application Identification for NFX Devices
Application Identification enables you to see the applications on your network and learn how they work, their behavioral characteristics, and their relative risk. Using different identification mechanisms, App ID detects the applications on your network regardless of the port, protocol, and encryption (TLS/SSL or SSH) or other evasive tactics used. For more information, see the following topics:
- Understanding Application Identification Techniques
- Understanding the Junos OS Application Identification Database
- Disabling and Reenabling Junos OS Application Identification
- Understanding the Application System Cache
- Enabling or Disabling Application System Cache for Application Services
- Verifying Application System Cache Statistics
- Onbox Application Identification Statistics
- Understanding Jumbo Frames Support for Junos OS Application Identification Services
- Improving the Application Traffic Throughput
Understanding Application Identification Techniques
Historically, firewalls have used the IP address and port numbers as a way of enforcing policies. That strategy is based on the assumption that users connect to the network from fixed locations and access particular resources using specific port numbers.
Today, wireless networking and mobile devices require a different strategy. The way in which devices connect to the network changes rapidly. An individual can connect to the network using multiple devices simultaneously. It is no longer practical to identify a user, application, or device by a group of statically allocated IP addresses and port numbers.
This topic includes the following section:
- Junos OS Next-Generation Application Identification
- Benefits of Application Identification
- Application Signature Mapping
- Application Identification Match Sequence
Junos OS Next-Generation Application Identification
Next-generation application identification builds on the legacy application identification functionality and provides more effective detection capabilities for evasive applications such as Skype, BitTorrent, and Tor.
Junos OS application identification recognizes Web-based and other applications and protocols at different network layers using characteristics other than port number. Applications are identified by using a protocol bundle containing application signatures and parsing information. The identification is based on protocol parsing and decoding and session management.
The detection mechanism has its own data feed and constructs to identify applications.
The following features are supported in application identification:
-
Support for protocols and applications, including video streaming, peer-to-peer communication, social networking, and messaging
-
Identification of services within applications
-
Ability to distinguish actions launched within an application (such as login, browse, chat, and file transfer)
-
Support for all versions of protocols and application decoders and dynamic updates of decoders
-
Support for encrypted and compressed traffic and most complex tunneling protocols
-
Ability to identify all protocols from Layer 3 to Layer 7 and above Layer 7
Benefits of Application Identification
Provides granular control over applications, including video streaming, peer-to-peer communication, social networking, and messaging. It also identifies services, port usage, underlying technology, and behavioral characteristics within applications. This visibility enables you to block evasive applications inline at the NFX Series firewall.
Identifies applications and allows, blocks, or limits applications—regardless of port or protocol, including applications known for using evasive techniques to avoid identification. This identification helps organizations control the types of traffic allowed to enter and exit the network.
Application Signature Mapping
Application signature mapping is a precise method of identifying the application that issued traffic on the network. Signature mapping operates at Layer 7 and inspects the actual content of the payload.
Applications are identified by using a downloadable protocol bundle. Application signatures and parsing information of the first few packets are compared to the content of the database. If the payload contains the same information as an entry in the database, the application of the traffic is identified as the application mapped to that database entry.
Juniper Networks provides a predefined application identification database that contains entries for a comprehensive set of known applications, such as FTP and DNS, and applications that operate over the HTTP protocol, such as Facebook, Kazaa, and many instant messaging programs. A signature subscription allows you to download the database from Juniper Networks and regularly update the content as new predefined signatures are added.
Application Identification Match Sequence
Figure 1 shows the sequence in which mapping techniques are applied and how the application is determined.
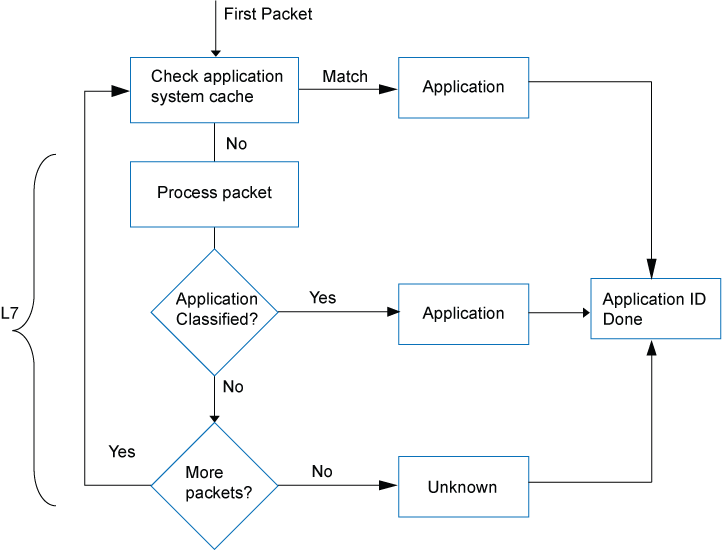
In application identification, every packet in the flow passes through the application identification engine for processing until the application is identified. Application bindings are saved in the application system cache (ASC) to expedite future identification process.
Application signatures identify an application based on protocol grammar analysis in the first few packets of a session. If the application identification engine has not yet identified the application, it passes the packets and waits for more data.
The application identification module matches applications for both client-to-server and server-to-client sessions.
Once the application is determined, AppSecure service modules can be configured to monitor and control traffic for tracking, prioritization, access control, detection, and prevention based on the application ID of the traffic.
-
AppTrack—Tracks and reports applications passing through the device.
-
Intrusion Detection and Prevention (IDP)—Applies appropriate attack objects to applications running on nonstandard ports. Application identification improves IDP performance by narrowing the scope of attack signatures for applications without decoders.
-
AppFW—Implements an application firewall using application-based rules.
-
AppQoS—Provides quality-of-service prioritization based on application awareness.
See Also
Understanding the Junos OS Application Identification Database
A predefined signature database is available on the Juniper Networks Security Engineering website. This database includes a library of application signatures.
The predefined signature package provides identification criteria for known application signatures and is updated periodically.
Whenever new applications are added, the protocol bundle is updated and generated for all relevant platforms. It is packaged together with other application signature files. This package will be available for download through the security download website.
A subscription service allows you to regularly download the latest signatures for up-to-date coverage without having to create entries for your own use.
Application identification is enabled by default and is automatically turned on when you configure Intrusion Detection and Prevention (IDP), AppFW, AppQoS, or AppTrack.
Updates to the Junos OS predefined application signature package are authorized by a separately licensed subscription service. You must install the application identification application signature update license key on your device to download and install the signature database updates provided by Juniper Networks. When your license key expires, you can continue to use the locally stored application signature package contents but you cannot update the package.
See Also
Disabling and Reenabling Junos OS Application Identification
Application identification is enabled by default. You can disable application identification with the CLI.
To disable application identification:
user@host# set services application-identification no-application-identification
If you want to reenable application identification, delete the configuration statement that specifies disabling of application identification:
user@host# delete services application-identification no-application-identification
If you are finished configuring the device, commit the configuration.
To verify the configuration, enter the show services
application-identification command.
See Also
Understanding the Application System Cache
Application system cache (ASC) saves the mapping between an application type and the corresponding destination IP address, destination port, protocol type, and service. Once an application is identified, its information is saved in the ASC so that only a matching entry is required to identify an application running on a particular system, thereby expediting the identification process.
By default, the ASC saves the mapping information for 3600 seconds. However, you can configure the cache timeout value by using the CLI.
You can use the [edit services application-identification application-system-cache-timeout] command to change the timeout value for the application system cache entries. The timeout value can be configured from 0 through 1,000,000 seconds. The ASC session might expire after 1000,000 seconds.
ASC entries expire after the configured ASC timeout. ASC entries are not refreshed even when there are cache hits (matching entry in ASC found) during the timeout period.
When you configure a new custom application signature or modify an existing custom signature, all the existing application system cache entries for predefined and custom applications will be cleared.
When you delete or disable a custom application signature, and the configuration commit fails, the application system cache (ASC) entry is not cleared completely; instead, a base application in the path of custom application will be reported in ASC.
See Also
Enabling or Disabling Application System Cache for Application Services
Starting in Junos OS Release 18.2R1, the default behavior of the ASC is changed as follows:
-
Security services including security policies, application firewall (AppFW), application tracking (AppTrack), application quality of service (AppQoS), Juniper Sky ATP, IDP, and UTM do not use the ASC by default.
-
Miscellaneous services including advanced policy-based routing (APBR) use the ASC for application identification by default.
The change in the default behavior of the ASC affects the legacy AppFW functionality. With the ASC disabled by default for the security services starting in Junos OS Release 18.2 onward, AppFW will not use the entries present in the ASC.
You can revert to the ASC behavior as in Junos OS releases before Release 18.2 by using the set services application-identification application-system-cache security-services command.
The security device might become susceptible to application evasion techniques if the ASC is enabled for security services. We recommend that you enable the ASC only when the performance of the device in its default configuration (disabled for security services) is not sufficient for your specific use case.
Use the following commands to enable or disable the ASC:
-
Enable the ASC for security services:
user@host# set services application-identification application-system-cache security-services
-
Disable the ASC for miscellaneous services:
user@host# set services application-identification application-system-cache no-miscellaneous-services
-
Disable the enabled ASC for security services:
user@host# delete services application-identification application-system-cache security-services
-
Enable the disabled ASC for miscellaneous services:
user@host# delete services application-identification application-system-cache no-miscellaneous-services
You can use the show services application-identification application-system-cache command to verify the status of the ASC.
The following sample output provides the status of the ASC:
user@host>show services application-identification
                        application-system-cache
Application System Cache Configurations:
  application-cache: on
    Cache lookup for security-services: off
    Cache lookup for miscellaneous-services: on
  cache-entry-timeout: 3600 seconds
In releases before Junos OS Release 18.2R1, application caching was enabled by
default. You can manually disable it by using the set services
application-identification no-application-system-cache command.
user@host# set services application-identification no-application-system-cache
See Also
Verifying Application System Cache Statistics
Verify the application system cache (ASC) statistics.
The application system cache will display the cache for application identification applications
Action
From CLI operation mode, enter the show services application-identification application-system-cache command.
Sample Output
user@host> show services application-identification
                            application-system-cache
application-cache: on
  nested-application-cache: on
  cache-unknown-result: on
  cache-entry-timeout: 3600 seconds
Meaning
The output shows a summary of the ASC statistics information. Verify the following information:
-
IP address—Displays the destination address.
-
Port—Displays the destination port on the server.
-
Protocol—Displays the protocol type on the destination port.
-
Application—Displays the name of the application identified on the destination port.
Onbox Application Identification Statistics
Application Identification services provide statistical information per session. These statistics provide customers with an application usage profile. The Onbox Application Identification Statistics feature adds application-level statistics to the AppSecure suite. Application statistics allow an administrator to access cumulative statistics as well as statistics accumulated over user-defined intervals.
With this feature, the administrator can clear the statistics and configure the interval values while maintaining bytes and session count statistics. Because the statistics count occurs at session close event time, the byte and session counts are not updated until the session closes. Juniper Networks’ devices support a history of eight intervals that an administrator can use to display application session and byte counts.
If application grouping is supported in your configuration of Junos OS, then the Onbox Application Identification Statistic feature supports onbox per-group matching statistics. The statistics are maintained for predefined groups only.
Reinstalling an application signature package will not clear the application statistics. If the application is disabled, there will not be any traffic for that application, but the application is still maintained in the statistics. It does not matter if you are reinstalling a predefined application, because applications are tracked according to application type. For predefined group statistics, reinstalling a security package will not clear the statistics. However, any changes to group memberships are updated. For example, junos:web might have 50 applications in the current release and 60 applications following an upgrade. Applications that are deleted and application groups that are renamed are handled in the same way as applications that are added.
The Application Identification module maintains a 64-bit session counters for each application on each Services Processing Unit (SPU). The counter increments when a session is identified as a particular application. Another set of 64-bit counters aggregates the total bytes per application on the SPU. Counters for unspecified applications are also maintained. Statistics from multiple SPUs for both sessions and bytes are aggregated on the Routing Engine and presented to the users.
Individual SPUs have interval timers to roll over statistics per interval time. To configure the interval for statistics collection, use the set services application-identification statistics interval time command. Whenever the Routing Engine queries for the required interval, the corresponding statistics are fetched from each SPU, aggregated in the Routing Engine and presented to the user.
Use the clear services application-identification statistics to clear all application statistics such as cumulative, interval, applications, and application groups.
Use the clear services application-identification counter command to reset the counters manually. Counters reset automatically when a device is upgraded or rebooted, when flowd restarts, or when there is a change in the interval timer.
Use the set services application-identification application-system-cache-timeout value to specify the timeout value in seconds for the application system cache entries.
Configuring IMAP Cache Size
Internet Message Access Protocol (IMAP) is an Internet standard protocol used by e-mail clients for e-mail storage and retrieval services. IMAP cache is used for protocol parsing and context generation. It stores parsing related information of an email.
You can configure to limit the maximum number of entries in the IMAP cache and specify the timeout value for the entries in the cache.
You can use the following commands to modify the settings for IMAP cache:
set services application-identification imap-cache imap-cache-size size
set services application-identification imap-cache imap-cache-timeout time in seconds
Example:
[edit]
user@host# set services application-identification imap-cache imap-cache-size 50000
In this example, the IMAP cache size is configured to store 50,000 entries.
[edit]
user@host# set services application-identification imap-cache-timeout 600
In this example, time out period is configured to 600 seconds during which a cache entry remains in IMAP cache.
Understanding Jumbo Frames Support for Junos OS Application Identification Services
Application identification support the larger jumbo frame size of 9192 bytes. Although jumbo frames are enabled by default, you can adjust the maximum transmission unit (MTU) size by using the [set interfaces] command. CPU overhead can be reduced while processing jumbo frames.
See Also
Improving the Application Traffic Throughput
The application traffic throughput can be improved by setting the deep packet inspection (DPI) in performance mode with default packet inspection limit as two packets, including both client-to-server and server-to-client directions. By default, performance mode is disabled on NFX Series devices.
To improve the application traffic throughput:
Enable the DPI performance mode.
[edit]
user@host# set services application-identification enable-performance-mode
(Optional) You can set the maximum packet threshold for DPI performance mode, including both client-to-server and server-to-client directions.
You can set the packet inspection limit from 1 through 100.
[edit]
user@host# set services application-identification enable-performance-mode max-packet-threshold value
Commit the configuration.
[edit]
user@host# commit
Use the show services application-identification status command to display detailed information about application identification status.
show services application-identification status (DPI Performance Mode Enabled)
user@host> show services application-identification
                        status
pic: 2/1

Application Identification
Status                            Enabled
Sessions under app detection      0
Engine Version                    4.18.2-24.006 (build date Jul 30 2014)
Max TCP session packet memory     30000
Force packet plugin               Disabled
Force stream plugin               Disabled
DPI Performance mode:             Enabled
Statistics collection interval    1 (in minutes)

Application System Cache
Status                            Enabled
Negative cache status             Disabled
Max Number of entries in cache    262144
Cache timeout                     3600 (in seconds)

Protocol Bundle
Download Server                   https://signatures.juniper.net/cgi-bin/index.cgi
AutoUpdate                        Disabled
Slot 1:
Application package version       2399
Status                            Active
Version                           1.40.0-26.006 (build date May 1 2014)
Sessions                          0
Slot 2
Application package version       0
Status                            Free
Version
Sessions                          0
The DPI Performance mode field displays whether the DPI performance mode is enabled or not. This field is displayed in the CLI command output only if the performance mode is enabled.
If you want to set DPI to default accuracy mode and disable the performance mode, delete the configuration statement that specifies enabling of the performance mode:
To disable the performance mode:
Delete the performance mode.
[edit]
user@host# delete services application-identification enable-performance-mode
Commit the configuration.
[edit]
user@host# commit
See Also
Application Tracking on NFX Devices
Application tracking (AppTrack) is a logging and reporting tool that can be used to share information for application visibility. AppTrack sends log messages through syslog providing application activity update messages. For more information, see the following topics:
- Understanding AppTrack
- Example: Configuring AppTrack
- Configuring AppTrack When SSL Proxy Is Enabled
- Disabling AppTrack
Understanding AppTrack
AppTrack, an application tracking tool, provides statistics for analyzing bandwidth usage of your network. When enabled, AppTrack collects byte, packet, and duration statistics for application flows in the specified zone. By default, when each session closes, AppTrack generates a message that provides the byte and packet counts and duration of the session, and sends it to the host device. Juniper Secure Analytics (formally known as STRM) retrieves the data and provides flow-based application visibility.
AppTrack messages are similar to session logs and use syslog or structured syslog formats. The message also includes an application field for the session. If AppTrack identifies a custom-defined application and returns an appropriate name, the custom application name is included in the log message. (If the application identification process fails or has not yet completed when an update message is triggered, the message specifies none in the application field.)
AppTrack supports both IPv4 and IPv6 addressing. Related messages display addresses in the appropriate IPv4 or IPv6 format.
User identity details such as user name and user role have been added to the AppTrack session create, session close, and volume update logs. These fields will contain the user name and role associated with the policy match. The logging of user name and roles is enabled only for security policies that provide UAC enforcement. For security policies without UAC enforcement, the user name and user role fields are displayed as N/A. The user name is displayed as unauthenticated user and user role is displayed as N/A, if the device cannot retrieve information for that session because there is no authentication table entry for that session or because logging of this information is disabled. The user role field in the log contains the list of all the roles performed by the user if match criteria is specific, authenticated user, or any, and the user name field in the log contains the correct user name. The user role field in the log will contain N/A if the match criteria and the user name field in the log contain unauthenticated user or unknown user.
If you enable AppTrack for a zone and specify a session-update-interval time, whenever a packet is received, AppTrack checks whether the time since the start of the session or since the last update is greater than the update interval. If so, AppTrack updates the counts and sends an update message to the host. If a short-lived session starts and ends within the update interval, AppTrack generates a message only at session close.
When you want the initial update message to be sent earlier than the specified update interval, use the first-update-interval. The first-update-interval lets you enter a shorter interval for the first update only. Alternatively, you can generate the initial update message at session start by using the first-update option.
The close message updates the statistics for the last time and provides an explanation for the session closure. The following codes are used:
TCP RST—RST received from either end.
TCP FIN—FIN received from either end.
Response received—Response received for a packet request (such as
icmp req-reply).
ICMP error—ICMP error received (such as dest unreachable).
Aged out—Session aged out.
ALG—ALG closed the session.
IDP—IDP closed the session.
Parent closed—Parent session closed.
CLI—Session cleared by a CLI statement.
Policy delete—Policy marked for deletion.
Benefits of Application Tracking
Provides visibility into the types of applications traversing through a device.
Enables you to gain insight into permitted applications and the risk they might pose.
Assists in managing bandwidth, reports active users and applications.
Application Tracking Log Messages Fields
The AppTrack session create, session close, and volume update logs include a new field called destination interface. You can use the destination interface field to see which egress interface is selected for the session when a advanced policy-based routing (APBR) is applied to that session and AppTrack is enabled and configured within any logical system.
AppTrack log for route update includes APBR profile, rule, and routing instance details. When APBR is applied to a session, the new log is generated and the AppTrack session counter is updated to indicate the number of times a new route update log is generated. The AppTrack session close log is also updated to include APBR profile, rule, and routing instance details.
AppTrack session create, session close, and volume update logs include the new fields category and subcategory. These fields provide general information about the application attributes. For example, the category field specifies the technology of the application (web, infrastructure) and subcategory field specifies the subcategory of the application (for example, social networking, news, and advertisements).
Because category and subcategory are not applicable for a custom application, the AppTrack log messages present the category as custom application and the subcategory as N/A.
For unknown applications, both category and subcategories are logged as N/A.
Examples of the log messages in structured syslog format:
APPTRACK_SESSION_CREATE user@host.1.1.1.2.129 source-address="4.0.0.1" source-port="48873" destination-address="5.0.0.1" destination-port="80" service-name="junos-http" application="UNKNOWN" nested-application="UNKNOWN" nat-source-address="4.0.0.1" nat-source-port="48873" nat-destination-address="5.0.0.1" nat-destination-port="80" src-nat-rule-name="N/A" dst-nat-rule-name="N/A" protocol-id="6" policy-name="permit-all" source-zone-name="trust" destination-zone-name="untrust" session-id-32="32" username="user1" roles="DEPT1" encrypted="UNKNOWN" destination-interface-name=”ge-0/0/0” category=”N/A” sub-category=”N/A”]
APPTRACK_SESSION_CLOSE [junos@2636.1.1.1.2.129 reason="TCP CLIENT RST" source-address="4.0.0.1" source-port="48873" destination-address="5.0.0.1" destination-port="80" service-name="junos-http" application="HTTP" nested-application="UNKNOWN" nat-source-address="4.0.0.1" nat-source-port="48873" nat-destination-address="5.0.0.1" nat-destination-port="80" src-nat-rule-name="N/A" dst-nat-rule-name="N/A" protocol-id="6" policy-name="permit-all" source-zone-name="trust" destination-zone-name="untrust" session-id-32="32" packets-from-client="5" bytes-from-client="392" packets-from-server="3" bytes-from-server="646" elapsed-time="3" username="user1" roles="DEPT1" encrypted="No" routing-instance=“default” destination-interface-name=”st0.0” category=” Web” sub-category=”N/A”]
APPTRACK_SESSION_VOL_UPDATE [user@host.1.1.1.2.129 source-address="4.0.0.1" source-port="33040" destination-address="5.0.0.1" destination-port="80" service-name="junos-http" application="HTTP" nested-application="FACEBOOK-SOCIALRSS" nat-source-address="4.0.0.1" nat-source-port="33040" nat-destination-address="5.0.0.1" nat-destination-port="80" src-nat-rule-name="N/A" dst-nat-rule-name="N/A" protocol-id="6" policy-name="permit-all" source-zone-name="trust" destination-zone-name="untrust" session-id-32="28" packets-from-client="371" bytes-from-client="19592" packets-from-server="584" bytes-from-server="686432" elapsed-time="60" username="user1" roles="DEPT1" encrypted="No" destination-interface-name=”st0.0” category=” Web” sub-category=”Social-Networking”]
APPTRACK_SESSION_ROUTE_UPDATE [user@host.1.1.1.2.129 source-address="4.0.0.1" source-port="33040" destination-address="5.0.0.1" destination-port="80" service-name="junos-http" application="HTTP" nested-application="FACEBOOK-SOCIALRSS" nat-source-address="4.0.0.1" nat-source-port="33040" nat-destination-address="5.0.0.1" nat-destination-port="80" src-nat-rule-name="N/A" dst-nat-rule-name="N/A" protocol-id="6" policy-name="permit-all" source-zone-name="trust" destination-zone-name="untrust" session-id-32="28" username="user1" roles="DEPT1" encrypted="No" profile-name=”pf1” rule-name=”facebook1” routing-instance=”instance1” destination-interface-name=”st0.0” category=”Web” sub-category=”Social-Networking”]
See Also
Example: Configuring AppTrack
This example shows how to configure the AppTrack tracking tool so you can analyze the bandwidth usage of your network.
- Requirements
- Overview
- Configuration
- CLI Quick Configuration
- Step-by-Step Procedure
- Results
- Verification
Requirements
Before you configure AppTrack, ensure that you have downloaded the application signature package, installed it, and verified that the application identification configuration is working properly. See Downloading and Installing the Junos OS Application Signature Package Manually or Downloading and Installing the Junos OS Application Signature Package As Part of the IDP Security Package. Use the show services application-identification status command to verify the status.
Overview
Application identification is enabled by default and is automatically turned on when you configure the AppTrack, AppFW, or IDP service. The Juniper Secure Analytics (JSA) retrieves the data and provides flow-based application visibility. STRM includes the support for AppTrack Reporting and includes several predefined search templates and reports.
Configuration
This example shows how to enable application tracking for the security zone named trust. The first log message is to be generated when the session starts, and update messages should be sent every 4 minutes after that. A final message should be sent at session end.
The example also shows how to add the remote syslog device configuration to receive AppTrack log messages in sd-syslog format. The source IP address that is used when exporting security logs is 192.0.2.1, and the security logs are sent to the host located at address 192.0.2.2.
We recommend using CLI for configuration of AppSecure features.
CLI Quick Configuration
To quickly configure this example, copy the following commands, paste them into a text file, remove any line breaks, change any details necessary to match your network configuration, copy and paste the commands into the CLI at the [edit] hierarchy level, and then enter commit from configuration mode.
Changing the session-update-interval and the first-update-interval is not necessary in most situations. The commands are included in this example to demonstrate their use.
user@host# set security log mode stream
user@host# set security log format sd-syslog
user@host# set security log source-address 192.0.2.1
user@host# set security log stream app-track-logs host 192.0.2.2
user@host#set security zones security-zone trust application-tracking
user@host#set security application-tracking session-update-interval 4
user@host#set security application-tracking first-update
If the syslog configuration does not specify a destination port, the default destination port will be the syslog port. If you specify a destination port in the syslog configuration, then that port will be used instead.
Step-by-Step Procedure
The following example requires you to navigate various levels in the configuration hierarchy. For instructions on how to do that, see CLI User Guide.
To configure AppTrack:
Add the remote syslog device configuration to receive Apptrack messages in sd-syslog format.
[edit]
user@host# set security log mode stream
user@host# set security log format sd-syslog
user@host# set security log source-address 192.0.2.1
user@host# set security log stream app-track-logs host 192.0.2.2
Enable AppTrack for the security zone trust.
[edit]
user@host# set security zones security-zone trust application-tracking
(Optional) For this example, generate update messages every 4 minutes.
[edit]
user@host# set security application-tracking session-update-interval 4
The default interval between messages is 5 minutes. If a session starts and ends within this update interval, AppTrack generates one message at session close. However, if the session is long-lived, an update message is sent every 5 minutes. The session-update-interval minutes is configurable as shown in this step.
(Optional) For this example, generate the first message when the session starts.
[edit]
user@host# set security application-tracking first-update
By default, the first message is generated after the first session update interval elapses. To generate the first message at a different time than this, use the first-update option (generate the first message at session start) or the first-update-interval minutes option (generate the first message after the specified minutes). For example, enter the following command to generate the first message one minute after session start.
[edit]
user@host# set security application-tracking first-update-interval 1
Note:The first-update option and the first-update-interval minutes option are mutually exclusive. If you specify both, the first-update-interval value is ignored.
Once the first message has been generated, an update message is generated each time the session update interval is reached.
Results
From configuration mode, confirm your configuration by entering the show security and show security zones commands. If the output does not display the intended configuration, repeat the configuration instructions in this example to correct it.
For brevity, this show command output includes only the configuration that is relevant to this example. Any other configuration on the system has been replaced with ellipses (...).
[edit]
user@host# show security
...
application-tracking {
first-update;
session-update-interval 4;
}
log {
mode stream;
format sd-syslog;
source-address192.0.2.2;
stream app-track-logs {
host {
192.0.2.1;
}
}
}
...[edit]
user@host# show security zones
...
security-zone trust {
...
application-tracking;
}If you are done configuring the device, enter commit from configuration mode.
Verification
Use the JSA product on the remote logging device to view the AppTrack log messages.
To confirm that the configuration is working properly, you can also perform these tasks on the device:
- Reviewing AppTrack Statistics
- Verifying AppTrack Counter Values
- Verifying Security Flow Session Statistics
- Verifying Application System Cache Statistics
- Verifying the Status of Application Identification Counter Values
Reviewing AppTrack Statistics
Purpose
Review AppTrack statistics to view characteristics of the traffic being tracked.
Action
From operational mode, enter the show services application-identification statistics applications command.
user@host> show services application-identification statistics applications
Last Reset: 2012-02-14 21:23:45 UTC

Application    Sessions              Bytes    Encrypted
HTTP                  1               2291          Yes
HTTP                  1                942           No
SSL                   1               2291          Yes
unknown               1                100           No
unknown               1                100          Yes
For more information on the show services application-identification statistics applications command, see show services application-identification statistics applications.
Verifying AppTrack Counter Values
Purpose
View the AppTrack counters periodically to monitor logging activity.
Action
From operational mode, enter the show security application-tracking counters command.
user@host> show security application-tracking counters
AVT counters:              				Value
 Session create messages            1
 Session close messages             1
 Session volume updates             0
 Failed messages                    0
Verifying Security Flow Session Statistics
Purpose
Compare byte and packet counts in logged messages with the session statistics from the show security flow session command output.
Action
From operational mode, enter the show security flow session command.
user@host> show security flow session
Flow Sessions on FPC6 PIC0:

Session ID: 120000044, Policy name: policy-in-out/4, Timeout: 1796, Valid
In: 192.0.2.1/24 --> 198.51.100.0/21;tcp, If: ge-0/0/0.0, Pkts: 22, Bytes: 1032
Out: 198.51.100.0/24 --> 192.0.2.1//39075;tcp, If: ge-0/0/1.0, Pkts: 24, Bytes: 1442

Valid sessions: 1
Pending sessions: 0
Invalidated sessions: 0
Sessions in other states: 0
Total sessions: 1
Byte and packet totals in the session statistics should approximate the counts logged by AppTrack but might not be exactly the same. AppTrack counts only incoming bytes and packets. System-generated packets are not included in the total, and dropped packets are not deducted.
Verifying Application System Cache Statistics
Purpose
Compare cache statistics such as IP address, port, protocol, and service for an application from the show services application-identification application-system-cache command output.
Action
From operational mode, enter the show services application-identification application-system-cache command.
Verifying the Status of Application Identification Counter Values
Purpose
Compare session statistics for application identification counter values from the show services application-identification counter command output.
Action
From operational mode, enter the show services application-identification counter command.
See Also
Configuring AppTrack When SSL Proxy Is Enabled
This configuration procedure describes how AppTrack supports AppID functionality when SSL proxy is enabled.
Requirements
Before you begin:
-
Create zones. See Example: Creating Security Zones.
-
Create an SSL proxy profile that enables SSL proxy by means of a policy. See Configuring SSL Forward Proxy.
Overview
You can configure AppTrack either in the to or from zones. This example shows how to configure AppTrack in a to zone in a policy rule when SSL proxy is enabled.
Configuration
CLI Quick Configuration
To quickly configure this example, copy the following commands, paste them into a text file, remove any line breaks, change any details necessary to match your network configuration, copy and paste the commands into the CLI at the [edit] hierarchy level, and then enter commit from configuration mode.
set security zones security-zone Z_1 application-tracking
set security policies from-zone Z_1 to-zone Z_2 policy policy1 match source-address any
set security policies from-zone Z_1 to-zone Z_2 policy policy1 match destination-address any
set security policies from-zone Z_1 to-zone Z_2 policy policy1 then permit application-services ssl-proxy profile-name ssl-profile-1
set security policies from-zone Z_1 to-zone Z_2 policy policy1 then permit
Step-by-Step Procedure
The following example requires you to navigate various levels in the configuration hierarchy. For instructions on how to do that, see Using the CLI Editor in Configuration Mode.
In this example, you configure application tracking and permit application services in an SSL proxy profile configuration.
Configure application tracking in a to-zone (you can also configure using a from-zone).
[edit security policies]
user@host# set security zones security-zone Z_1 application-tracking
Configure SSL proxy profile.
[edit security policies from-zone Z_1 to-zone Z_2 policy policy1]
set match source-address any
set match destination-address any
set match application junos-https
set then permit application-services ssl-proxy profile-name ssl-profile-1
set then permit
Results
From configuration mode, confirm your configuration by entering the show security policies command. If the output does not display the intended configuration, repeat the configuration instructions in this example to correct it.
from-zone Z_1 to-zone Z_2 {
    policy policy1 {
        match {
            source-address any;
            destination-address any;
        }
        then {
            permit {
                application-services {
                    ssl-proxy {
                        profile-name ssl-profile-1;
                    }
                }
            }
        }
    }
}Verify that the configuration is working properly. Verification in AppTrack works similarly to verification in AppFW. See the verification section of Example: Configuring Application Firewall When SSL Proxy Is Enabled.
See Also
Disabling AppTrack
Application tracking is enabled by default. You can disable application tracking without deleting the zone configuration.
To disable application tracking:
user@host# set security application-tracking disable
If application tracking has been previously disabled and you want to reenable it, delete the configuration statement that specifies disabling of application tracking:
user@host# delete security application-tracking disable
If you are finished configuring the device, commit the configuration.
To verify the configuration, enter the show security application-tracking command.
Application Firewall on NFX Devices
Application Firewall (AppFW) refers to the ability to take the results from the App ID engine and leverage them to make an informed decision to permit, deny/ reject, or redirect the traffic. For more information, see the following topics:
- Application Firewall Overview
- Example: Configuring Application Firewall Rule Sets Within a Security Policy
- Example: Configuring an Application Group for Application Firewall
Application Firewall Overview
Traditionally, applications like HTTP, SMTP, and DNS use well-known standard ports and are easily controlled by a stateful firewall. However, it is possible to run these applications on any port as long as the client and server are using the same protocol as the well-known ports.
Evasive applications could remain undetected with a standard firewall that functions at Layer 3 or Layer 4 by transmitting other protocols over these well-known ports that are usually open by a firewall. AppFW enforces protocol and policy control at Layer 7. It inspects the actual content of the payload and ensures that it conforms to the policy, rather than identifying the application based on Layer 3 and Layer 4 information.
Additionally, with the growing popularity of Web applications and the shift from traditional full client-based applications to the Web, more and more traffic is being transmitted over HTTP. An application firewall identifies not only HTTP but also any application running on top of it, letting you properly enforce policies. For example, an application firewall rule could block HTTP traffic from Facebook but allow Web access to HTTP traffic from MS Outlook.
A security administrator implements an application firewall by performing the following tasks:
-
Define one or more application firewall rule sets.
-
Create rules for each rule set that permit, reject, or deny traffic based on the application ID.
-
Configure a security policy to invoke the application firewall service and specify the rule set to be applied to permitted traffic.
This topic includes the following sections:
- Benefit of Application Firewall
- Understanding Application Firewall Rule Sets
- Configuring an Application Firewall Within a Security Policy
- Application Group Support for Application Firewall
- Redirecting Users
- Session Logging for Application Firewalls
Benefit of Application Firewall
Controls access to high-risk applications based on user-defined policies.
Understanding Application Firewall Rule Sets
An application firewall permits, rejects, or denies traffic based on the application of the traffic. The firewall consists of one or more rule sets with rules that specify match criteria, including dynamic applications, and the action to be taken for matching traffic.
An application firewall rule set consists of:
-
The name of the rule set
-
One or more rules
-
A single default rule
Each rule defines dynamic applications to permit, reject, or deny. Each rule consists of:
-
The name of the rule
-
A list of dynamic applications to be used as match criteria
-
The action to take for any traffic that matches one of the specified applications
-
Reject—Notify the client, drop the traffic, close the session, and log the event.
-
Deny—Drop the traffic, close the session, and log the event.
-
Permit—Permit the traffic.
-
The default rule defines the action to be taken for any traffic that does not match one of the rules. An application firewall rule set must contain a default rule.
There is no limit to the number of dynamic applications in a rule or to the number of rules in a rule set. However, there is a limit to the overall number of rule sets and rules.
The junos:UNKNOWN keyword is reserved for unknown dynamic applications. In the following cases, the application ID is set to junos:UNKNOWN:
-
The traffic does not match an application signature in the database.
-
The system encounters an error when identifying the application.
-
The session fails over to another device.
Traffic with an application ID of junos:UNKNOWN matches a rule with a dynamic application of junos:UNKNOWN. If there is no rule defined for junos:UNKNOWN, the default rule is applied.
Configuring an Application Firewall Within a Security Policy
An application firewall is invoked using the then permit statement of the security policy.
Any traffic denied or rejected by the security policy based on Layer 3 or Layer 4 criteria is dropped immediately. Traffic permitted by the security policy is further assessed by the application firewall at Layer 7 based on its application ID.
The following sample policy, outbound-traffic, permits matching HTTP traffic, and invokes application services and an application firewall. The rule set, unknown-traffic, permits, denies, or rejects, traffic based on its match criteria.
[edit security policies from-zone trust to-zone untrust outbound-traffic]
user@host# set match source-address 192.0.2.1
user@host# set match destination-address 198.51.100.1
user@host# set match application junos-http
user@host# set then permit application-services application-firewall rule-set unknown-traffic
Traffic is processed in the following sequence:
Match the zone pair specified in the policy.
When specified, match the source and destination IP addresses, ports, and application type.
Apply the security policy action to matching traffic.
Reject—Notify the client, drop the traffic, and log the event.
Deny—Drop the traffic, and log the event.
Permit—Open a session, log the event, and apply services as specified.
Invoke application services to retrieve the application ID for the traffic.
Apply the specified application firewall rule set.
All IP fragmented packets received on the device must be reassembled before forwarding.
Application Group Support for Application Firewall
Application group support associates related applications under a single name for simplified, consistent reuse when using any application services. As the predefined signature database changes, the content of a predefined application group can be modified to include new signatures without affecting existing firewall rules. When you define application firewall rules, you can specify dynamic application groups as match criteria.
An application group can contain applications and groups simultaneously. It is possible to assign one application to multiple groups. There is no limit to the number of dynamic application groups contained in one rule.
For information on creating or listing application groups, see Customizing Application Groups for Junos OS Application Identification.
When ALG is enabled on the device, application identification includes the ALG result to identify the application of the control sessions. Application firewall permits ALG data sessions whenever control sessions are permitted. If the control session is denied, there will be no data sessions. When ALG is disabled, application identification relies on its signatures to identify the application of the control and data sessions. If a signature match is not found, the application is considered unknown. Application firewall handles applications based on the application identification result.
Redirecting Users
Although drop and reject actions are logged, application firewall does not notify clients when either action is taken. Clients are not aware that the webpage is not available and might keep trying to access the page. To provide an explanation for the action or to redirect the client to an informative webpage, use the block-message option with the reject or deny action in an application firewall rule.
...
then reject block-message
When traffic is rejected by the application firewall rule, a splash screen with the following default message is displayed to the user:
user-name, Application Firewall has blocked your request to application application-name at dst-ip:dst-port accessed from src-ip:src-port.
To help the user fully understand which request has been rejected or denied, the default message includes traffic-specific details, such as the username, application, and address information.
You can customize the redirect action by including additional text on the splash screen or by specifying a URL to which the user is redirected. To customize the block message, define the type and content in a block message profile defined in the rule set:
[edit security application-firewall profile deny-profile-1]
set block-message type custom-redirect-url content http://abc.company.com/information
The block message profile is identified for the rule set, and applied to one or more of the rules using the block-message option.
[edit security application-firewall rule-sets application-firewall-3]
set profile deny-profile-1
set rule redirect-on-deny
set match dynamic-application [junos:KAZAA junos:EDONKEY junos:YMSG]
set then deny block-message
In this example, any traffic matching one of the specified dynamic applications is denied, and the block message defined for rule set, deny-profile-1, is applied. Based on the profile for deny-profile-1, the user is redirected to the URL http://abc.company.com/information for further details.
Session Logging for Application Firewalls
With security policies, the permit action of the matched policy rule creates a session and logs a session create message. A reject or deny action logs a reject or deny message, but does not create a session.
When an application firewall is implemented, the permit action of the security policy creates a session before the application firewall rules are applied. If the dynamic application have been retrieved from the cache, this information is added to the session create message. If the application is in the process of being identified, the dynamic application fields specify UNKNOWN.
If traffic is rejected or denied by the application firewall, application firewall also closes the session. The reject or deny message actions are logged with the reason field containing one of the following phrases:
-
appfw deny or appfw deny redirect
-
appfw reject or appfw reject redirect
-
policy deny
-
policy reject
See Also
Example: Configuring Application Firewall Rule Sets Within a Security Policy
This example shows how to configure application firewall rule sets within the security policy.
Requirements
Create zones. See Example: Creating Security Zones.
Configure an address book with addresses for the policy. See Example: Configuring Address Books and Address Sets.
Overview
In Junos OS, the security policies provide firewall security functionality by enforcing rules for the traffic so that traffic passing through the device is permitted or denied based on the action defined in the rules. The application firewall support in the policies provides additional security control for dynamic applications.
The application firewall is defined by a collection of rule sets. These rule sets can be defined independently and shared across network security policies. A rule set defines the rules that match the application ID detected, based on the application signature.
This configuration example shows how to:
-
Permit or deny selected traffic from the untrust zone to the trust zone, based on the application firewall rule sets defined with the rules matching the dynamic applications.
We recommend using CLI for configuration of AppSecure features.
Configuration
CLI Quick Configuration
To quickly configure this example, copy the following commands, paste them into a text file, remove any line breaks, change any details necessary to match your network configuration, copy and paste the commands into the CLI at the [edit] hierarchy level, and then enter commit from configuration mode.
set security policies from-zone untrust to-zone trust policy policy1 match source-address 198.51.100.1
set security policies from-zone untrust to-zone trust policy policy1 match destination-address 192.0.2.1
set security policies from-zone untrust to-zone trust policy policy1 match application junos-http
set security policies from-zone untrust to-zone trust policy policy1 then permit application-services application-firewall rule-set rs1
set security policies from-zone untrust to-zone trust policy policy2 match source-address 198.51.100.1
set security policies from-zone untrust to-zone trust policy policy2 match destination-address 192.0.2.1
set security policies from-zone untrust to-zone trust policy policy2 match application any
set security policies from-zone untrust to-zone trust policy policy2 then permit application-services application-firewall rule-set rs2
set security application-firewall rule-sets rs1 rule r1 match dynamic-application [junos:KAZAA junos:EDONKEY junos:YMSG]
set security application-firewall rule-sets rs1 rule r1 then deny
set security application-firewall rule-sets rs1 default-rule permit
set security application-firewall rule-sets rs2 rule r1 match dynamic-application [junos:FACEBOOK-ACCESS junos:GOOGLETALK junos:MEEBOME junos:UNKNOWN]
set security application-firewall rule-sets rs2 rule r1 then permit
set security application-firewall rule-sets rs2 default-rule deny
Step-by-Step Procedure
The following example requires you to navigate various levels in the configuration hierarchy. For instructions on how to do that, see CLI User Guide.
To configure two security policies with application firewall rule sets that permit or deny traffic from different dynamic applications:
Configure a policy to process the traffic that goes to the HTTP static ports with the application firewall rule set rs1.
[edit security policies from-zone untrust to-zone trust policy policy1]
user@host# set match source-address 198.51.100.1
user@host# set match destination-address 192.0.2.1
user@host# set match application junos-http
user@host# set then permit application-services application-firewall rule-set rs1
Configure another policy to process any traffic that does not go to the HTTP static ports with the application firewall rule set rs2.
[edit security policies from-zone untrust to-zone trust policy policy2]
user@host# set match source-address 198.51.100.1
user@host# set match destination-address 192.0.2.1
user@host# set match application any
user@host# set then permit application-services application-firewall rule-set rs2
Define the application firewall rule set rs1 to deny traffic from selected dynamic applications.
[edit security application-firewall rule-sets rs1]
user@host# set rule r1 match dynamic-application [junos:KAZAA junos:EDONKEY junos:YMSG]
user@host# set rule r1 then deny
user@host# set default-rule permit
Define the application firewall rule set rs2 to permit traffic from selected dynamic applications.
[edit security application-firewall rule-sets rs2]
user@host# set rule r1 match dynamic-application [junos:FACEBOOK-ACCESS junos:GOOGLETALK junos:MEEBOME junos:UNKNOWN]
user@host# set rule r1 then permit
user@host# set default-rule deny
Results
From configuration mode, confirm your configuration by entering the show security policies and show security application-firewall commands. If the output does not display the intended configuration, repeat the configuration instructions in this example to correct it.
[edit]
user@host# show security policies
from-zone untrust to-zone trust {
    policy 1 {
        match {
            source-address 198.51.100.1;
            destination-address 192.0.2.1;
            application junos-http;
        }
        then {
            permit {
                application-services {
                    application-firewall {
                        rule-set rs1;
                    }
                }
            }
        }
    }
    policy 2 {
        match {
            source-address 198.51.100.1;
            destination-address 192.0.2.1;
            application any;
            }
        then {
            permit {
                application-services {
                    application-firewall {
                        rule-set rs2;
                    }
                }
            }
        }
    }
}
user@host# show security application-firewall
rule-sets rs1 {
    rule r1 {
        match {
            dynamic-application [junos:KAZAA junos:EDONKEY junos:YMSG];
        }
        then {
            deny;
        }
    }
    default-rule {
        permit;
    }
}
rule-sets rs2 {
    rule r1 {
        match {
            dynamic-application [junos:FACEBOOK-ACCESS junos:GOOGLETALK junos:MEEBOME junos:UNKNOWN];
        }
        then {
            permit;
        }
    }
    default-rule {
        deny;
    }
}
If you are done configuring the device, enter commit from configuration mode.
Verification
To confirm that the configuration is working properly, perform these tasks:
Verifying Application Firewall Configuration
Purpose
Verify information about application firewall support enabled under the security policy.
Action
To verify the security policy configuration enabled with application firewall, enter the show security policies and show security policies detail commands. To verify all the application firewall rule sets configured on the device, enter the show security application-firewall rule-set all command.
Meaning
The output displays information about application firewall enabled policies configured on the system. Verify the following information.
Rule set
Rules
Match criteria
See Also
Example: Configuring an Application Group for Application Firewall
With application identification, multiple applications can be configured in a dynamic application groups for consistent reuse. AppFW rules permit and deny traffic by specifying application names, dynamic application group names, or both. By using predefined application groups, AppFW rules require no updating when new applications are added to common groups.
The application group is managed by the application identification module.
This example shows how to configure application groups within the application firewall rule set.
Overview
The following example configures network policies to control outbound traffic from the trust zone to the untrust zone. All traffic permitted by the policy is processed further with the specified application firewall. The application firewall denies outbound traffic from unknown applications. Outbound Google Talk traffic is allowed, but all other known social networking traffic is denied. All other traffic is permitted.
The junos:GOOGLETALK application is included in the predefined group junos:social-networking. To allow junos:GOOGLETALK traffic and deny the rest of the group, the rule permitting junos:GOOGLETALK traffic must come before the rule denying traffic from the rest of the applications in the group.
This configuration example shows how to:
-
Configure dynamic application groups in an application firewall.
Configuration
CLI Quick Configuration
To quickly configure this example, copy the following commands, paste them into a text file, remove any line breaks, change any details necessary to match your network configuration, copy and paste the commands into the CLI at the [edit] hierarchy level, and then enter commit from configuration mode.
 set security application-firewall rule-sets social-network rule google-rule match dynamic-application junos:GOOGLETALK
set security application-firewall rule-sets social-network rule google-rule then permit
set security application-firewall rule-sets social-network rule denied-sites match dynamic-application-groups junos:social-networking
set security application-firewall rule-sets social-network rule denied-sites match dynamic-application junos:UNKNOWN
set security application-firewall rule-sets social-network rule denied-sites then deny
set security application-firewall rule-sets social-network default-rule permit
set security policies from-zone trust to-zone untrust policy outbound-traffic
set security policies from-zone trust to-zone untrust policy outbound-traffic match source-address any
set security policies from-zone trust to-zone untrust policy outbound-traffic match destination-address any
set security policies from-zone trust to-zone untrust policy outbound-traffic match application junos:HTTP
set security policies from-zone trust to-zone untrust policy outbound-traffic then permit application-services application-firewall rule-set social-network
Step-by-Step Procedure
The following example requires you to navigate various levels in the configuration hierarchy. For instructions on how to do that, see Using the CLI Editor in Configuration Mode.
To configure application firewall rule-sets and security policies for outbound traffic:
Create the rule-set social-network.
[edit]
user@host# set security application-firewall rule-sets social-network
Define a rule to permit Google-Talk traffic.
[edit security application-firewall rule-sets social-network]
user@host# set rule google-rule match dynamic-application junos:GOOGLETALK
user@host# set rule google-rule then permit
Define a second rule that denies all other social-networking traffic and traffic from an unknown application.
[edit security application-firewall rule-sets social-network]
user@host# set rule denied-sites match dynamic-application-groups junos:social-networking
user@host# set rule denied-sites match dynamic-application junos:UNKNOWN
user@host# set rule denied-sites then deny
Note that rule sequence is important. If the rules google-rule and denied-sites are reversed, GOOGLETALK traffic would never be permitted. The denied-sites rule would shadow google-rule.
Define the default-rule that permits all other traffic.
[edit security application-firewall rule-sets social-network]
user@host# user@host# set default-rule permit
Configure the outbound-traffic policy to apply the social-network rule-set to all outbound traffic.
[edit security policies from-zone trust to-zone untrust policy outbound-traffic]
user@host# set match source-address any
user@host# set match destination-address any
user@host# set match application junos:HTTP
user@host# set then permit application-services application-firewall rule-set social-network
Results
From configuration mode, confirm your configuration by entering the show security application-firewall and show security policies commands. If the output does not display the intended configuration, repeat the instructions in this example to correct the configuration.
[edit]
user@host# show security application-firewall
...
rule-sets social-network {
    rule google-rule {
        match {
            dynamic-application junos:GOOGLETALK;
        }
    }
    then {
        permit ;
    }
    rule denied-sites {
        match {
            dynamic-application-groups junos:social-networking
            dynamic-application junos:UNKNOWN;
        }
        then {
            deny ;
        }
    }
    default-rule {
        permit;
    }
}
...[edit]
user@host# show security policies
from-zone untrust to-zone trust {
...
policy outbound-traffic {
match {
source-address any;
destination-address any;
application junos-http;
}
then {
permit {
application-services {
application-firewall {
rule-set social-network
}
}
}
}
}
...
}If you are done configuring the device, enter commit from configuration mode.
Verification
Verifying Application Firewall Configuration
Purpose
Verify information about application grouping support under the application firewall policy.
Action
To verify the application firewall policy configuration enabled with application grouping, from the operational mode, enter the show security policies and show security policies detail commands.
To verify all the application firewall rule sets configured on the device, from the operational mode, enter the show security application-firewall rule-set all command.
To verify the list of applications defined within the application group, from the operational mode, enter the show services application-identification application-group application-group-name command.
See Also
Application Quality of Experience on NFX Devices
Application Quality of Experience (AppQoE)
- Introduction to AppQoE
- Benefits of AppQoE
- Supported Use Cases
- Limitations
- Understanding AppQoE Terminology
- How AppQoE Works?
- Identifying Applications or Application Groups
- Specifying Path for Applications or Application Groups
- Application Traffic Path Selection
- How AppQoE Measures Application Performance
- Application Performance Measurement by Using Active and Passive Probes
- Switching Application Traffic to An Alternate Path
Introduction to AppQoE
The relentless growth of cloud computing, mobility, and Web-based applications, requires that the network identify and control the traffic at the application level, and handle each application type separately to provide quality of experience (QoE) for users. To ensure application-specific QoE (AppQoE), you need to effectively prioritize, segregate, and route application traffic without compromising performance or availability.
AppQoE utilizes (or employs) the capabilities of two application security services - application identification (AppID) and advanced policy-based routing (APBR). It uses AppID to identify specific applications in your network and advanced policy-based routing (APBR) to specify a path for certain traffic by associating SLA profiles to a routing instance on which the application traffic is sent as per APBR rules.
AppQoE monitors the performance of business- critical applications, and based on the score, selects the best possible link for that application traffic in order to meet performance requirements specified as in SLA (service-level agreement).
The presence of an SLA rule in the APBR configuration triggers the AppQoE functionality; If there are no SLA profiles available, the APBR functions without triggering AppQoE.
Benefits of AppQoE
Enables cost-effective QoE by providing real-time monitoring of application traffic to provide a consistent and predictable level of service.
Increases customer retention and satisfaction by providing a guaranteed SLA for the delivery of the certain traffic (such as video traffic). AppQoE ensures that the approved traffic receives the appropriate priority, and bandwidth required to ensure the best quality of experience to the user.
Supported Use Cases
AppQoE finds use in the following network scenarios, among others:
-
Networks with hub-and-spoke topology—In a hub-and-spoke configuration, the devices at the branch offices and remote offices connect directly to a specific device and do not form tunnels to other devices in the network. Communication between branch sites or remote offices is enabled through the configured VPN hubs.
-
Mesh networks—In a mesh configuration, a device at the branch office or remote site is configured to connect directly to any other device in the network that is also part of mesh.
Limitations
Implementation of AppQoE on Juniper devices has the following limitations:
-
All the different routes to the destination through different interfaces must have the same preference, weight, and metrics configured. All routes must be added as ECMP paths for the destination and must also be part of the same forwarding table.
-
AppQoE SLA service only between two devices endpoints (book-ended) are supported. End-to-end AppQoE SLA service is not supported.
-
AppQoE can be applied only if all interfaces are part of the same zone.
-
AppQoE cannot be applied for reverse traffic.
-
AppQoE does not influence in change in the destination for a session.
-
AppQoE does not support IPv6/UDP probe encapsulation, GRES, chassis cluster (ISSU, high-availability, dual CPE high availability, Z-mode high availability), and logical systems.
-
AppQoE is not supported in multihoming scenarios.
-
AppQoE does not support preferred path selection and transit virtual routing and forwarding (VRF) are not supported.
-
AppQoE does not support passive probing on IPv6 data packets.
-
An input firewall filter is required at the non-WAN interfaces to discard UDP packets with UDP destination port 36000.
Understanding AppQoE Terminology
This section includes some of the terminologies used in understanding about how AppQoE works.
-
SLA rule—An SLA rule includes all required information to measure SLA and to identify whether any SLA violation has occurred or not. It contains the complete probe profiles, period at which profile need to be sent, preferred SLA configuration and so on.
-
SLA options—By using SLA options, you can specify that applications be seamlessly diverted to the alternate path if the performance of the primary link is below acceptable levels as specified by the SLA.
-
SLA metrics profile — Defines the SLA metrics requirements parameters, which are used by AppQoE to evaluate the SLA of the link. The metric profile includes parameters such as jitter, jitter type, packet loss, round trip delay and so on.
-
SLA violations—To accomplish an SLA, AppQoE monitors the network for sources of failures or congestion. If the performance of a link is below acceptable levels as specified by the SLA, the situation is considered as an SLA violation and an alternate path is determined to select the best link that satisfies the SLA.
-
Active and passive probes—Active and passive probe measurements are used for an end-to-end analysis of the network. The data collected by active and passive probing is used for monitoring the network for sources of failures or congestion. If there is a violation detected for any application, the synthetic probe metrics are evaluated to determine the best link that satisfies the SLA.
-
Overlay path—an overlay path includes the overlay links that are used to send the application traffic. Application or application groups are assigned to a particular overlay link based on the SLA metrics of that overlay link.
-
Destination groups—A destination group is a group of multiple overlay paths terminating at a destination.
How AppQoE Works?
AppQoE utilizes AppID and APBR capabilities to identify specific applications/application groups and specify a path for certain traffic by associating SLA profiles to a routing instance on which the application traffic is sent as per APBR rules.
AppQoE monitors the performance of applications, and based on the score, selects the best possible link for that application traffic in order to meet performance requirements specified as in SLA (service-level agreement).
Identifying Applications or Application Groups
Following steps are involved in identifying applications or application groups:
Junos OS application identification identifies applications and once an application is identified, its information is saved in the application system cache (ASC).
APBR evaluates the packets based to determine if the session is candidate for application-based routing (advance policy-based routing). If this is first packet of the new session and traffic is not flagged for application-based routing, it undergoes normal processing (non-APBR route) to destination.
If the session needs application-based routing, APBR queries the ASC module to get the application attributes (IP address, destination port, protocol type, and service).
-
If the application in ASC is found, traffic is further processed for a matching rule in the APBR profile.
If a matching rule is found, the traffic is redirected to the specified routing instance for the route lookup.
AppQoE checks whether an SLA is enabled for a session. If the session is a candidate for an SLA measurement, AppQoE initiates active and passive probes for performance measurements.
If SLA is not enabled for the session in the APBR rule, the AppQoE ignores that session and the default behavior of APBR is applied to those sessions—that is, traffic is routed through the specified routing instance for the destination.
If a matching rule is not found, traffic traverses through a default route (non-APBR route) to the destination.
If the application in is not found in ASC, APBR requests for deep inspection of the flow. that is, application signature package is installed and application identification for the session is enabled, so that ASC can be populated for use by subsequent sessions for APBR processing (see step 2).
Specifying Path for Applications or Application Groups
The following steps summarize how AppQoE specifies a path for the application traffic according to the SLA rules.
APBR uses the application details to look for a matching rule in the APBR profile (application profile). Traffic matching the applications and application groups, are forwarded to the static route and the next-hop address as specified in the routing instance.
An SLA rule attached to the APBR profile specifies parameters, that are required to measure the SLA and to identify whether any SLA violation has occurred or not.
The applications traffic is assigned to a particular overlay link based on the SLA metrics of that overlay link measured using active probing.
The SLA violation is determined through passive probing of live application/application group traffic. The best path/overlay link for the application/application group is determined through the path selection algorithm.
Application Traffic Path Selection
The following steps take place for routing data traffic from source to destination, specifically, to select the best path,
-
For the first data packet of a flow (first path), if the application is already known (from the ASC lookup), then the best path for the application is searched in the database. If the application is not known or is new (from ASC lookup), then a random path or the default path is chosen. This path continues for the entire session. Later, after the application is detected by the DPI, the database is updated with the best path for the application.
-
For the remaining data packet of a flow (fast path), if the application is not known initially, then the particular session continues on the same path. If the application is known initially, then AppQoE selects the best path for the application traffic.
When a new application is detected, the path selection mechanism attempts to find a path that satisfies all the SLA metrics. If no such path exists, then the next best path (based on number of metrics satisfied) is used. If there are more than one path that satisfies the metrics, a random path among the available paths is selected. The SLA violation is detected when any one of the metric is violated or none of the metrics meets the requirement, based on the profile configuration.
How AppQoE Measures Application Performance
Application performance is determined by the following indicators:
-
Latency—The amount of time physically required for media to travel depending on media length and distance that need to be covered
-
RTT— A round-trip time required to travel from source to destination and vice versa.
-
Packet loss—Packet loss reflects the number of packets lost per 100 of packets sent by a host.
-
Jitter—Jitter is the difference in the latency from packet to packet. Ingress jitter, egress jitter, and two-way jitter can be specified for evaluating the performance of the link.
AppQoE monitors RTT, jitter, and packet loss on each link, and based on the score, seamlessly diverts applications to the alternate path if performance of the primary link is below acceptable levels as specified by SLA. Measurement and monitoring of application performance is done using active and passive probes to detect SLA violations and to select an alternate path for that particular application.
AppQoE collects real-time data by continuously monitoring application traffic and identifying network or device issues by:
-
Monitoring the performance on all configured overlay links.
-
Using passive probes (inline with the application datapath) and active probes (synthetic probes for specific application) to monitor the traffic performance for application or application group.
-
Sending all collected performance metrics or metadata for analysis to a log collector.
-
Comparing specified application against a specific performance metric and changing the path for the application traffic dynamically in case of an SLA violation.
-
Supporting flexible SLA metric configuration for a given application or application group.
AppQoE measures the application SLA across multiple WAN links, and maps the application traffic to a path among the available links, that is, to the path that best serves the SLA requirement.
Application Performance Measurement by Using Active and Passive Probes
Active and passive probe measurements are the two approaches used for end-to-end analysis of the network.
-
Active probe—Active probes measure the service quality of the application to provide an end-to-end measurement of the network performance.
In active probing, custom packets are sent between spoke and hub points on all the multiple routes and the RTT, latency, jitter, and packet-loss are measured between the installed probe points. The active probes are sent periodically on all the active and passive links. A configured number of samples is collected and a running average for each such application’s probe path is measured. If there is a violation detected for any application traffic, the probe metrics are evaluated to determine the best link that satisfies the SLA.
-
Passive probe—Passive probes are installed on links within the network, and they monitor all the traffic that flows through those links.
Passive probing monitors links for SLA violations on live data traffic. In a passive probe, the actual data packets are encapsulated in an IP/UDP probe header in the live traffic between the device book-ended points, and RTT, jitter and packet loss between the points of installation of the probes are measured to compute the service quality.
If there is a violation detected for any application, the synthetic probe metrics are evaluated to determine the best link that satisfies the SLA.
You can configure an SLA rule with active and passive probe parameters and associate the SLA rule with APBR profile. The APBR profile also includes a APBR rule. Rules are associated with one or more than one application or application groups and the traffic matching the rule is redirected to the routing instance
AppQoE triggers the probe requests to all probe paths of the application. Active and passive probes monitor the network for areas or points of failures or congestion.
AppQoE collects traffic class statistics for learned applications using active and passive probes and takes following actions:
Measure performance for SLA—The real-time metrics provided by probes are used to score service quality according to the SLA for an application and determine whether the application path does not meet SLA requirements. That is, if there is a violation detected for any application, the synthetic probe metrics are evaluated to determine the best alternate link for the application traffic that satisfies the SLA.
Reroute traffic—Switch the application traffic between the two links, that is, when one link has performance issues, the traffic is routed to the other link during the same session.
If the application’s traffic can be reachable through multiple links, you must configure all the reachable paths as overlay paths and attach the overlay paths to application’s SLA rule.
Switching Application Traffic to An Alternate Path
You can enable or disable switching of the application traffic to another route (local to the device) during an SLA violation. When local route switching is enabled, switching of the application traffic to an alternate route is enabled and the SLA monitoring and reporting functionality is also available. Even when the option for switching of the application traffic to an alternate path is disabled in the SLA rule configuration, AppQoE resolves SLA violations---for example, by switching the application traffic to a new path
When local route switching is disabled, only SLA monitoring and reporting functionality is available and switching of the application traffic to the different route because of an SLA violation is tuned off.
When an application traffic switches to an alternative path, there will be a short time period during which the application traffic cannot be switched again to another path in case of SLA violation. This time period helps to avoid flapping of the traffic across links.
Example: Application Quality of Experience (AppQoE)
This example shows how to configure AppQoE to provide quality of experience (QoE) by enabling real- time monitoring of the application traffic according to the specified SLA..
This example provides step-by-step procedures required for Juniper devices to provide the quality-of-experience (QoE) service using AppQoE. In this configuration, devices in the network prioritize certain application traffic to enhance the user experience based on service-level agreement (SLA).
Requirements
-
Valid application identification feature license installed on a Juniper device.
-
Appropriate security policies to enforce rules for the transit traffic, in terms of what traffic can pass through the device, and the actions that need to take place on the traffic as it passes through the device.
-
Enable application tracking support enabled for the zone. See Application Tracking.
-
Supported NFX device with Junos OS Release 18.2R1 or later. This configuration example is tested for Junos OS Release 15.1X49-D130 on an SRX Series device.
Overview
AppQoE monitors the performance of business-critical applications, and based on the score, selects the best possible link for that application traffic in order to meet performance requirements that are specified as in the SLA. To achieve this goal, AppQoE creates application-specific SLA rules and associates the SLA rules to an APBR profile and to a routing instance on which the application traffic will be sent.
AppQoE measures the application performance across multiple links by collecting real-time data by continuously monitoring application traffic and identifying any network or device issues by active and passive probing. Measured application data is used to determine whether the application path meets SLA requirements and whether an alternate path can be used to reroute the traffic to meet the SLA requirements.
Figure 2 shows the topology used in this configuration example.
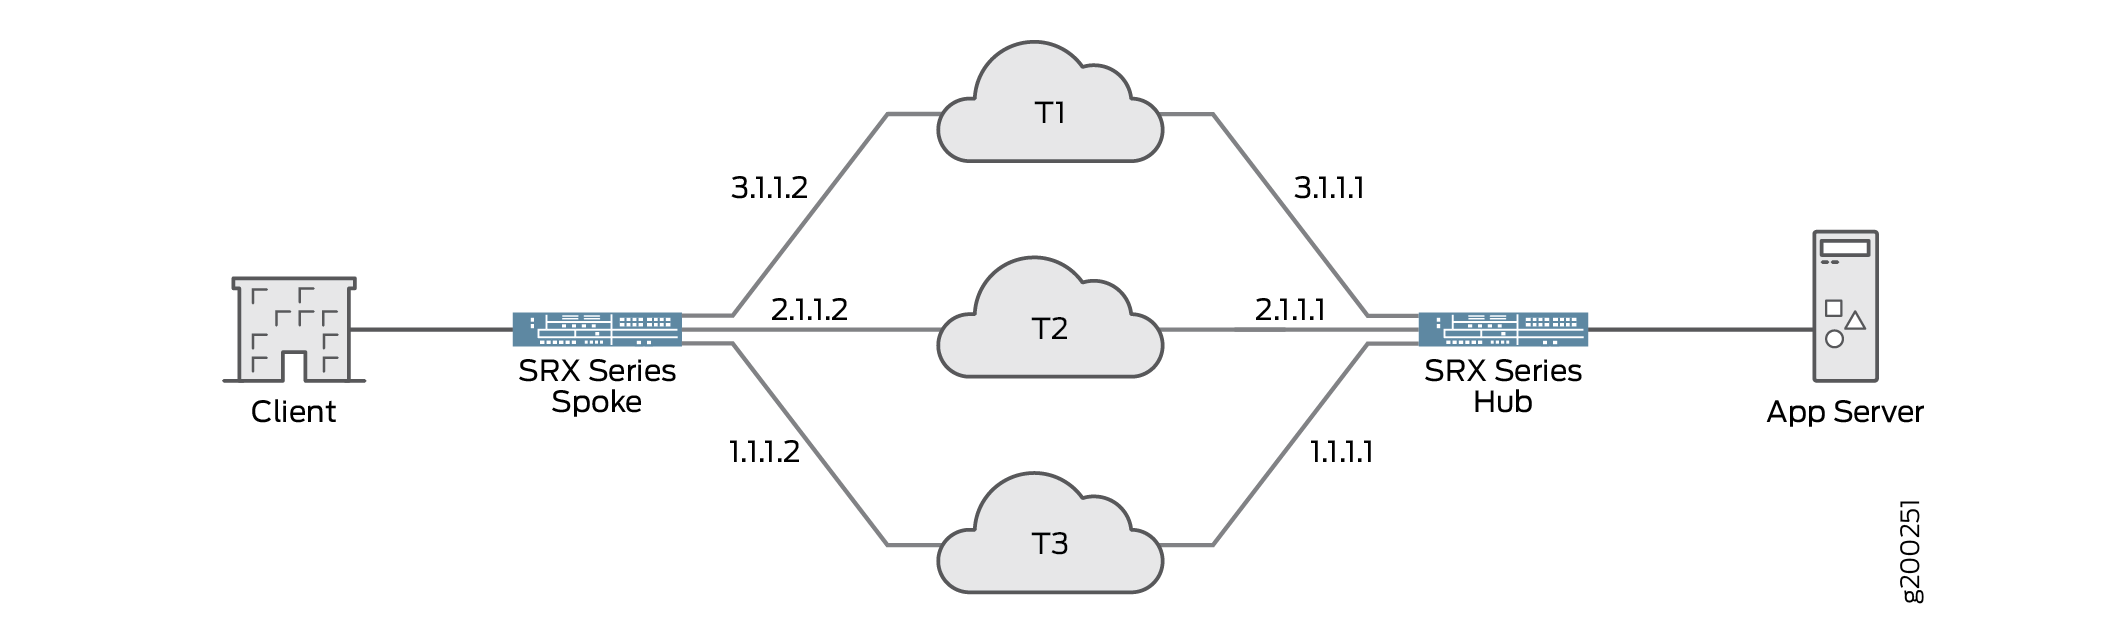
Table 1 provides the details of the parameters used in this example.
| Parameter | Name | Description |
|---|---|---|
| APBR profile | apbr1 | Name of the APBR profile. This profile matches applications and application groups and redirects the matching traffic to the specified routing instance for route lookup. The profile includes multiple rules. |
| APBR rule |
rule-app1 rule-app2 rule-app2 |
Define the rules for the APBR profile. Associate the rule with one or more than one application (example: for HTTP, FTP, and SSH) or application groups. |
| Routing Instance | appqoe-vrf | Instance type as routing and forwarding (VRF) instance |
| RIB group | lanvrf | Name of the routing information base (RIB) (also known as routing table) group. |
| Define AppQoE as service | system-services=appqoe | Enable AppQoE as an individual service to allow host-inbound custom probe traffic that can reach the device for all the interfaces in a zone. |
| SLA rule |
|
Individual applications and application group must have an SLA rule attached. The SLA rule includes all required information to measure the SLA and to identify whether any SLA violation has occurred or not. It contains the complete probe profiles, time period at which profile need to be sent, preferred SLA configuration and so on. An SLA rule is associated with an APBR rule, which is matched to the application or application group. |
| SLA options | local-route-switch = enabled | Specify local route switch option. This option enables switching of application traffic to an alternate path if an SLA violation occurs. |
| SLA metrics profile |
|
Defines the performance metrics for delay round trip, one-way jitter or two-way jitter, and packet loss. AppQoE uses metrics profile to evaluate the SLA of the link. |
| Active probes |
|
An active probe parameter configures the probe data information such as probe’s data size, intervals between individual probes, and so on. Active probe will be initiated from the spoke device to the hub device on each of the overlay path. |
| Overlay path |
overlay-path1 Tunnel
Probe
|
Configuring an overlay path allows you to specify the destinations to which the active probe data needs to be sent. Overlay paths are configured for all overlay endpoints. Overlay path configuration includes two set of IP addresses:
|
|
path2 Tunnel
Probe
|
||
|
path3 Tunnel
Probe
|
||
| Destination Grouping | destination-path-group-1 | You can group all the overlay paths terminating at the same destination under a destination group. In this example, you have a single destination—that is, hub device. So, all paths are configured under the same destination group and all the paths must be available in the routing instance specific for active probing. |
Before you begin
-
When a traffic is identified for AppQoE, that traffic could be fragmented when the packet size exceeds the supported MTU value with the additional encapsulation of the probe header.
To manage the fragmentation, we recommend you to configure the maximum segment size for TCP sessions for SRX Series devices using the following commands:
[edit] user@hostset security flow tcp-mss ipsec-vpn mss 1200 user@hostset security flow tcp-mss all-tcp mss 1350 -
The passive probe packet carries actual source and destination IP address of the client packets. To allow the passive probe packets through the system, you must complete the following configuration:
-
Configure address-based custom applications signatures for UDP (port 36000). This configuration helps in identifying the application by AppID.
[edit] user@hostset services application-identification application jun-appqoe priority high user@hostset services application-identification application jun-appqoe address-mapping addr1 filter port-range udp 36000 -
You must create an appropriate security policy and application firewall policy to support the above configuration.
-
Passive probes generate application tracking log messages for session create and session delete. Once the custom signature identifies these packets, the message reports application as jun-appqoe.
Configuring AppQoE
- Configure Advanced Policy-Based Routing (APBR)
- Configuring Metrics Profile
- Configure Active Probe Parameters
- Configuring Overlay and Probe Paths
- Configure SLA Rule
- Configure SLA Rule Setting with APBR
- Configure AppQoE on Device Acting as Hub
- Results
Configure Advanced Policy-Based Routing (APBR)
Configure APBR profiles for HTTP, FTP, and SSH applications traffic.
Create routing instances.
user@host# set routing-instances appqoe-vrf instance-type vrf
user@host# set routing-instances appqoe-vrf routing-options static route 9.0.0.0/8 next-hop [gr-0/0/0.0 gr-0/0/0.1 gr-0/0/0.2 ]
user@host# set routing-instances appqoe-vrf routing-options static route 12.1.1.0/24 next-hop 22.1.1.2
user@host# set routing-instances appqoe-vrf routing-options static route 13.1.1.0/24 next-hop 23.1.1.2
user@host# set routing-instances appqoe-vrf routing-options static route 14.1.1.0/24 next-hop 24.1.1.2
Group one or more routing tables to form a RIB group and import routes into the routing tables.
user@host# set routing-options rib-groups lanvrf import-rib appqoe-vrf.inet.0 inet.0
Create the APBR profile and define the rules.
user@host# security advance-policy-based-routing profile apbr1 rule rule-app1 match dynamic-application junos:HTTP
user@host# security advance-policy-based-routing profile apbr1 rule rule-app2 match dynamic-application junos:FTP
user@host# security advance-policy-based-routing profile apbr1 rule rule-app2 match dynamic-application junos:SSH
user@host# set security advance-policy-based-routing profile apbr1 rule rule-app1 then routing-instance appqoe-vrf
user@host# set security advance-policy-based-routing profile apbr1 rule rule-app2 then routing-instance appqoe-vrf
user@host# set security advance-policy-based-routing profile apbr1 rule rule-app3 then routing-instance appqoe-vrf
Configure AppQoE as system service.
user@host# set security zones security-zone trust host-inbound-traffic system-services appqoe
Apply the APBR profile to the security zone.
user@host# set security zones security-zone trust host-inbound-traffic protocols all
user@host# set security zones security-zone trust advance-policy-based-routing-profile apbr1
Configuring Metrics Profile
Create the set of metrics which AppQoE uses to evaluate the SLA of the link.
user@host# set security advance-policy-based-routing metrics-profile metric1 sla-threshold jitter 5000
user@host# set security advance-policy-based-routing metrics-profile metric1 sla-threshold jitter-type two-way-jitter
user@host# set security advance-policy-based-routing metrics-profile metric1 sla-threshold packet-loss 50
user@host# set security advance-policy-based-routing metrics-profile metric1 sla-threshold match all
user@host# set security advance-policy-based-routing metrics-profile metric2 sla-threshold delay-round-trip 4000
Configure Active Probe Parameters
Configure active probing to send custom packets between spoke device and hub device on all routes to measure RTT, jitter, and packet loss between the points.
Configure active probe parameter (probe1).
user@host# set security advance-policy-based-routing active-probe-params probe1 settings data-fill deadbead
user@host# set security advance-policy-based-routing active-probe-params probe1 settings data-size 100
user@host# set security advance-policy-based-routing active-probe-params probe1 settings probe-interval 10
user@host# set security advance-policy-based-routing active-probe-params probe1 settings probe-count 10
user@host# set security advance-policy-based-routing active-probe-params probe1 settings burst-size 10
user@host# set security advance-policy-based-routing active-probe-params probe1 settings enable-sla-export 600
Configuring active probe parameter (probe2).
user@host# set security advance-policy-based-routing active-probe-params probe2 settings data-fill juniper
user@host# set security advance-policy-based-routing active-probe-params probe2 settings data-size 256
user@host# set security advance-policy-based-routing active-probe-params probe2 settings probe-interval 30
user@host# set security advance-policy-based-routing active-probe-params probe2 settings probe-count 300
user@host# set security advance-policy-based-routing active-probe-params probe2 settings enable-sla-export 600
Configuring Overlay and Probe Paths
Configure an overlay setup, which includes setting up both tunnel path and probe path, between local and remote endpoint on both ends of the overlay (spoke device and hub devices).
Create overlay paths for the tunnel and probe (overlay-path1).
user@host# set security advance-policy-based-routing overlay-path overlay-path1 tunnel-path local ip-address 1.1.1.2
user@host# set security advance-policy-based-routing overlay-path overlay-path1 tunnel-path remote ip-address 1.1.1.1
user@host# set security advance-policy-based-routing overlay-path overlay-path1 probe-path local ip-address 1.1.1.2
user@host# set security advance-policy-based-routing overlay-path overlay-path1 probe-path remote ip-address 1.1.1.1
Create overlay paths for the tunnel and probe (overlay-path2).
user@host# set security advance-policy-based-routing overlay-path overlay-path2 tunnel-path local ip-address 2.1.1.2
user@host# set security advance-policy-based-routing overlay-path overlay-path2 tunnel-path remote ip-address 2.1.1.1
user@host# set security advance-policy-based-routing overlay-path overlay-path2 probe-path local ip-address 2.1.1.2
user@host# set security advance-policy-based-routing overlay-path overlay-path2 probe-path remote ip-address 2.1.1.1
-
Create overlay paths for the tunnel and probe (overlay-path3).
user@host# set security advance-policy-based-routing overlay-path overlay-path3 tunnel-path local ip-address 3.1.1.2
user@host# set security advance-policy-based-routing overlay-path overlay-path3 tunnel-path remote ip-address 3.1.1.1
user@host# set security advance-policy-based-routing overlay-path overlay-path3 probe-path local ip-address 3.1.1.2
user@host# set security advance-policy-based-routing overlay-path overlay-path3 probe-path remote ip-address 3.1.1.1
-
Group all the overlay paths terminating at a destination. Because there is a single destination available—that is, the hub device— all paths must be configured under the same destination group. All paths must be available in the routing instance specific for active probing.
user@host# set security advance-policy-based-routing destination-path-group destination-path-group-1 probe-routing-instance R1-appqoe
user@host# set security advance-policy-based-routing destination-path-group destination-path-group-1 overlay-path overlay-path1
user@host# set security advance-policy-based-routing destination-path-group destination-path-group-1 overlay-path overlay-path2
user@host# set security advance-policy-based-routing destination-path-group destination-path-group-1 overlay-path overlay-path3
Configure SLA Rule
Configure an SLA rule to measure the SLA and to identify any SLA violation has occurred or not.
Configure the SLA rule, associate metrics profile, active probe parameter, and define passive probe parameters.
user@host# set security advance-policy-based-routing sla-rule sla1 switch-idle-time 60Define switch idle time for the SLA rule.
user@host# set security advance-policy-based-routing sla-rule sla1 metrics-profile metric1Associate active probe parameter (probe1) to the SLA rule.
user@host# set security advance-policy-based-routing sla-rule sla1 active-probe-params probe1Define passive probe parameters.
user@host# set security advance-policy-based-routing sla-rule sla1 passive-probe-params type book-ended
user@host# set security advance-policy-based-routing sla-rule sla1 passive-probe-params violation-count 5
user@host# set security advance-policy-based-routing sla-rule sla1 passive-probe-params sampling-percentage 25
user@host# set security advance-policy-based-routing sla-rule sla1 passive-probe-params sampling-period 60000
user@host# set security advance-policy-based-routing sla-rule sla1 passive-probe-params sla-export-factor 60
Configure SLA Rule Setting with APBR
Associate an SLA rule to with the APBR profile.
Enable local route switching. This option enables switching of application traffic to an alternate path if an SLA violation occurs.
user@host# set security advance-policy-based-routing sla-options local-route-switch enabled
Configure SLA rule setting with APBR.
user@host# set security advance-policy-based-routing profile apbr1 rule rule-app1 then sla-rule sla1
user@host# set security advance-policy-based-routing profile apbr1 rule rule-app2 then sla-rule sla2
user@host# set security advance-policy-based-routing profile apbr1 rule rule-app3 then sla-rule sla1
Configure AppQoE on Device Acting as Hub
Configure AppQoE as service. You must configure AppQoE as service for host inbound traffic for a desired zone.
user@host# set security zones security-zone zone1 host-inbound-traffic system-services appqoe
Configure the percentage of sessions selected for book-ended measurement (passive probing).
user@host# set security advance-policy-based-routing sla-rule sla1 passive-probe-setting session-sampling-percentage 25
Results
From configuration mode, confirm your configuration by entering the show commands. If the output does not display the intended configuration, repeat the configuration instructions in this example to correct it.
[edit security]
user@host# show advance-policy-based-routing
profile apbr1 {
    rule rule1 {
        match {
            dynamic-application [ junos:FTP junos:HTTP junos:SSH ];
        }
        then {
            routing-instance appqoe;
            sla-rule {
                sla_rule1;
            }
        }
    }
}

active-probe-params active_probes {
    settings {
        data-fill {
            deadbead;
        }
        data-size {
            100;
        }
        probe-interval {
            10;
        }
        probe-count {
            10;
        }
        burst-size {
            10;
        }
        enable-sla-export {
            600;
        }
    }
}

metrics-profile metrics_profile1 {
    sla-threshold {
        delay-round-trip {
            4000;
        }
        jitter {
            5000;
        }
        jitter-type {
            two-way-jitter;
        }
        packet-loss {
            50;
        }
        match {
            all;
        }
    }
}

overlay-path overlay-path1 {
    tunnel-path {
        local {
            ip-address {
                1.1.1.2;
            }
        }
        remote {
            ip-address {
                1.1.1.1;
            }
        }
    }
    probe-path {
        local {
            ip-address {
                1.1.1.2;
            }
        }
        remote {
            ip-address {
                1.1.1.1;
            }
        }
    }
}

overlay-path overlay-path2 {
    tunnel-path {
        local {
            ip-address {
                2.1.1.2;
            }
        }
        remote {
            ip-address {
                2.1.1.1;
            }
        }
    }
    probe-path {
        local {
            ip-address {
                2.1.1.2;
            }
        }
        remote {
            ip-address {
                2.1.1.1;
            }
        }
    }
}

overlay-path overlay-path3 {
    tunnel-path {
        local {
            ip-address {
                3.1.1.2;
            }
        }
        remote {
            ip-address {
                3.1.1.1;
            }
        }
    }
    probe-path {
        local {
            ip-address {
                3.1.1.2;
            }
        }
        remote {
            ip-address {
                3.1.1.1;
            }
        }
    }
}

destination-path-group destination-path-group-1 {
    probe-routing-instance {
        abc;
    }
    overlay-path overlay-path1;
    overlay-path overlay-path2;
    overlay-path overlay-path3;
}

sla-rule sla_rule1 {
    switch-idle-time {
        60;
    }
    metrics-profile {
        metrics_profile1;
    }
    active-probe-params {
        active_probes;
    }
    passive-probe-params {
        sampling-percentage {
            25;
        }
        violation-count {
            3;
        }
        sampling-period {
            60000;
        }
        sla-export-factor {
            60;
        }
        type {
            book-ended;
        }
    }
}[edit routing-instances]
user@host# show appqoe-vrf
routing-options {
static {
route 9.0.0.0/8 next-hop [ gr-0/0/0.0 gr-0/0/0.1 gr-0/0/0.2 ];
route 12.1.1.0/24 next-hop 22.1.1.2;
route 13.1.1.0/24 next-hop 23.1.1.2;
route 14.1.1.0/24 next-hop 24.1.1.2;
}
}[edit routing-options]
user@host# show
rib-groups {
lanvrf {
import-rib [ lan-vrf.inet.0 inet.0 ];
}
}
forwarding-table {
export load-balancing-policy;
}[edit security advance-policy-based-routing profile apbr1}
user@host# show
rule rule1 {
match {
dynamic-application [ junos:FTP junos:HTTP junos:SSH ];
}
then {
routing-instance appqoe-vrf;
sla-rule {
sla_rule1;
}
}
}[edit security zones
user@host# show
security-zone trust {
host-inbound-traffic {
system-services {
all;
}
protocols {
all;
}
}
interfaces {
ge-0/0/5.0;
}
application-tracking;
advance-policy-based-routing-profile {
apbr1
}
}Verify AppQoE Configuration
- Verifying SLA Profile
- Verifying SLA Profile Status
- Displaying SLA Statistics
- Display SLA Statistics for An Application
- Display Active Probe Statistics
Verifying SLA Profile
Purpose
Display the SLA version.
Action
From operational mode, enter the show security
advance-policy-based-routing sla version command.
user@host>show security advance-policy-based-routing sla version
SLA version: APPQOE.VERS.1.0.0.0
Meaning
The command output displays the version of AppQoE. This information helps verify that the SLA version on both hub device and spoke device is same.
Verifying SLA Profile Status
Purpose
Verify that the SLA is enabled on your device.
Action
From operational mode, enter the show security
advance-policy-based-routing sla status command.
user@host>show security advance-policy-based-routing sla status
Local Switching is enabled.
Meaning
The command output confirms that local switching is enabled. That is, switching of the application traffic to another route (local to the device) during an SLA violations, is enabled.
When local route switching is enabled, switching of application traffic to other route is enabled and also SLA monitoring and reporting functionality is available. This configuration selects the best possible link for that application traffic in order to meet performance requirements as in the SLA.
Displaying SLA Statistics
Purpose
Display the details of the SLA statistics based on APBR profile.
Action
From operational mode, enter the show security
advance-policy-based-routing sla statistics command.
user@host>show security advance-policy-based-routing sla statistics
Advance Profile Based Routing SLA statistics:
    Passive Probe Statistics
        Passive Probe Session Processed  7040
          Possible Passive Probe Sessions  0
          Passive Probe Sessions Sampled   0
          Passive Probe Ongoing Sessions   0
          SLA violations                   0
Active Probe Statistics
          Active Probe Paths               0
          Active Probe Session             3
          Active Probes Sent               18360
          Active Probe Paths down          3
Meaning
The command output displays the session details subjected to passive probe and active probe.
Display SLA Statistics for An Application
Purpose
Display the details of the application traffic.
Action
From operational mode, enter the show security
advance-policy-based-routing sla command.
user@host> show security advance-policy-based-routing sla profile apbr-1 destination-group-name d1 status apbr1 application junos:HTTP
Application status:
  Num of SLA Violations       0
  Num of Path Switches        1
  Num of monitored sessions   0
  Num of sessions             0
user@host> show security advance-policy-based-routing sla profile apbr-1 application junos:HTTP destination-group-name d1
Application Details:
  Application Name            junos:HTTP
  Application ID              67
  APBR Profile Name           apbr1
  APBR Rule Name              rule1
  Application State           NO PATH SELECTED
  Path Switch Idle State      0
  Routing Instance Name       appqoe-vrf
  SLA Rule Name               sla1
  Active Probe Name           probe1
  Selected Tunnel Destination 0.0.0.0
SLA Metrics:
PKT-LOSS(%)     RTT(us)         2way-Jit(us)    Ing-Jit(us)     Egr-Jit(us)
  0               0               0               0               0
Meaning
The command output samples help in understanding application details, APBR profile, SLA rule, application status, SLA violations occurred, number of times application traffic has switched route path, and monitored sessions.
Display Active Probe Statistics
Purpose
Display active probe statistics.
Action
From operational mode, enter the show security
advance-policy-based-routing sla active-probe-statistics
active-probe-params-name command.
user@host> show security advance-policy-based-routing sla active-probe-statistics active-probe-params-name probe1
Active Probe Statistics:
Src-IP          Dst-IP          PKT-LOSS(%)     RTT(us)         2way-Jit(us)    Ing-Jit(us)     Egr-Jit(us)
  3.1.1.2         3.1.1.1         0               2633            119             86              55
  2.1.1.2         2.1.1.1         0               3647            58              67              56
  1.1.1.2         1.1.1.1         0               4101            42              61              53
Meaning
The output shows RTT, jitter and packet-loss measured between the installed probe points.
Advanced Policy-Based Routing on NFX Devices
Advanced policy-based routing (APBR) also known as application-based routing, a new addition to Juniper Networks suite, provides the ability to forward traffic based on applications. For more information, see the following topics:
- Understanding Advanced Policy-Based Routing
- Example: Configuring Advanced Policy-Based Routing for Application-Aware Traffic Management Solution
- Configuring Advanced Policy-Based Routing Policies
- Example: Configuring Advanced Policy-Based Routing Policies
Understanding Advanced Policy-Based Routing
The relentless growth of voice, data, and video traffic and applications traversing on the network requires that networks recognize traffic types to effectively prioritize, segregate, and route traffic without compromising performance or availability. Juniper devices support advanced policy-based routing (APBR) to address these challenges.
This topic includes the following sections:
- Application Identification
- Filter-Based Forwarding or Policy-Based Routing (PBR)
- Advanced Policy-Based Routing
- Benefits of APBR
- Understanding How APBR Works
- Advanced Policy-Based Routing Midstream Support
- Advanced Policy-Based Routing Options For Streamlining Traffic Handling
- Use Case
- Limitations
Application Identification
Juniper devices support application identification (AppID) using deep packet inspection (DPI) technology. Junos OS application identification recognizes Web-based and other applications and protocols at different network layers using characteristics other than port number. Applications are identified by using a protocol bundle containing application signatures and parsing information. The identification is based on protocol parsing and decoding and session management. An application system cache (ASC) is maintained, where the applications identified are cached based on server (destination) IP address and port and logical system identification.
ASC saves the mapping between an application type and the corresponding destination IP address, destination port, protocol type, and service. Once an application is identified, its information is saved in the ASC so that only one matching entry is required for an application running on a particular system. When the cache entry is present and it is valid, the identified application is picked from cache, thereby expediting the identification process.
Filter-Based Forwarding or Policy-Based Routing (PBR)
Juniper devices support filter-based forwarding, also known as policy-based routing (PBR), in which data packets are forwarded and routed based on the defined policies or filters. PBR includes a mechanism for selectively applying policies based on access list, packet size, or other criteria and routing the packets on user-defined routes.
When a device receives a packet, it routes the packets based on the information present in the packet header such as destination port, source IP address, and incoming interfaces. While processing an incoming packet, the device performs a routing table lookup to find the appropriate interface that leads to the destination address.
However, in some cases, you might need to forward the packet based on other criteria. In filter-based forwarding, you must create a filter that will match the type of traffic that you are going to direct to a different next hop. You can define matching criteria such as IP address, port, protocol, TCP flags, and much more. Once you have defined your term to include the match criteria, the action will be to send the traffic to an appropriate route and corresponding interface.
For example, perhaps you want to offer services to your customers, and the services reside on different servers. You can use filter-based forwarding to send traffic to the servers by applying a match condition in the packet header such as destination port, source IP address, and incoming interfaces, and send the packets to a certain outgoing interface that is associated with the appropriate server.
Advanced Policy-Based Routing
Advanced policy-based routing is a type of session-based, application-aware routing. This mechanism combines the policy-based routing and application-aware traffic management solution. APBR implies classifying the flows based on applications’ attributes and applying filters based on these attributes to redirect the traffic. The flow-classifying mechanism is based on packets representing the application in use.
APBR implements:
-
Deep packet inspection and pattern-matching capabilities of AppID to identify application traffic or a user session within an application
-
Lookup in ASC for application type and the corresponding destination IP address, destination port, protocol type, and service for a matching rule
If a matching rule is found, the traffic is directed to an appropriate route and the corresponding interface or device.
Benefits of APBR
Enables you to define the routing behavior based on applications.
Provides more flexible traffic-handling capabilities and offers granular control for forwarding packets based on application attributes.
Understanding How APBR Works
The following steps are involved in APBR:
-
Create an APBR profile (also referred to as an application profile in this document) that will match the type of traffic that you are going to direct to a different next hop. The profile includes multiple rules. Each rule can contain multiple applications or application groups. If the application matches any of the application or application groups of a rule in a profile, the application profile rule is considered as a match.
-
Associate a routing instance with the application profile rule. When the traffic on the ingress zone and interface matches an application profile, the associated static route and next hop defined in the routing instance is used to route the traffic for the particular session.
-
Associate the application profile to the ingress traffic The application profile can be attached to a security zone or it can be attached to a specific logical or physical interface associated with the security zone. If the application profile is applied to a security zone, then all interfaces belonging to that zone are attached to the application profile by default unless a specific configuration already exists for that interface.
Figure 3 shows the sequence in which APBR techniques are applied.
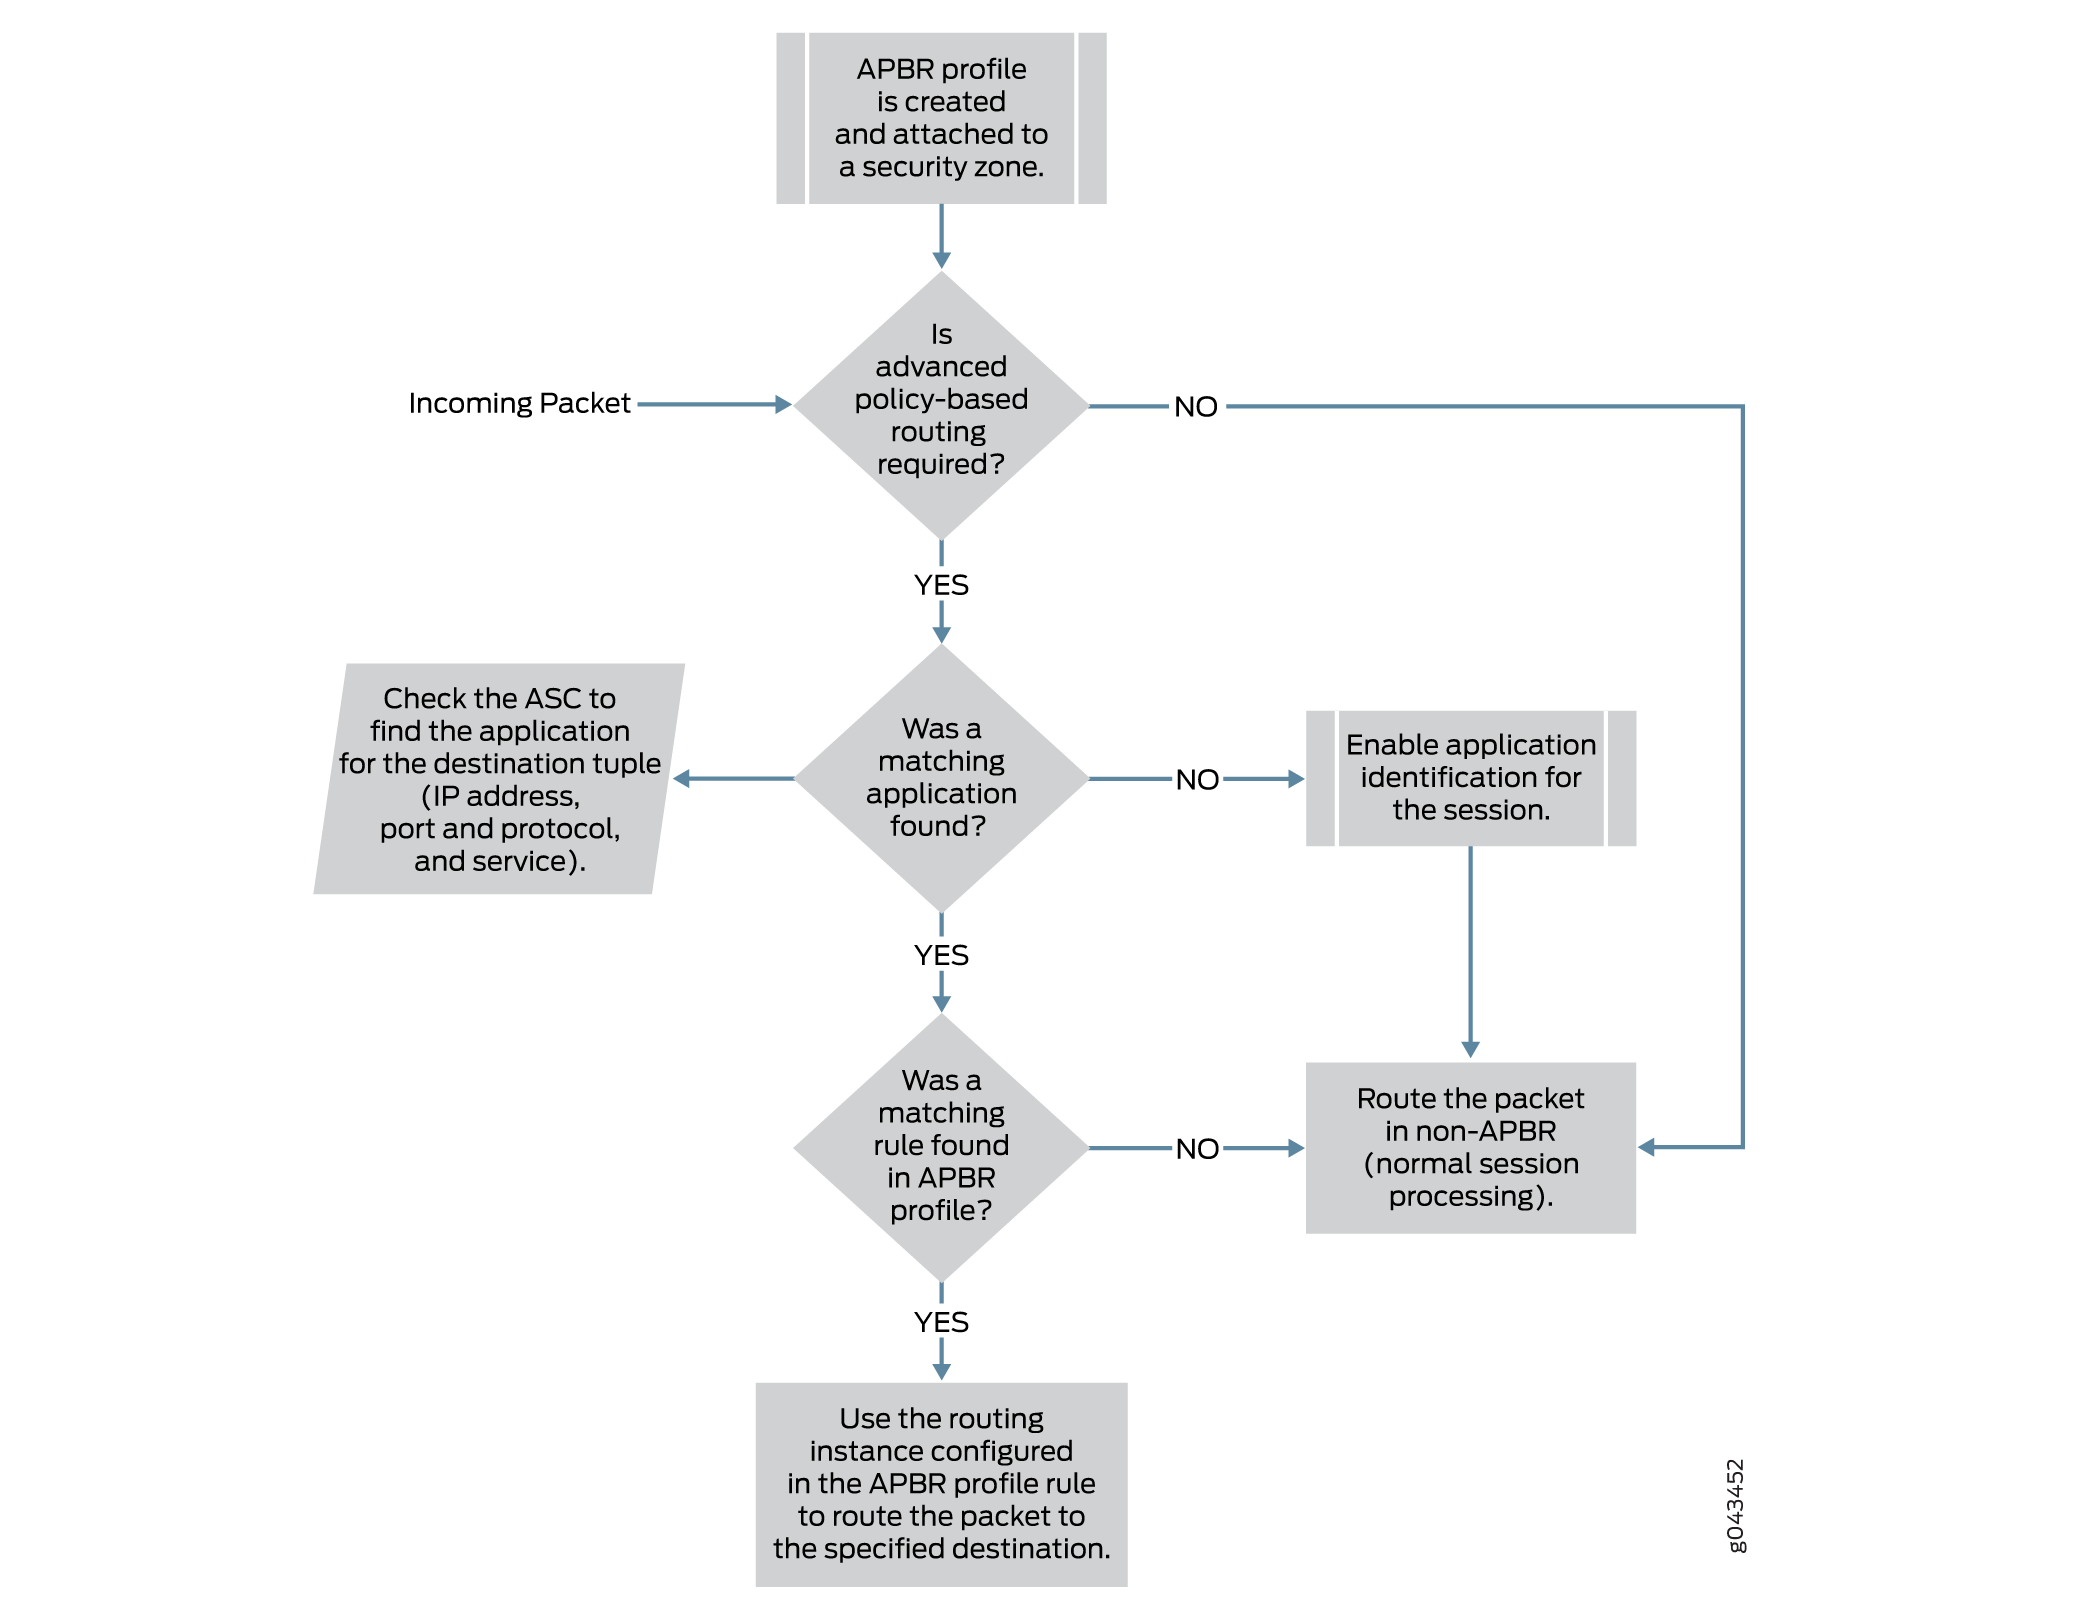
APBR evaluates the packets based on incoming interface to determine if the session is candidate for application-based routing. If the traffic has not been flagged for application-based routing, it undergoes normal processing (non-APBR route).
If the session needs application-based routing, APBR queries the application system cache (ASC) module to get the application attributes details (IP address, destination port, protocol type, and service).
If the ASC is found, it is further processed for a matching rule in the APBR profile (see Step 3). If the ASC is not found and the application signature is installed and ASC is enabled, application identification for the session is enabled so that ASC can be populated for use by subsequent sessions for the destination tuple.
APBR uses the application details to look for a matching rule in the APBR profile (application profile). If a matching rule is found, the traffic will be redirected to the specified routing instance for the route lookup.
Advanced Policy-Based Routing Midstream Support
Juniper devices support advanced policy-based routing (APBR) with an additional enhancement to apply the APBR in the middle of a session (which is also known as midstream support). With this enhancement, you can apply APBR for a non-cacheable application and also for the first session of the cacheable application. The enhancement provides more flexible traffic-handling capabilities that offer granular control for forwarding packets.
Figure 4 shows the sequence in which APBR techniques with midstream support are applied.
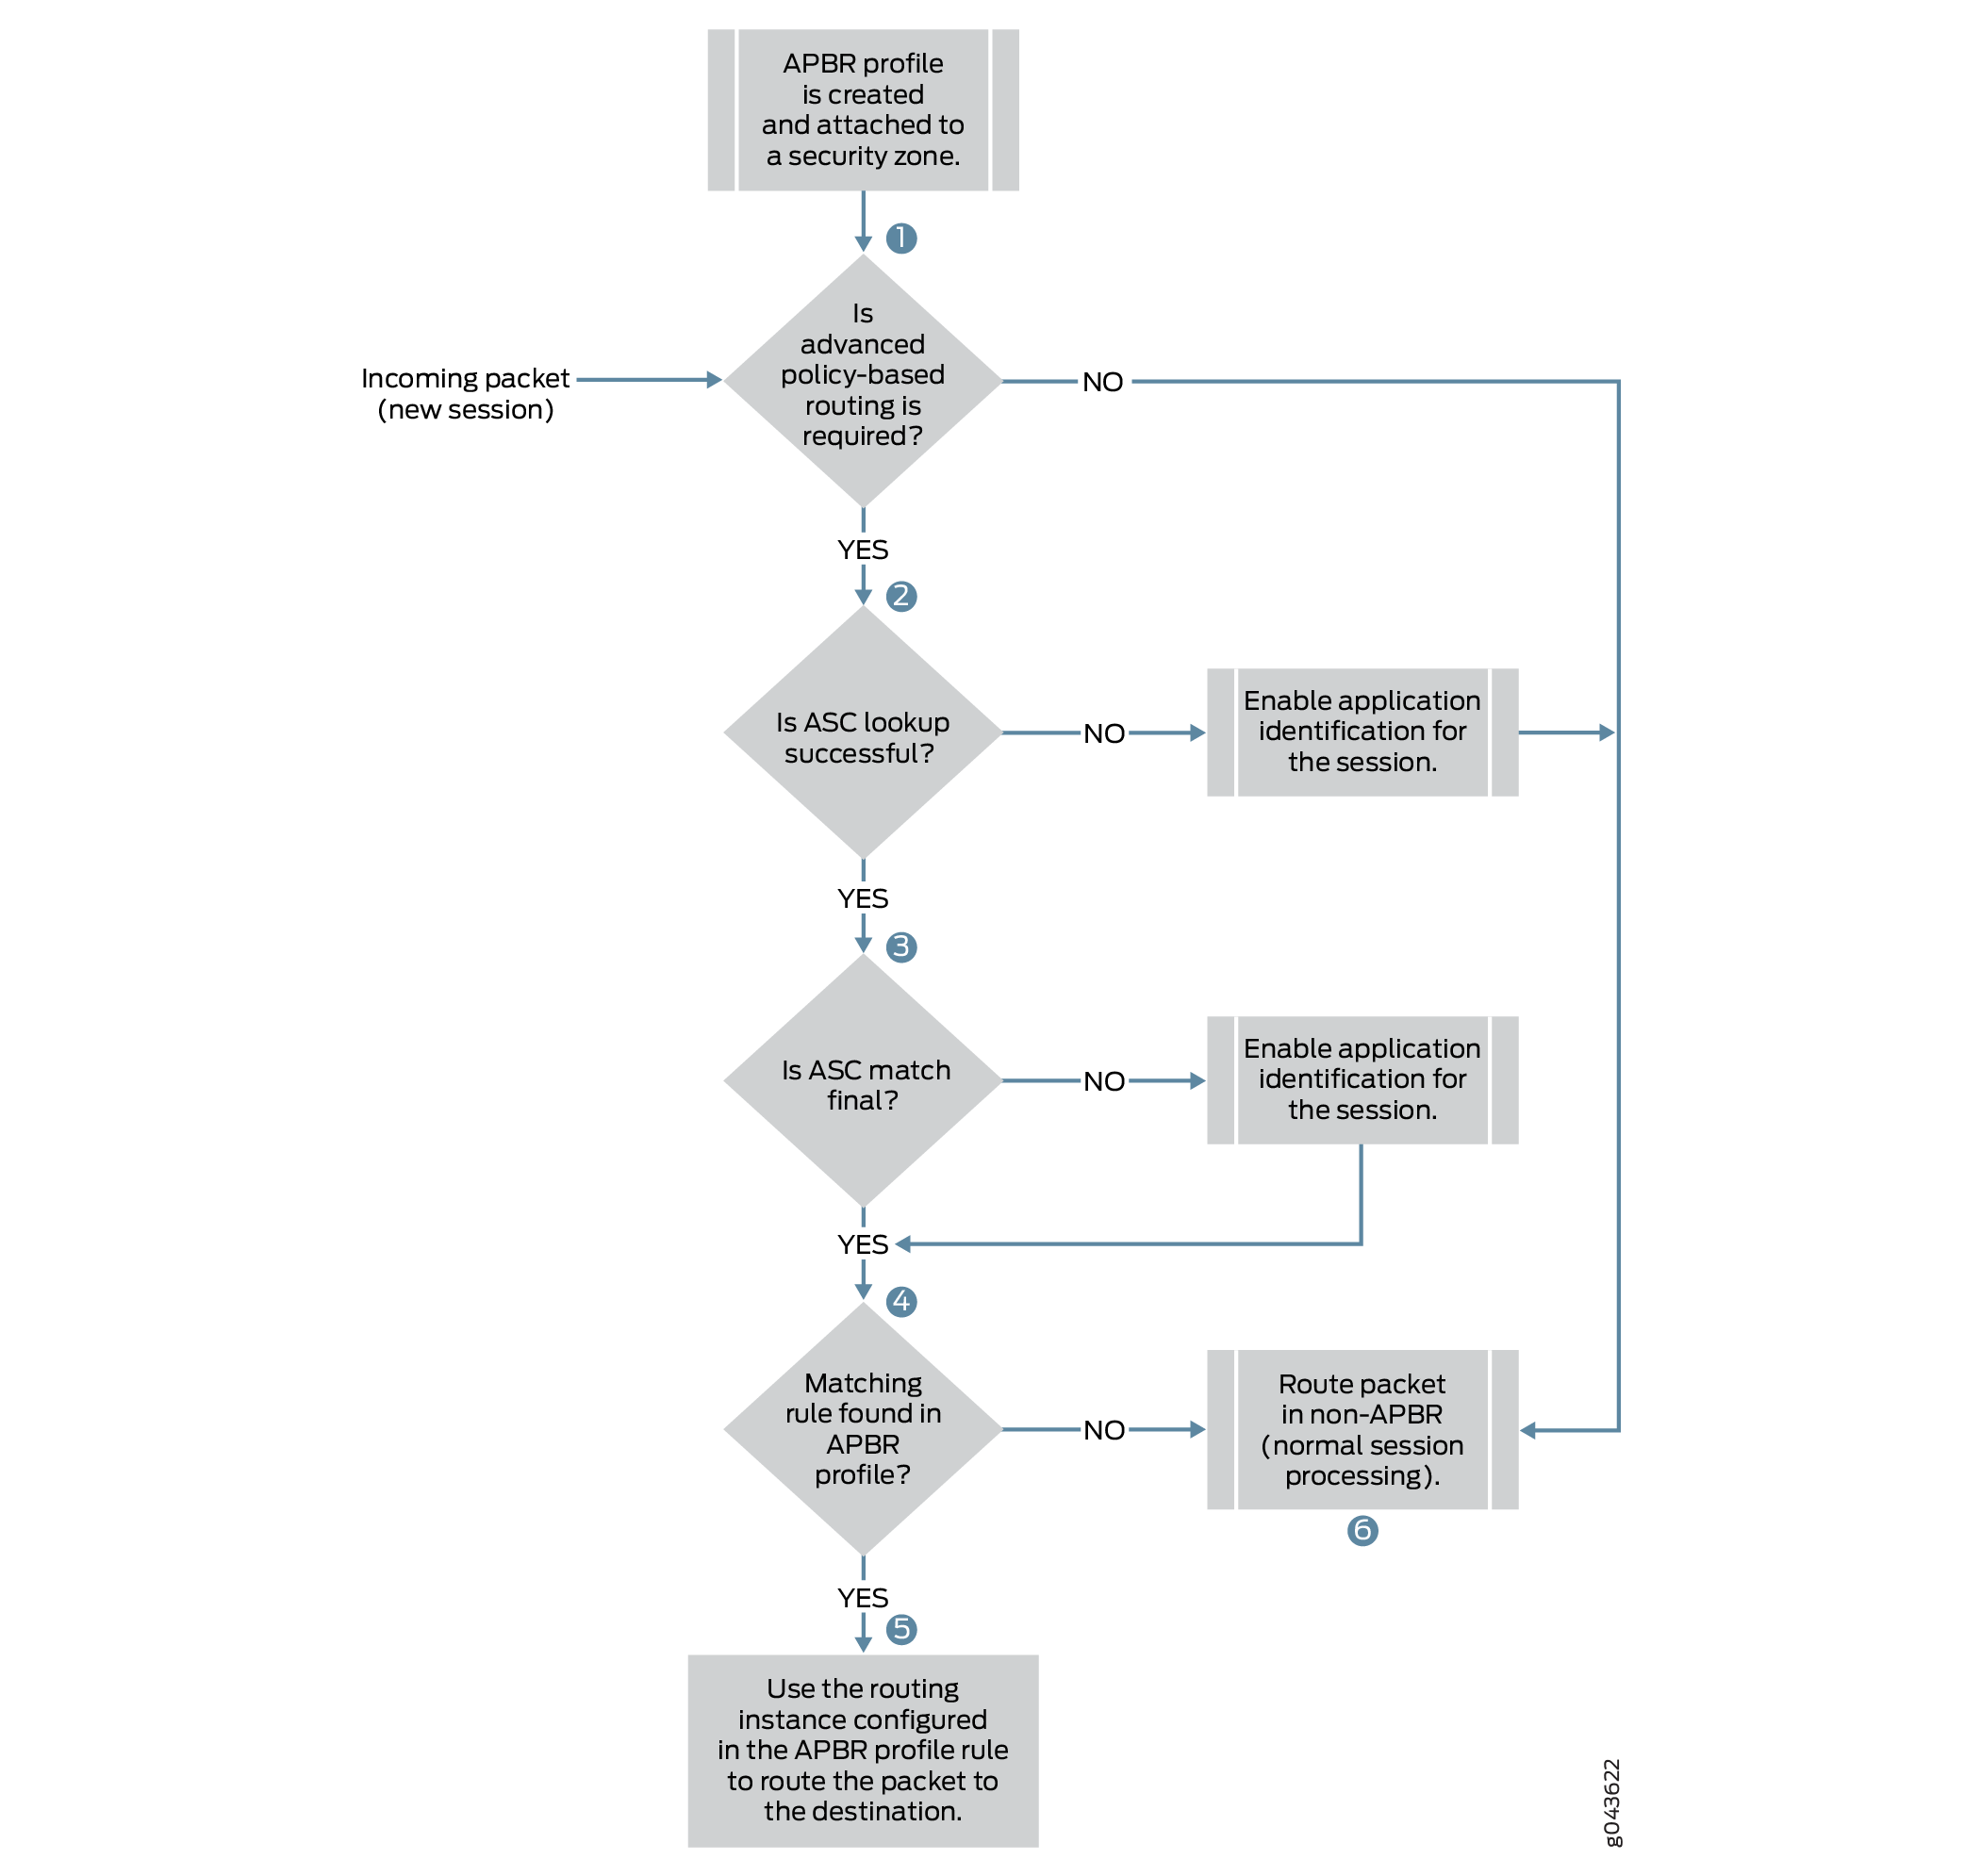
Step 1: APBR evaluates the packets based on incoming security zone to determine if the session is candidate for application-based routing. If this is first packet of the new session and traffic is not flagged for application-based routing, it undergoes normal processing (non-APBR route) step 6.
Step 2: If the session needs application-based routing, APBR queries the application system cache (ASC) module to get the application attributes details (IP address, destination port, protocol type, and service). If the ASC is found, it is further processed to determine if the application match using ASC is final (see Step 3). APBR could also identify applications using ALG for the data sessions. If the application is matched using the ALG it is considered as final match. If the final application has not been identified, the DPI engine is engaged for the session to identify the application. The existing session undergoes normal processing (non-APBR route) step 6.
Step 3: If an application has been identified, it is further processed for a matching rule in the APBR profile (see Step 4).
Step 4: APBR uses the application details to look for a matching rule in the APBR profile (application profile). If a matching rule is found, the traffic will be redirected to the specified routing instance for the route lookup. If matching rule is not found, it undergoes normal processing (non-APBR route) (see step 6).
Step 5: Traffic is routed through the specified routing instance for the destination. Step 6: Traffic traverses through a default route (non-APBR route) to the destination.
For a new session, when application cannot be identified based on first packet information the traffic traverses through a default route (non-APBR route) to the destination. At the same time, APBR is applied and the rest of the session packets passes through the route as per the rules defined in the APBR profile. This means that, APBR rules are applied as and when an application is identified by AppID. For first packet of session, always go through midstream re-routing case. That is, when the application is not yet identified, the traffic traverses through a default route (non-APBR route) to the destination. At the same time, application identification is enabled for that session. This continues still application signatures identify the application and APBR is applied and the rest of the session packets passes through the route as per the rules defined in the APBR profile. The traffic traverses through a non-APBR route till application signatures or ALG identify the application.
You can enable, AppTrack to inspect traffic and collect statistics for application flows in the specified zone. See Understanding AppTrack for more details.
Advanced Policy-Based Routing Options For Streamlining Traffic Handling
You can streamline the traffic handling with APBR by using the following options:
-
Limit route change- Some sessions go through continuous classification in the middle of the session as application signatures identify the application. Whenever an application is identified by the application signatures, APBR is applied, and this results in a change in the route of the traffic. You can limit the number of times a route can change for a session by using the max-route-change option of the tunables statement.
set security advance-policy-based-routing tunables max-route-change value
Example:
[edit]
set security advance-policy-based-routing tunables max-route-change 5
In this example, you want to limit the number of route changes per session to 5. When there is a change in the route in the middle of the session, this count is reduced to 4. This process continues until the count reaches 0. After that, APBR is not applied in the middle of the session.
If an identified application has an entry in the ASC, then, the count is not reduced for that session, because the session started with the specified route according to the APBR configuration.
-
Terminate session if APBR is bypassed–You can terminate the session if there is a mismatch between zones when APBR is being applied in the middle of the session. When you want to apply APBR in the middle of a session, both new egress interface and existing egress interface must be part of the same zone. If you change the zone for an interface in the middle of a session, then, by default, APBR is not applied, and the traffic continues to traverse through the existing interface. To change this default behavior, you can terminate the session entirely, instead of allowing traffic to traverse through the same route bypassing APBR, by using the drop-on-zone-mismatch option of the tunables statement.
Example:
[edit]
set security advance-policy-based-routing tunables drop-on-zone-mismatch
-
Enable logging—You can enable logging to record events that occur on the device, for instance, when APBR is bypassed because of a change in the zones for interfaces. You can use the enable-logging option of the tunables statement to configure the logging.
Example:
[edit]
set security advance-policy-based-routing tunables enable-logging
-
Enable reverse reroute—For deployments that require traffic symmetry for ECMP routes, and the incoming traffic needs to switch in the middle of session, the rerouting can be achieved using the option enable-reverse-reroute specific to a security zone as follows:
Example:
[edit]
set security zones security-zone zone-name enable-reverse-reroute
When the above configuration is enabled for a security zone, where an incoming packet arrives on an interface and has a different outgoing/return interface, a change in the interface is detected and triggers a reroute. A route lookup is performed for the reverse path, and the preference will be given to the interface on which the packet has arrived.
Further processing stops for a particular session when a route lookup fails for the traffic on reverse path.
Use Case
-
When multiple ISP links are used:
-
APBR can be used for selecting high-bandwidth, low-latency links for important applications, when more than one link is available.
-
APBR can be used for creating a fallback link for important traffic in case of link failure. When multiple links are available, and the main link carrying the important application traffic suffers an outage, then the other link configured as the fallback link can be used to carry traffic.
-
APBR can be used for segregating the traffic for deep inspection or analysis. With this feature, you can classify the traffic based on applications that are required to go through deep inspection and audit. If required, such traffic can be routed to a different device.
-
Limitations
APBR has the following limitations:
-
APBR does not work if an application signature package is not installed or application identification is not enabled.
-
APBR does not work for Layer 3 and Layer 4 applications, because the Layer 3 and Layer 4 applications custom signatures are not maintained in the ASC.
APBR with midstream support has the following limitations:
-
APBR works only for forward traffic.
-
APBR does not work for data sessions initiated by an entity from the control session, such as active FTP.
-
When using different NAT pools for source NAT and midstream APBR is applied, the source IP address of the session continues to be the same as the one with which the session has been using before applying the midstream APBR.
-
APBR with midstream support works only when all egress interfaces are in the same zone. Because of this, only the forwarding and virtual routing and forwarding (VRF) routing instances can be used to avail APBR midstream support.
Example: Configuring Advanced Policy-Based Routing for Application-Aware Traffic Management Solution
This example shows how to configure APBR on an NFX Series device.
Requirements
This example uses the following hardware and software components:
-
Valid application identification feature license installed on an NFX Series device.
-
NFX150 device with Junos OS Release 18.2 or later.
Overview
In this example, you want to forward HTTP, social networking, and Yahoo traffic arriving at the trust zone to a specific device or interface as specified by the next-hop IP address.
When traffic arrives at the trust zone, it is matched by the APBR profile, and if a matching rule is found, the packets are forwarded to the static route and next hop as specified in the routing instance. The static route configured in the routing table is inserted into the forwarding table when the next-hop address is reachable. All traffic destined for the static route is transmitted to the next-hop address for transit to a specific device or interface.
Figure 5 shows the topology used in this configuration example.
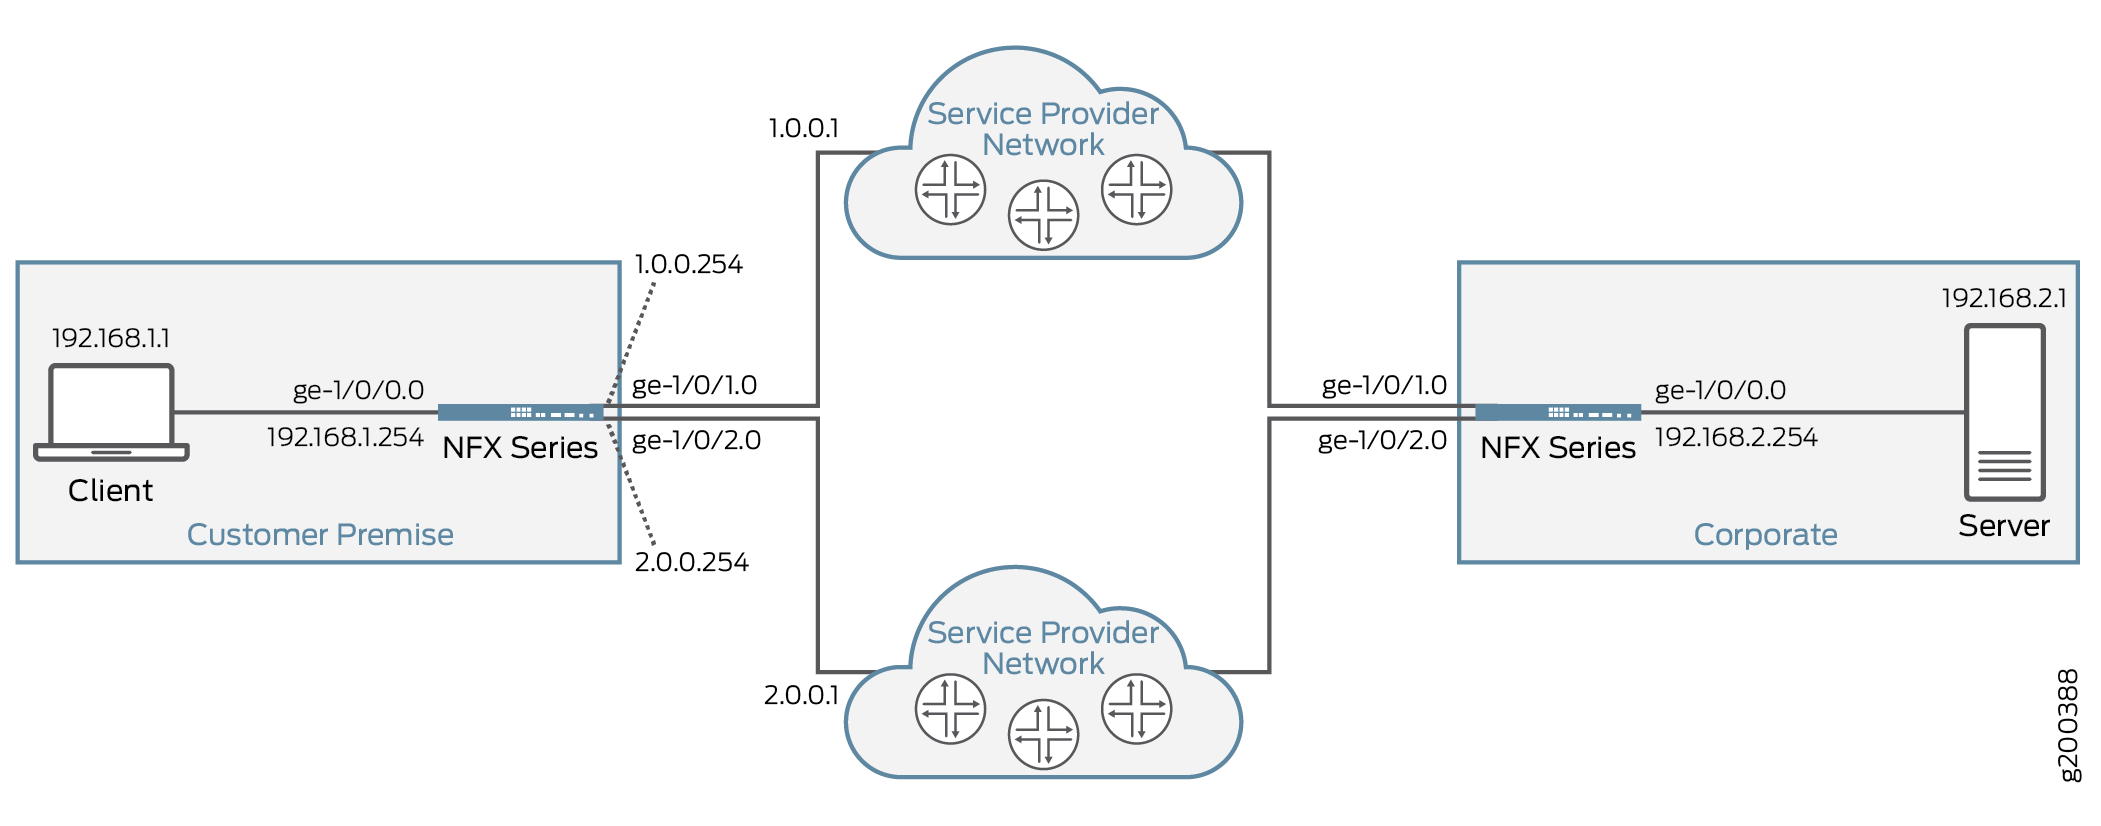
Table 2 provides the details of the parameters used in this example.
| Parameter | Name | Description |
|---|---|---|
|
Routing Instance |
|
Routing instance of type forwarding is used for forwarding the traffic. All the qualified traffic destined for the static route (example: 5.0.0.0/8) is forwarded to the next-hop device (example: with 7.0.0.1 address on its interface). |
|
||
|
RIB Group |
apbr_group |
Name of the routing information base (RIB) (also known as routing table) group. This RIB group is configured to import interface route entries from inet.0, RI1.inet.0, RI2.inet.0, and RI3.inet.0. |
|
APBR Profile |
profile-1 |
Name of the APBR profile. This profile matches applications and application groups and redirects the matching traffic to the specified routing instance (example: R1) for the route lookup. The profile includes multiple rules. |
|
Rule |
|
Define the rules for the APBR profile. Associate the rule with one or more than one application (example: for HTTP) or application groups. If the application matches any of the application or application groups of a rule in a profile, the application profile rule is considered as a match and the traffic will be redirected to the routing instance (example: R1) for the route lookup. |
|
||
|
Zone |
trust |
Specify the source zone to which the APBR profile can be applied. |
To use the APBR for redirecting the traffic based on applications, importing interface routes might be required from one routing instance to another routing instance. You can use one of the following mechanisms:
-
RIB groups to import interface routes
-
Routing policy to import interface routes
When you use routing policy to import interface routes, it might cause management local routes (using fxp0) to leak to non-default routing instance, if the appropriate action is not used for the routing policy. When devices are in chassis cluster mode, such scenarios might result in RG0 failover due to limitations. We recommend not configure fxp0 local route in the routing table of non-default routing instance. Following sample depicts a sample configuration of policy options. Note that the reject action helps in eliminating the routes that are not required. You can use specific routes to reject the fxp0 routes.
policy-statement statement-name {
    term 1 {
        from {
            instance master;
            route-filter route-filter-ip-address exact;
        }
        then accept;
    }
    then reject;
}APBR is used for routing the packets in a forward path. For return traffic to arrive over the same path, we recommend to configure the remote NFX Series device with ECMP configuration along with load balance routing policy as shown in the following sample configuration:
user@host> set routing-options static route ip-address next-hop ip-address
user@host> set routing-options static route ip-address next-hop ip-address
user@host> set policy-options policy-statement load-balance-policy then load-balance per-packet
user@host> set routing-options forwarding-table export load-balance-policy
Configuration
CLI Quick Configuration
To quickly configure this example, copy the following commands, paste them into a text file, remove any line breaks, change any details necessary to match your network configuration, copy and paste the commands into the CLI at the [edit] hierarchy level, and then enter commit from configuration mode.
set routing-instances R1 instance-type forwarding
set routing-instances R1 routing-options static route 1.0.0.254/8 next-hop 1.0.0.1
set routing-instances R2 instance-type forwarding
set routing-instances R2 routing-options static route 2.0.0.254/8 next-hop 2.0.0.1
set routing-options interface-routes rib-group inet apbr_group
set routing-options rib-groups apbr_group import-rib inet.0
set routing-options rib-groups apbr_group import-rib RI1.inet.0
set routing-options rib-groups apbr_group import-rib RI2.inet.0
set security advance-policy-based-routing profile profile1 rule rule-app1 match dynamic-application junos:HTTP
set security advance-policy-based-routing profile profile1 rule rule-app1 then routing-instance R1
set security advance-policy-based-routing profile profile1 rule rule-app2 match dynamic-application-group junos:web:social-networking
set security advance-policy-based-routing profile profile1 rule rule-app2 then routing-instance R2
set security zones security-zone trust host-inbound-traffic system-services all
set security zones security-zone trust host-inbound-traffic protocols all
set security zones security-zone trust interfaces ge-1/0/1.0
set security zones security-zone trust interfaces ge-1/0/2.0
set security zones security-zone trust advance-policy-based-routing-profile profile1
Configuring Advanced Policy-Based Routing
Step-by-Step Procedure
To configure APBR:
Create routing instances.
[edit]
user@host# set routing-instances R1 instance-type forwarding
user@host# set routing-instances R1 routing-options static route 1.0.0.254/8 next-hop 1.0.0.1
user@host# set routing-instances R2 instance-type forwarding
user@host# set routing-instances R2 routing-options static route 2.0.0.254/8 next-hop 2.0.0.1
Group one or more routing tables to form a RIB group called apbr_group and import routes into the routing tables.
[edit]
set routing-options interface-routes rib-group inet apbr_group
set routing-options rib-groups apbr_group import-rib inet.0
set routing-options rib-groups apbr_group import-rib RI1.inet.0
set routing-options rib-groups apbr_group import-rib RI2.inet.0
Create the APBR profile and define the rules.
[edit]
user@host# set security advance-policy-based-routing profile profile1 rule rule-app1 match dynamic-application junos:HTTP
user@host# set security advance-policy-based-routing profile profile1 rule rule-app1 then routing-instance R1
user@host# set security advance-policy-based-routing profile profile1 rule rule-app2 match dynamic-application-group junos:web:social-networking
user@host# set security advance-policy-based-routing profile profile1 rule rule-app2 then routing-instance R2
Apply the APBR profile to the security zone.
[edit]
user@host# set security zones security-zone trust host-inbound-traffic system-services all
user@host# set security zones security-zone trust host-inbound-traffic protocols all
user@host# set security zones security-zone trust interfaces ge-1/0/1.0
user@host# set security zones security-zone trust interfaces ge-1/0/2.0
user@host# set security zones security-zone trust advance-policy-based-routing-profile profile1
Results
From configuration mode, confirm your configuration by entering the show routing-instances and show security zones commands. If the output does not display the intended configuration, repeat the configuration instructions in this example to correct it.
[edit]
user@host# show routing-instances
R1 {
    instance-type forwarding;
    routing-options {
        static {
            route 1.0.0.254/8 next-hop 1.0.0.1;
        }
    }
}
R2 {
    instance-type forwarding;
    routing-options {
        static {
            route 2.0.0.254/8 next-hop 2.0.0.1;
        }
    }
}[edit]
user@host# show routing-options
interface-routes {
rib-group inet apbr_group;
}
rib-groups {
apbr_group {
import-rib [ inet.0 RI1.inet.0 RI2.inet.0 ];
}
}[edit]
user@host# show security advance-policy-based-routing
profile profile1 {
rule rule-app1 {
match {
dynamic-application junos:HTTP;
}
then {
routing-instance R1;
}
}
rule rule-app2 {
match {
dynamic-application-group junos:web:social-networking;
}
then {
routing-instance R2;
}
}
}[edit]
user@host# show security zones
security-zone trust {
host-inbound-traffic {
system-services {
all;
}
protocols {
all;
}
}
interfaces {
ge-1/0/1.0;
ge-1/0/2.0;
}
advance-policy-based-routing-profile {
profile1;
}
}If you are done configuring the device, enter commit from configuration mode.
Verification
- Verifying Advanced Policy-Based Routing Statistics
- Verifying Advanced Policy-Based Routing
- Verifying Advanced Policy-Based Routing
Verifying Advanced Policy-Based Routing Statistics
Purpose
Display the statistics for APBR such as the number of sessions processed for the application-based routing, number of times the APBR is applied for the session, and so on.
Action
From configuration mode, enter the show security advance-policy-based-routing statistics command.
Advance Profile Based Routing statistics:
  Session Processed:                     5529
  ASC Success:                           3113
  Rule match success:                    107
  Route  modified:                       107
  AppID Requested:                       2416
Meaning
The command output displays the following details:
-
Sessions processed for the application-based routing.
-
The number of times the application traffic matches the APBR profile and APBR is applied for the session.
-
The number of times AppID was consulted to identify application traffic.
See show security advance-policy-based-routing statistics for more details.
Verifying Advanced Policy-Based Routing
Purpose
Display the statistics for APBR such as the number of sessions processed for the application-based routing, number of times the APBR is applied for the session, and so on.
Action
From configuration mode, enter the show security advance-policy-based-routing statistics command.
Advance Profile Based Routing statistics:
  Session Processed:                     5529
  ASC Success:                           3113
  Rule match success:                    107
  Route  modified:                       107
  AppID Requested:                       2416
Meaning
The command output displays the following details:
-
Sessions processed for the application-based routing.
-
The number of times the application traffic matches the APBR profile and APBR is applied for the session.
-
The number of times AppID was consulted to identify application traffic.
See show security advance-policy-based-routing statistics for more details.
Verifying Advanced Policy-Based Routing
Purpose
Display information about the sessions and packet flows active on the device, including detailed information about specific sessions.
Action
From configuration mode, enter the show security flow session command to display information about all currently active security sessions on the device.
Session ID: 12, Policy name: policy1/4, Timeout: 1798, Valid
  In: 4.0.0.1/38228 --> 5.0.0.1/80;tcp, Conn Tag: 0x0, If: ge-1/0/0.0, Pkts: 5, Bytes: 388,
  Out: 5.0.0.1/80 --> 4.0.0.1/38228;tcp, Conn Tag: 0x0, If: ge-1/0/2.0, Pkts: 4, Bytes: 517,
Total sessions: 1
Meaning
The command output displays the following details:
-
All active sessions and packet flows on your device
-
List of incoming and outgoing IP flows, including services
-
Security attributes associated with a flow, for example, the policies that apply to traffic belonging to that flow
-
Session timeout value, when the session became active, how long the session has been active, and if there is active traffic on the session
Configuring Advanced Policy-Based Routing Policies
You can configure advanced policy-based routing (APBR) policies by defining source addresses, destination addresses, and applications as match conditions; and after a successful match, the configured APBR profile is applied as an application services for the session. In the previous releases of Junos OS, an APBR profile could be attached to an incoming security zone of the ingress traffic, and the APBR was applied per security zone basis. Now, with support of APBR policies, you can apply different set of APBR rules on the traffic based on incoming security zone, source address, destination address and application
This enhancement provides more flexible traffic-handling capabilities that offer granular control for forwarding packets.
Supported match criteria includes source addresses, destination addresses, and applications. The applications can be used to support the matching condition based on protocol and Layer 4 ports.
If one or more APBR policy is configured for the security zone, then the policy is evaluated during session creating phase. The policy lookup is terminated once the policy, matching the session, is selected. After a successful match, the APBR profile configured with the APBR policy is used for the session.
How APBR Policy Works?
APBR policies are defined for a security zone. If there is one or more APBR policy associated with a zone, the session that is initiated from the security zone goes through the policy match.
The following sequences are involved in matching the traffic by an APBR policy and applying advanced policy-based routing to forward the traffic, based on the defined parameters/rules:
-
When traffic arrives at the ingress zone, it is matched by the APBR policy rules. The policy match condition include the source address, destination address and application.
-
When the traffic matches the security policy rules, the action of the APBR policy is applied to the traffic. You can enable APBR as an application service in the APBR policy action by specifying the APBR profile name.
-
The APBR profile configuration incudes the set of rules that contains set of dynamic applications and dyamic application groups as match condition. The action part of those rules contain the routing instance through which traffic needs to be forwarded. The routing instance can include configuration of static routs or dynamic learned routes.
-
All traffic destined for the static route is transmitted to the next-hop address for transit to a specific device or interface.
APBR policy rules are terminal, which means that once the traffic is matched by a policy, it is not processed further by the other policies.
If an APBR policy has the matching traffic and APBR profile does not have any traffic matching the rule, then the traffic matching the APBR policy traverses through a default routing-instance [inet0] to the destination.
Legacy APBR Profile Support
Prior to the Junos OS Release 18.2R1, APBR profile was applied at security zone-level. With the support for APBR policy, APBR configuration at security-zone level is deprecated future, rather than being immediately removed in order to provide backward compatibility and a chance to bring your configuration into compliance with the new configuration.
However, if you have configured a zone-based APBR, and you attempt to add an APBR policy for the particular security zone, commit might fail. You must delete the zone-based configuration in order to configure the APBR policy for the zone. Similarly if an APBR policy is configured for a security zone, and you attempt to configure zone-based APBR, results in commit error.
Limitation
When using specific address or address set in the APBR policy rule, we recommend to use the global address book. Because, zone specific rules might not be applicable for destination address, as the destination zone is not known at time of policy evaluation.
Configuring APBR policy for the security zone junos-host zone is not supported.
Example: Configuring Advanced Policy-Based Routing Policies
This example shows how configure an APBR policy and apply the APBR profile on the session that matches the APBR policy rules.
Requirements
This example uses the following hardware and software components:
-
Valid application identification feature license installed on an NFX Series device.
-
NFX Series device with Junos OS Release 18.2R1 or later. This configuration example is tested on Junos OS Release 18.2R1.
Overview
In this example, you want to forward HTTP traffic arriving at the trust zone to a specific device or interface as specified by the next-hop IP address.
When traffic arrives at the trust zone, it is matched by the APBR policy. When the traffic matches the policy, the configured APBR rule is applied on the permitted traffic as application services. The packets are forwarded based on the APBR rule to the static route and next hop as specified in the routing instance. The static route configured in the routing table is inserted into the forwarding table when the next-hop address is reachable. All traffic destined for the static route is transmitted to the next-hop address for transit to a specific device or interface.
In this example, you must complete the following configurations:
-
Define routing instance and RIB group.
-
Create an ABPR profile.
-
Create a security zone.
-
Create an APBR policy and attach the APBR profile to it.
Configuration
CLI Quick Configuration
To quickly configure this example, copy the following commands, paste them into a text file, remove any line breaks, change any details necessary to match your network configuration, copy and paste the commands into the CLI at the [edit] hierarchy level, and then enter commit from configuration mode.
set routing-instances R1 instance-type forwarding
set routing-instances R1 routing-options static route 5.0.0.0/24 next-hop 3.0.0.2
set routing-options interface-routes rib-group inet fbf-group
set routing-options rib-groups fbf-group import-rib inet.0
set routing-options rib-groups fbf-group import-rib RI1.inet.0
set security advance-policy-based-routing profile profile1 rule rule-app1 match dynamic-application junos:HTTP
set security advance-policy-based-routing profile profile1 rule rule-app1 then routing-instance R1
set security zones security-zone trust host-inbound-traffic system-services all
set security zones security-zone trust host-inbound-traffic protocols all
set security zones security-zone trust interfaces ge-1/0/1.0
set security advance-policy-based-routing from-zone trust policy SLA1 match source-address any
set security advance-policy-based-routing from-zone trust policy SLA1 match destination-address any
set security advance-policy-based-routing from-zone trust policy SLA1 match application any
set security advance-policy-based-routing from-zone trust policy SLA1 then application-services advance-policy-based-routing-profile profile1
Configuring Advanced Policy-Based Routing
Step-by-Step Procedure
To apply APBR on the traffic matching the APBR policy:
Create routing instances.
[edit]
user@host# set routing-instances R1 instance-type forwarding
user@host# set routing-instances R1 routing-options static route 5.0.0.0/24 next-hop 3.0.0.2
Group one or more routing tables to form a RIB group called apbr_group and import routes into the routing tables.
[edit]
user@host# set routing-options interface-routes rib-group inet fbf-group
user@host# set routing-options rib-groups fbf-group import-rib inet.0
user@host# set routing-options rib-groups fbf-group import-rib RI1.inet.0
Create the APBR profile and define the rules.
[edit]
user@host# set security advance-policy-based-routing profile profile1 rule rule-app1 match dynamic-application junos:HTTP
user@host# set security advance-policy-based-routing profile profile1 rule rule-app1 then routing-instance R1
Create a security zone.
[edit]
user@host# set security zones security-zone trust host-inbound-traffic system-services all
user@host# set security zones security-zone trust host-inbound-traffic protocols all
user@host# set security zones security-zone trust interfaces ge-1/0/1.0
Create an APBR policy and apply the APBR profile to the security zone.
[edit]
user@host# set security advance-policy-based-routing from-zone trust policy SLA1 match source-address any
user@host# set security advance-policy-based-routing from-zone trust policy SLA1 match destination-address any
user@host# set security advance-policy-based-routing from-zone trust policy SLA1 match application any
user@host# set security advance-policy-based-routing from-zone trust policy SLA1 then application-services advance-policy-based-routing-profile profile1
Results
From configuration mode, confirm your configuration by entering the show routing-instances and show security zones commands. If the output does not display the intended configuration, repeat the configuration instructions in this example to correct it.
[edit]
user@host# show routing-instances
R1 {
    instance-type forwarding;
    routing-options {
    0    static {
            route 5.0.0.0/24 next-hop 3.0.0.2;
        }
    }
}[edit]
user@host# show routing-options
interface-routes {
rib-group inet fbf_group;
}
rib-groups {
fbf_group {
import-rib [ inet.0 RI1.inet.0];
}
}[edit]
user@host# show security advance-policy-based-routing
from-zone trust {
policy SLA1 {
match {
source-address any;
destination-address any;
application any;
}
then {
application-services {
advanced-policy-based-routing-profile profile1;
}
}
}
}
profile profile1 {
rule rule-app1 {
match {
dynamic-application junos:HTTP;
}
then {
routing-instance R1;
}
}
}[edit]
user@host# show security zones
security-zone trust {
host-inbound-traffic {
system-services {
all;
}
protocols {
all;
}
}
interfaces {
ge-1/0/1.0;
}
}If you are done configuring the device, enter commit from configuration mode.
Verification
Verifying Advanced Policy-Based Routing Statistics
Purpose
Display the statistics for APBR such as the number of sessions processed for the application-based routing, number of times the APBR is applied for the session, and so on.
Action
From configuration mode, enter the show security advance-policy-based-routing statistics command.
Sessions Processed                     18994
  AppID cache hits                       18994
  AppID requested                        0
  Rule matches                           0
  Route changed on cache hits            0
  Route changed midstream                0
  Zone mismatch                          0
  Drop on zone mismatch                  0
  Next hop not found                     0
Meaning
Sessions Processed 18994 AppID cache hits 18994 AppID requested 0 Rule matches 0 Route changed on cache hits 0 Route changed midstream 0 Zone mismatch 0 Drop on zone mismatch 0 Next hop not found 0
Meaning
The command output displays the following details:
-
Sessions processed for the application-based routing.
-
The number of times the application traffic matches the APBR profile and APBR is applied for the session.
-
The number of times AppID was consulted to identify application traffic.
See show security advance-policy-based-routing statistics for more details.
Verifying APBR Policy Configuration
Purpose
Display information about the APBR policy, associated APBR profile and to display information about the APBR policy hit count.
Action
From configuration mode, enter the show security advanced-policy-based-routing command.
user@host> show security advanced-policy-based-routing
                                policy-name SLA1
From zone: trust
  Policy: SLA1, State: enabled, Index: 7, Sequence number: 1
    Source addresses: any
    Destination addresses: any
    Applications: any
    APBR profile: profile1
From configuration mode, enter the show security advanced-policy-based-routing hit-count command.
user@host>show security advanced-policy-based-routing
                                hit-count
Logical system: root-logical-system
 Index   From zone        Name           Hit count
 1       trust            SLA1          3
 2       trust            SLA2          0
 3       trust            SLA1          0

Number of policy: 3
Meaning
The command output displays the following details:
-
Details such as status of the policy, associated APBR profile.
-
Display the utility rate of policies according to the number of hits they receive.