ON THIS PAGE
Nodes (Active)
Active Nodes Overview
From the blueprint, navigate to Active > Physical > Nodes to go to nodes in the active topology. You can select which details to display in the table (from table settings). To see additional details (such as properties, tags and virtual) for a specific node, select it, then the right panel displays tabs with more information.
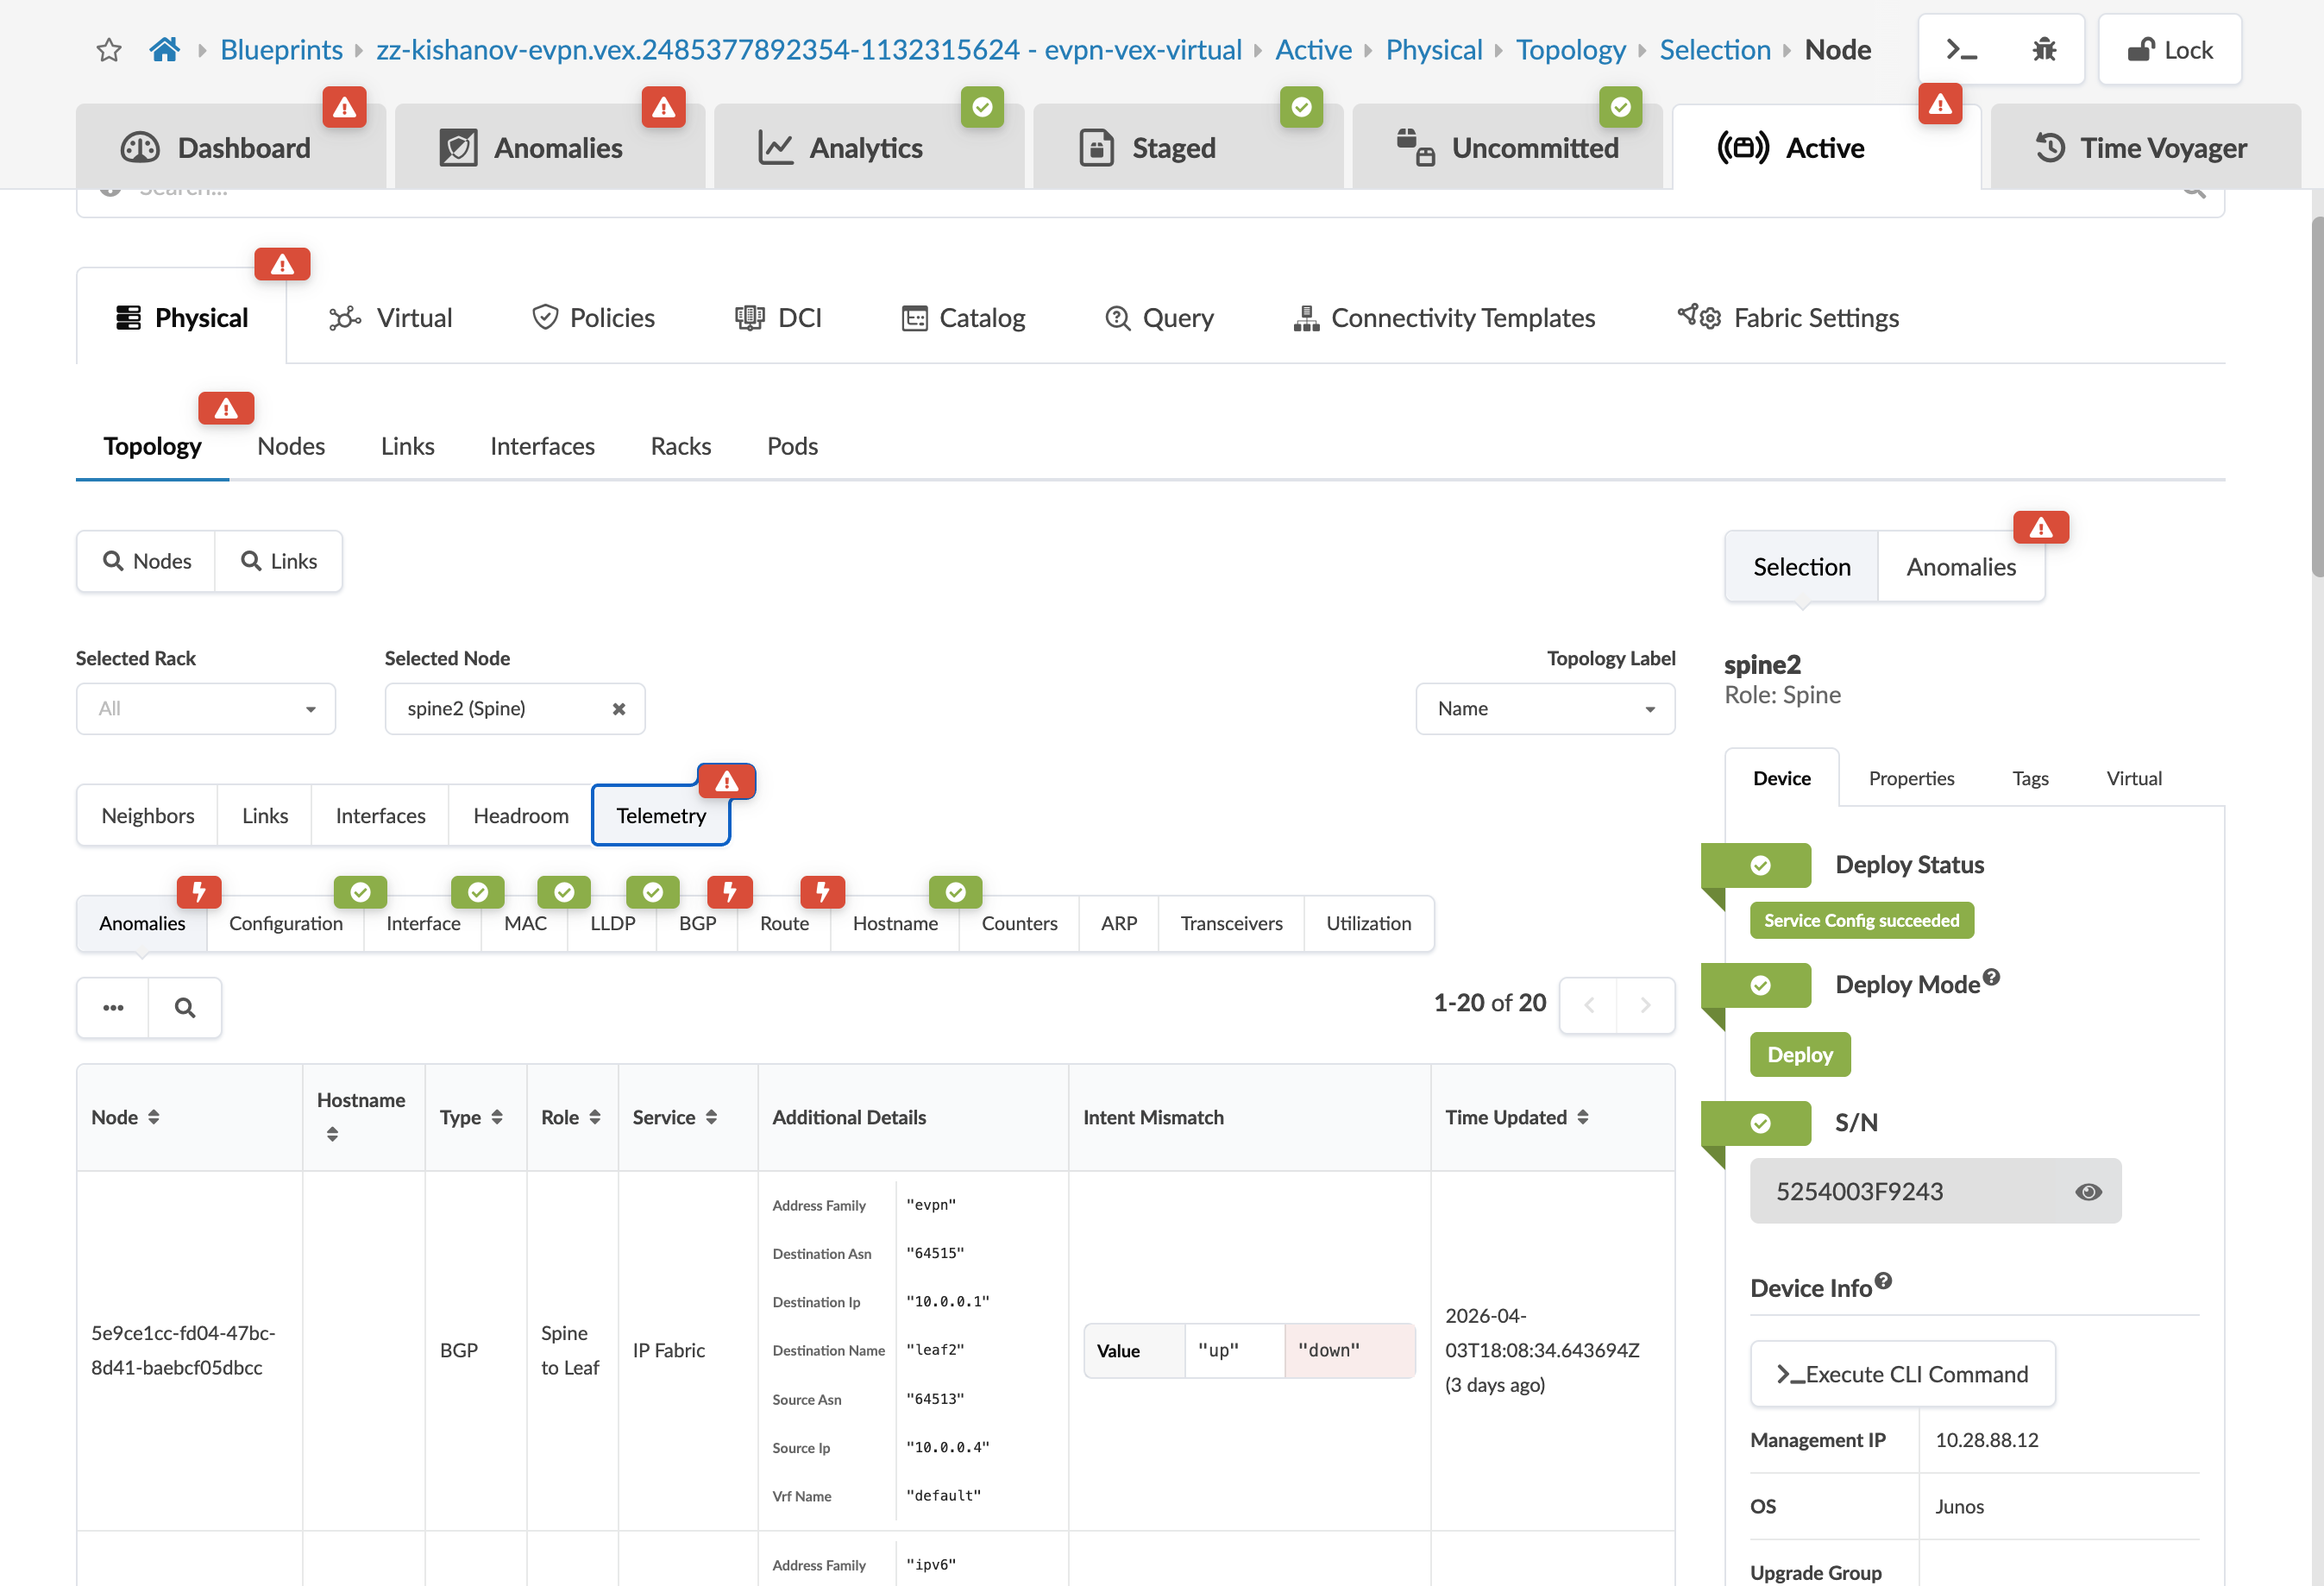
Device Telemetry data now appears in the Active Topology view when you select a device. Previously, Device Telemetry opened on the Managed Devices page. This enhancement lets you view telemetry data in the context of the fabric blueprint.
Apply Full Config
Applying a full config is a disruptive operation and results in a temporary loss of service to the device. For information about when to apply a full config, see Anomalies - Configuration Deviation.
- From the blueprint, navigate to Active > Physical > Nodes and select the device.
- From the selection panel (right-side) click Device, then click Rendered, Incremental, or Pristine to review the different configurations.
- Click Apply Full Config.