Headroom (Topology)

Note:

To see the headroom view, the Device Traffic probe must be enabled. If you disable or delete the probe, the traffic heat layer in the active topology is not available. For more information, see Device Traffic probe.
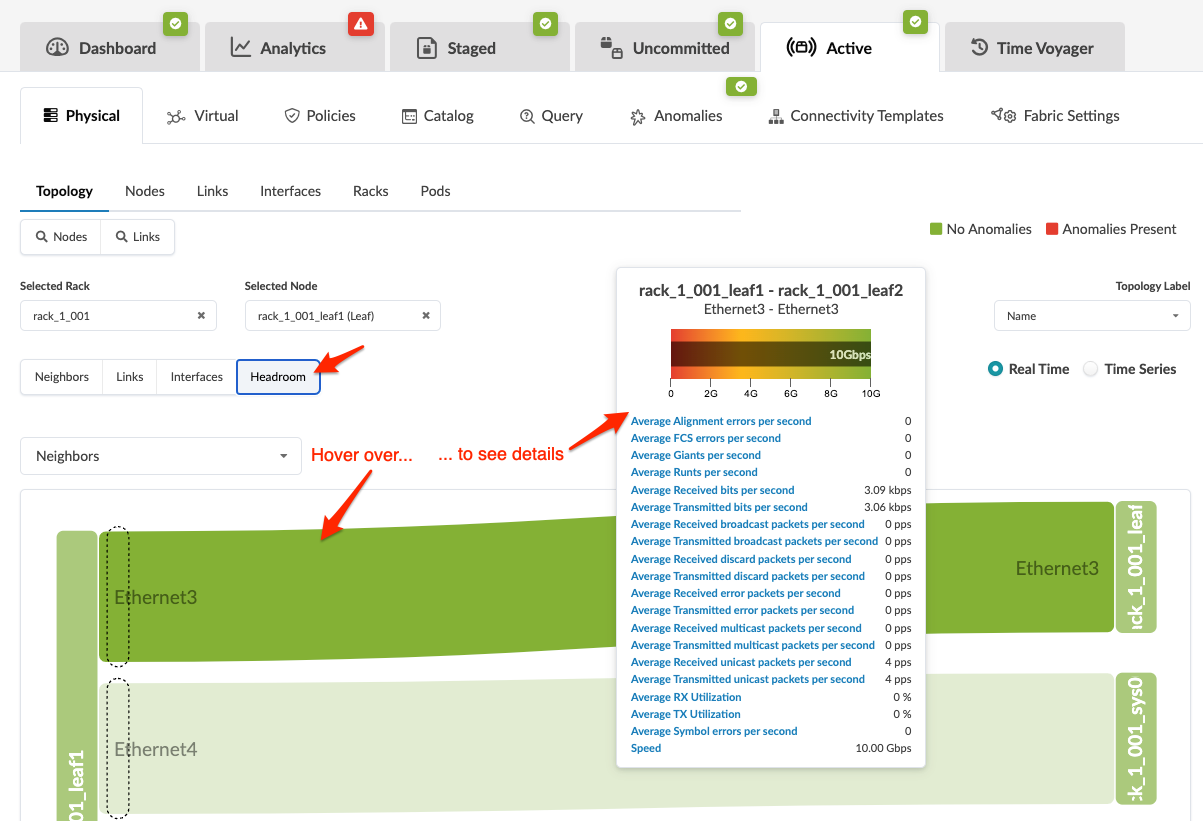
Network management interface showing tabs for Dashboard, Analytics, and Active views, Physical topology with selected rack and node, Headroom analysis highlighting links with no anomalies, real-time monitoring of network metrics.

To view traffic history on top of the physical topology from the headroom view, select Time Series .
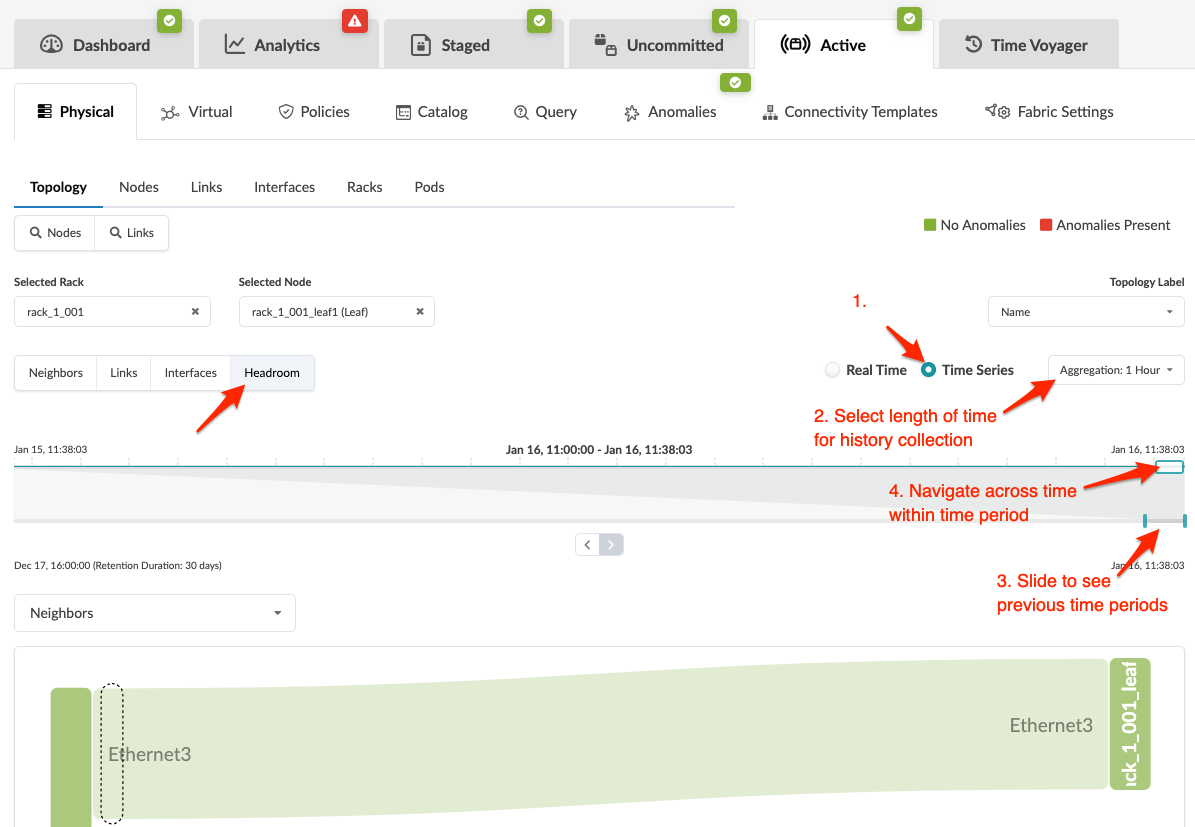
Network management interface showing physical topology view with selected rack rack_1_001 and node rack_1_001_leaf1 Leaf. Tabs include Dashboard, Analytics, Staged, Uncommitted, Active, and Time Voyager. Time slider enables real time and time series analysis. Headroom tab displays Ethernet connections with navigation options for time periods and neighbor devices. Red annotations explain usage features.