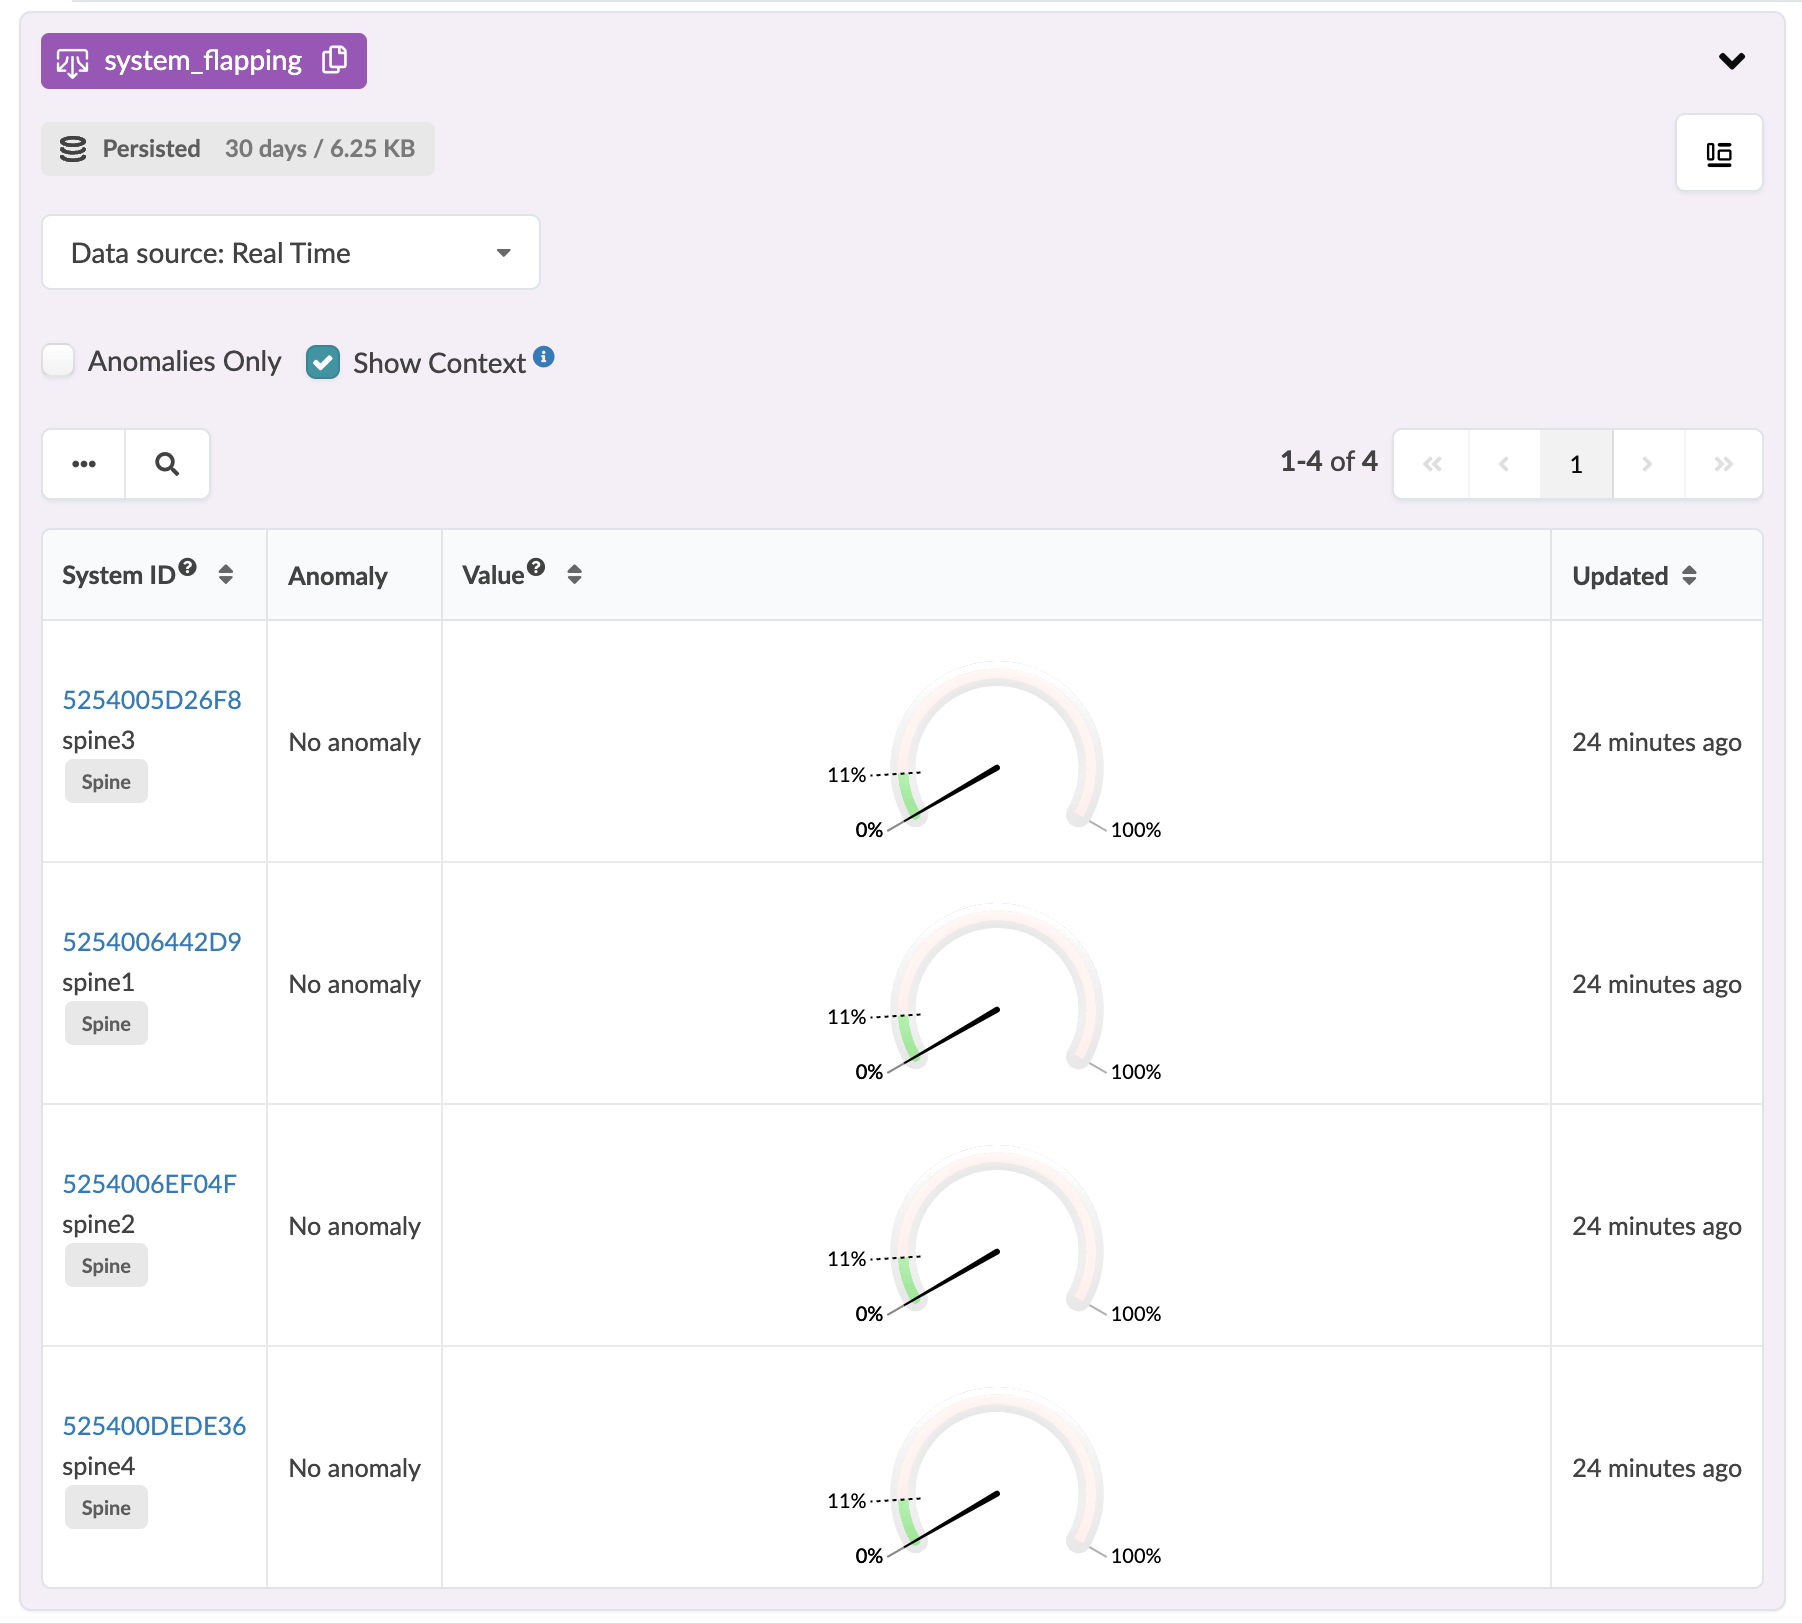
Interface Flapping (Spine to Superspine Interfaces) Probe
The Interface Flapping (Spine to Superspine Interfaces) probe determines if spine to superspine interfaces are flapping and raises anomalies accordingly.
Probe Overview
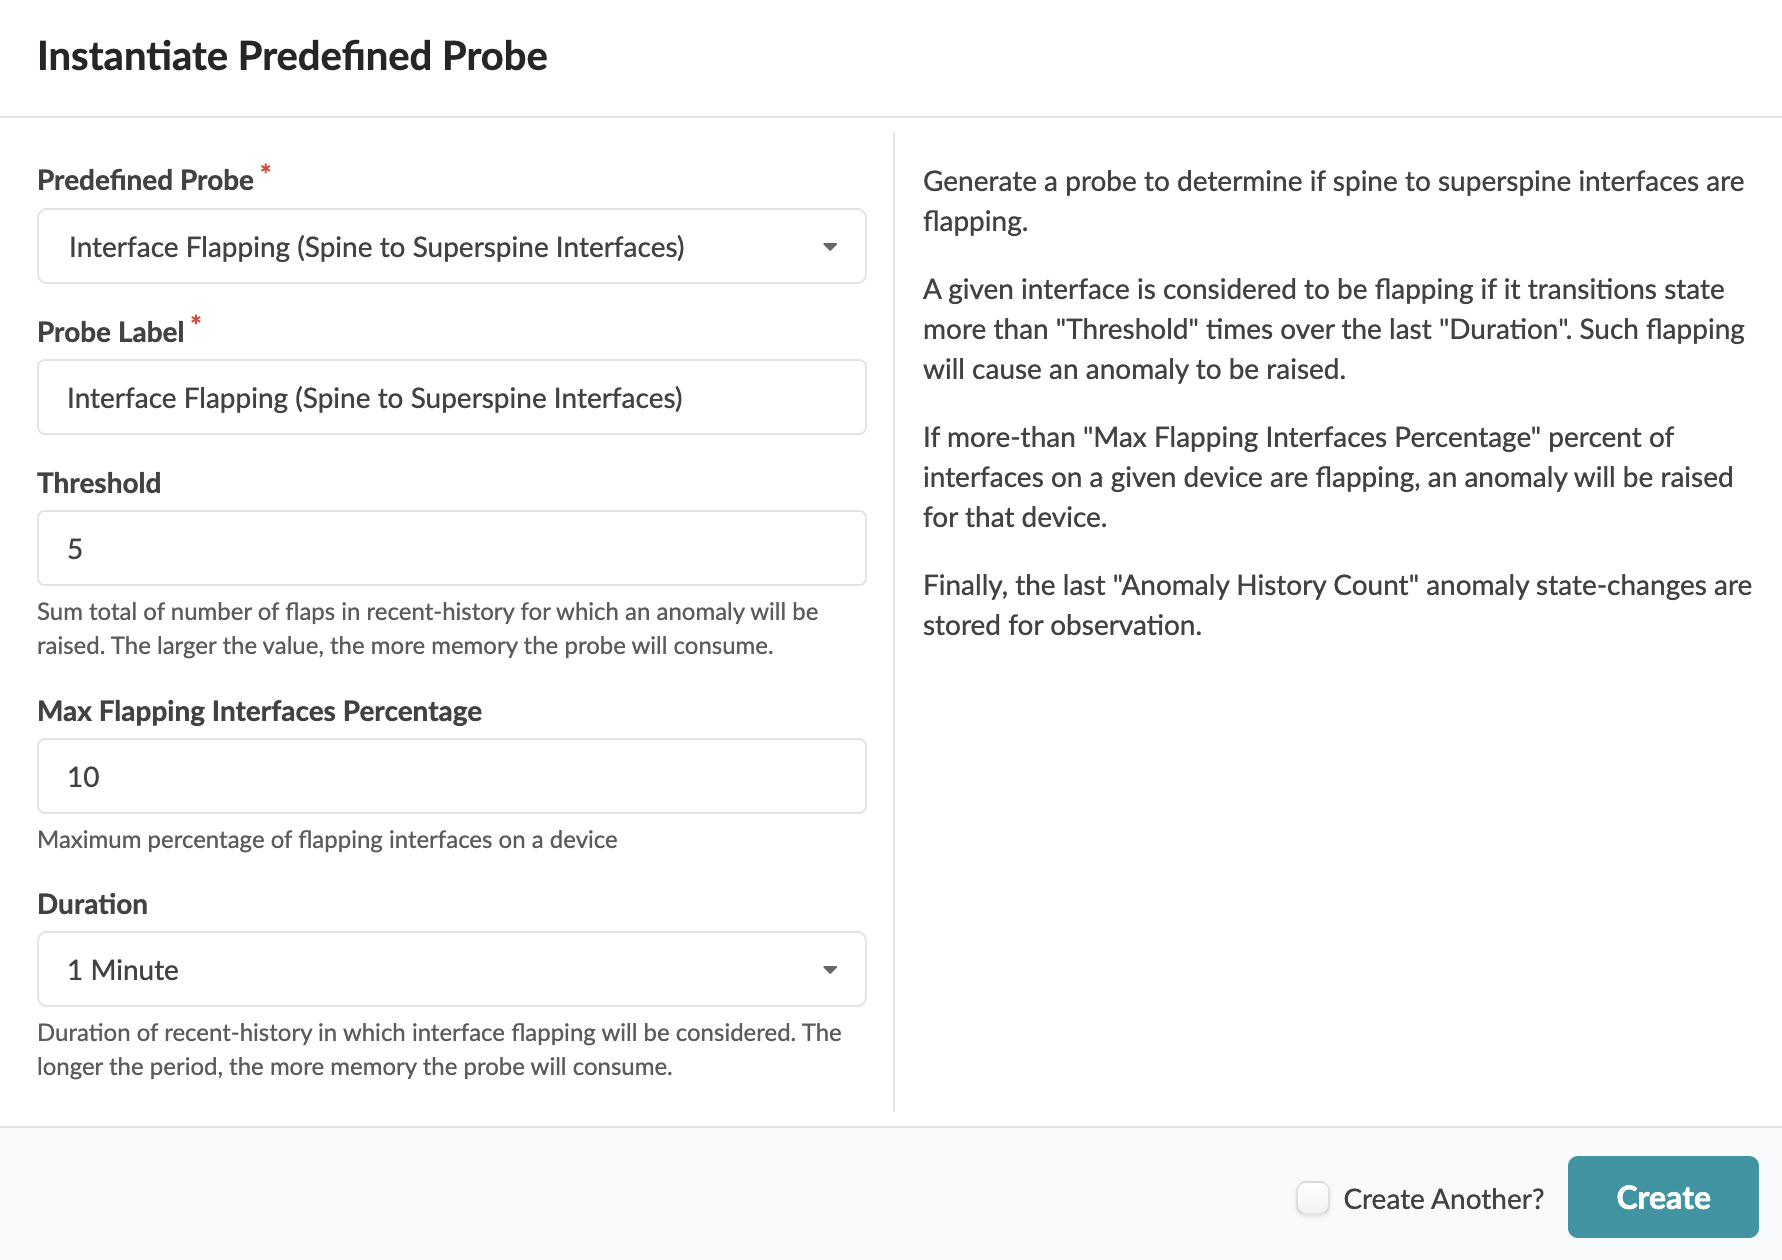
If the number of times that the operational state of any spine-to-superspine interface changes is greater than a specified number (Threshold) over a specified amount of time (Duration), then the interface is flapping and an anomaly is raised. Also, if the percentage of flapping interfaces exceeds the specified percentage (Max Flapping Interfaces Percentage), then an anomaly is raised for that device.
Probe Parameters
When you instantiate the predefined Interface Flapping (Spine to Superspine Interfaces) probe you can customize the above mentioned parameters or leave default values as is, as shown in the screenshot below.
Probe Stages
The following stages are used in the interface flapping probe for all spine to superspine interfaces:
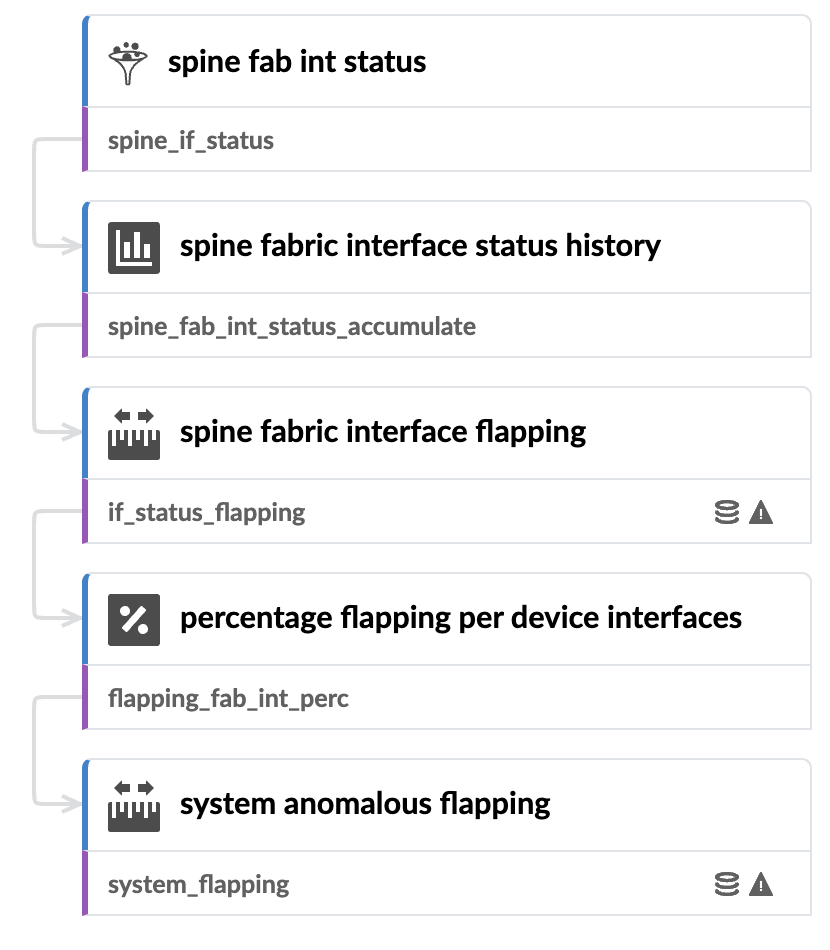
The sections below discuss the stages in detail.
Spine Fabric Interface Status Processor
Spine Fabric Interface Status Service Collector (Input)
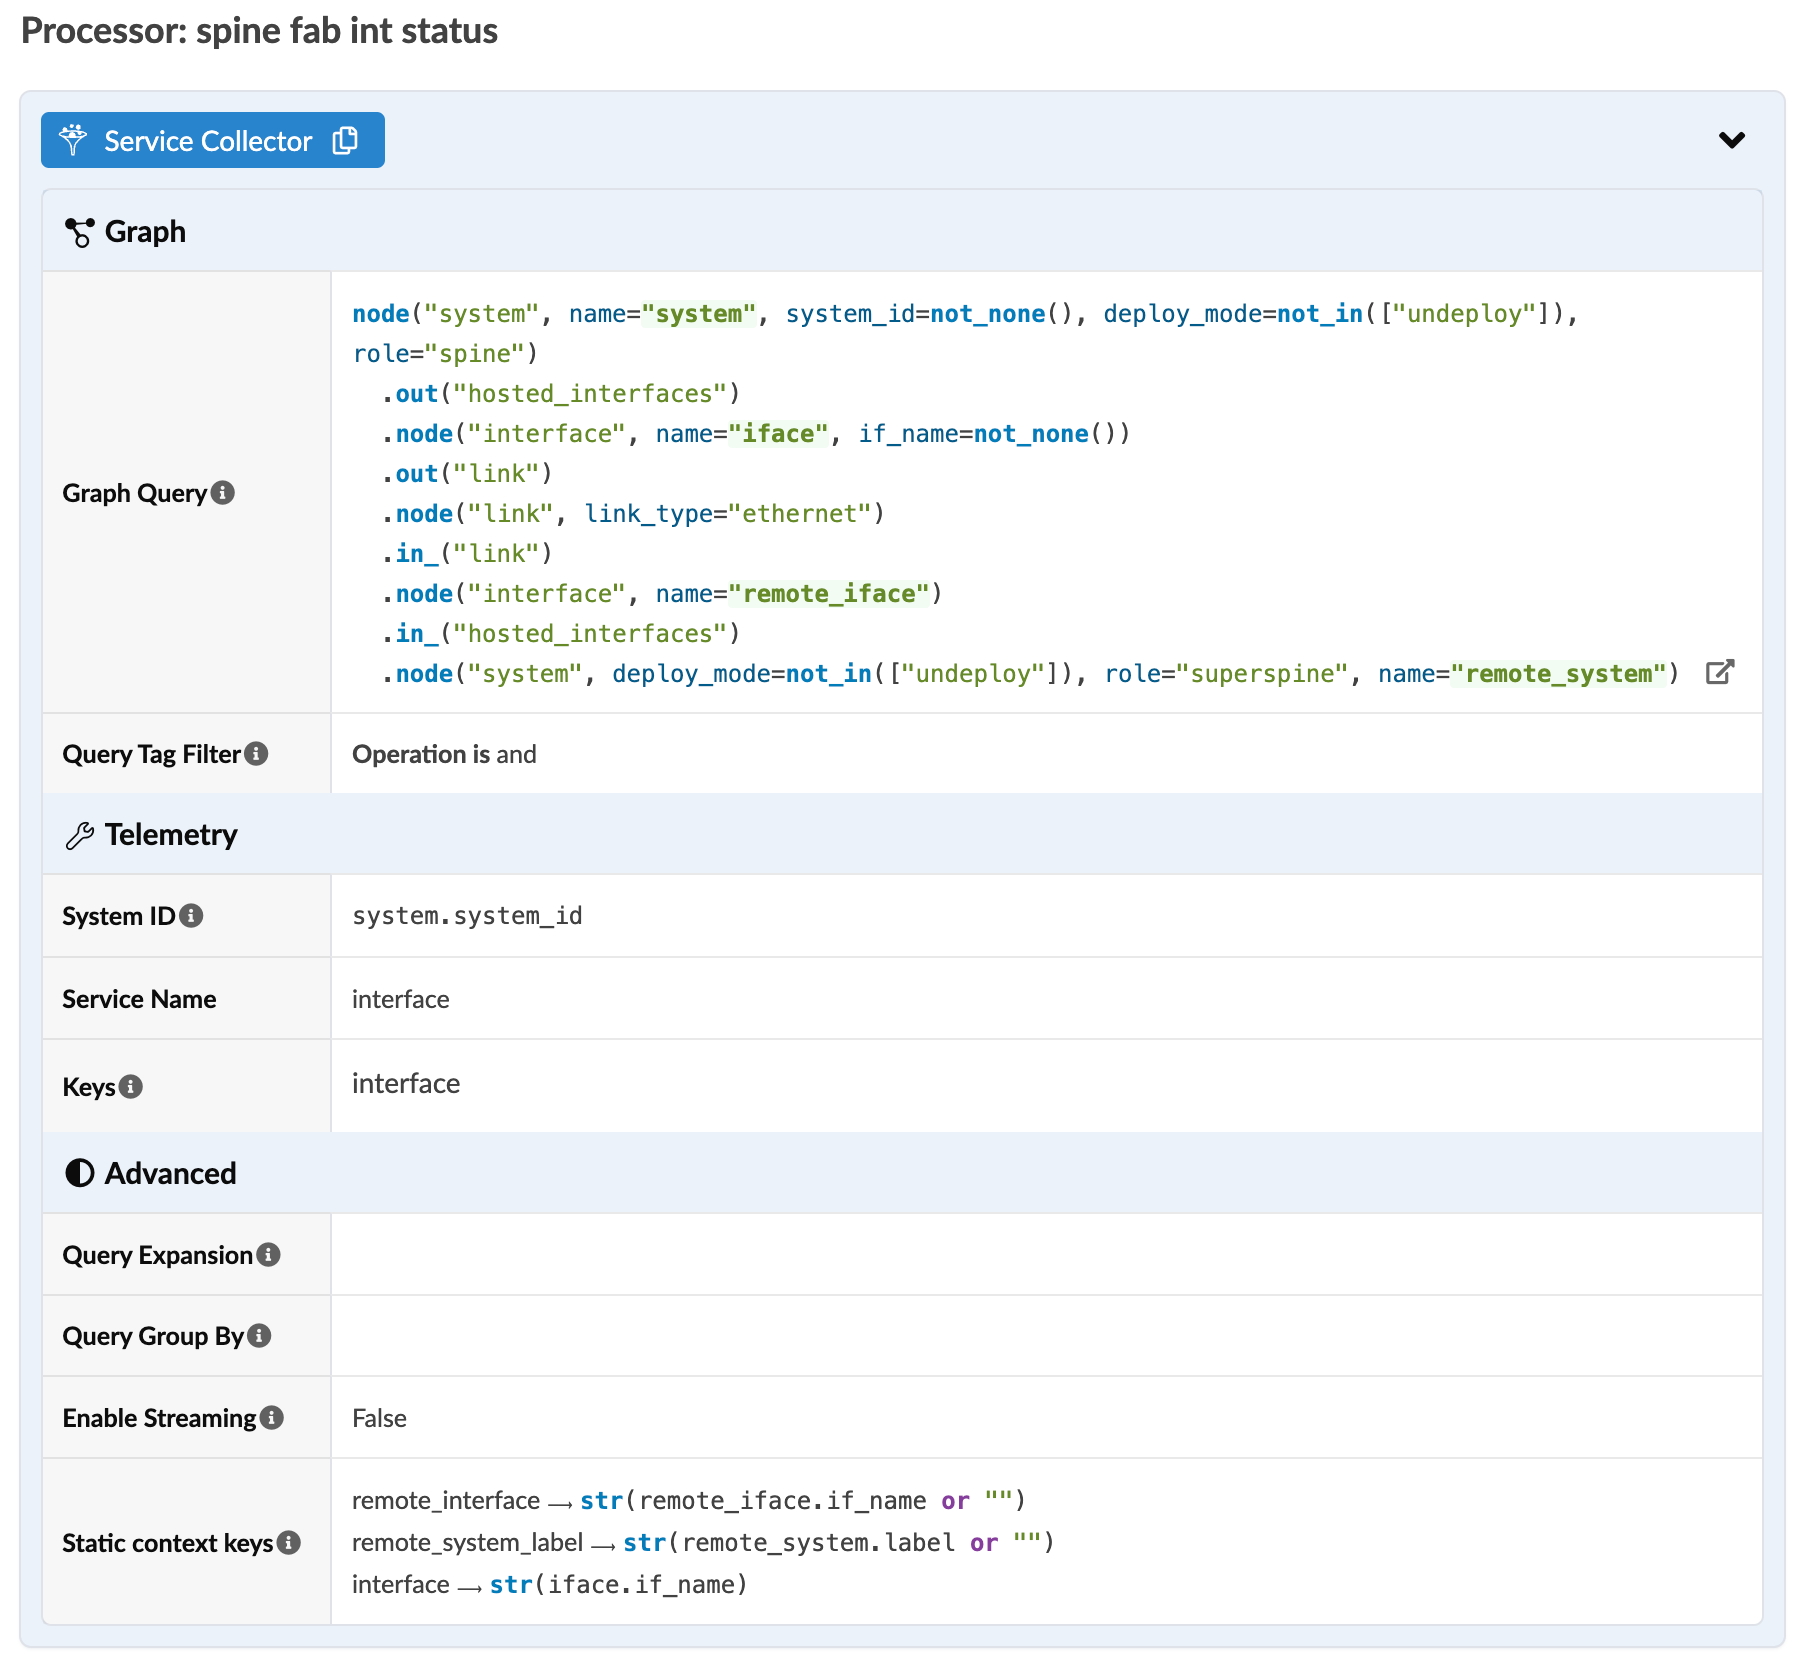
We begin with the source processor (no inputs), which is a Service Collector configured to collect interface status telemetry for all spine to superspine interfaces, as shown in the screenshot below.
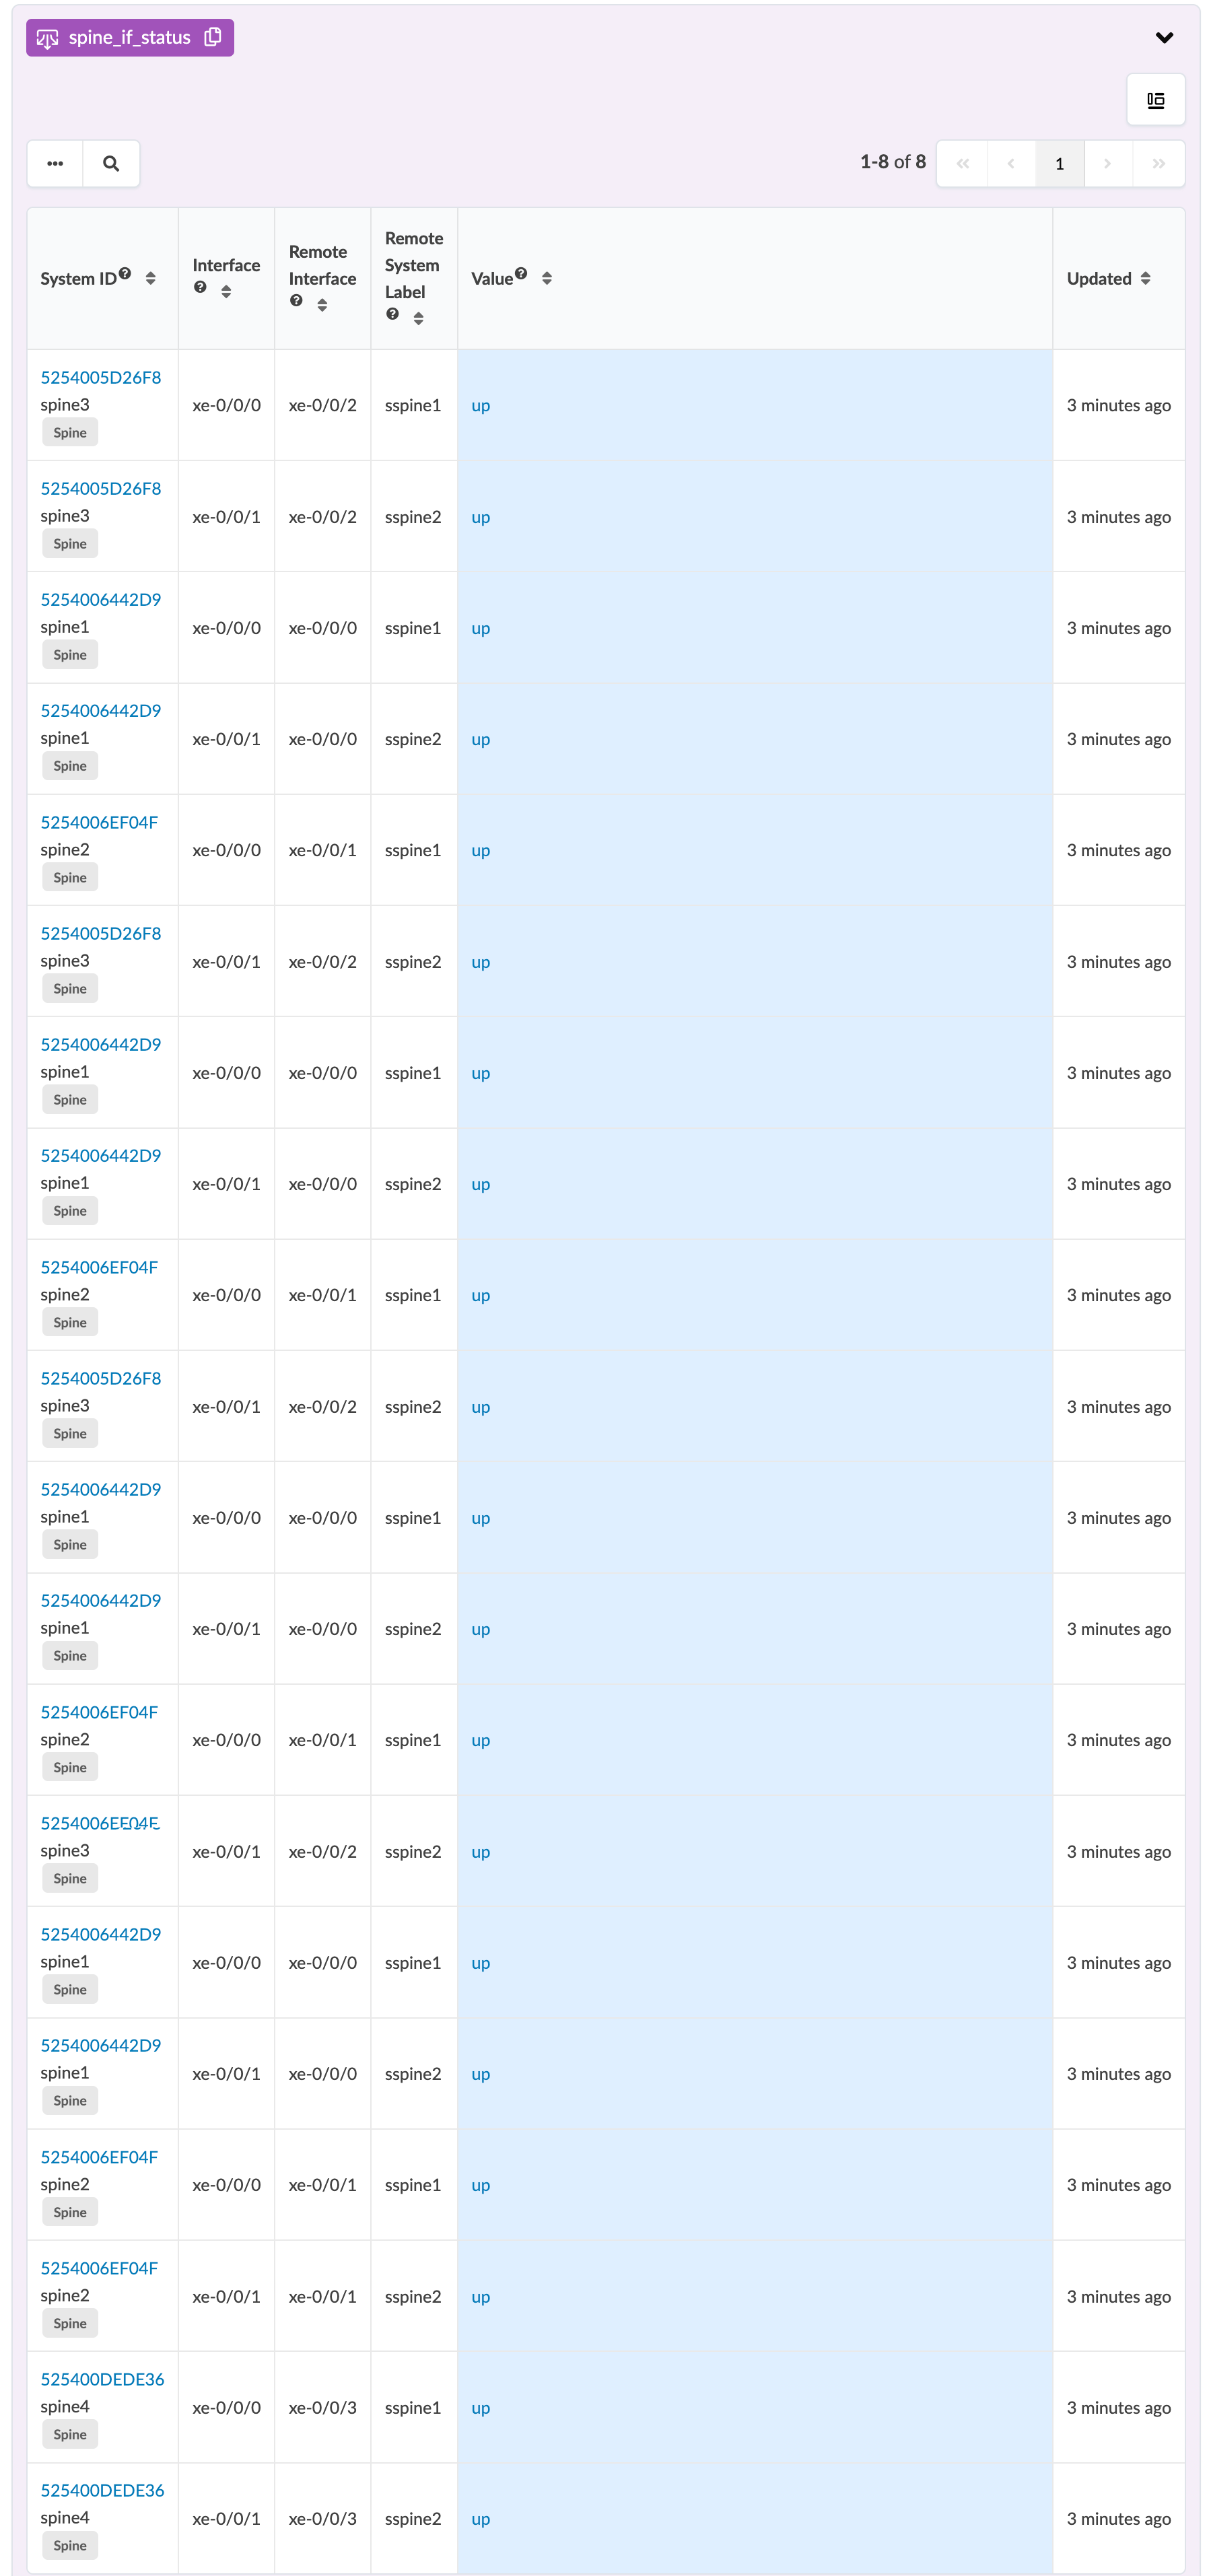
Spine Interface Status (Output)
The following screenshot is an example of the details that are collected from this processor.
Spine Fabric Interface Status History Processor
- Spine Fabric Interface Status History Accumulate (Input)
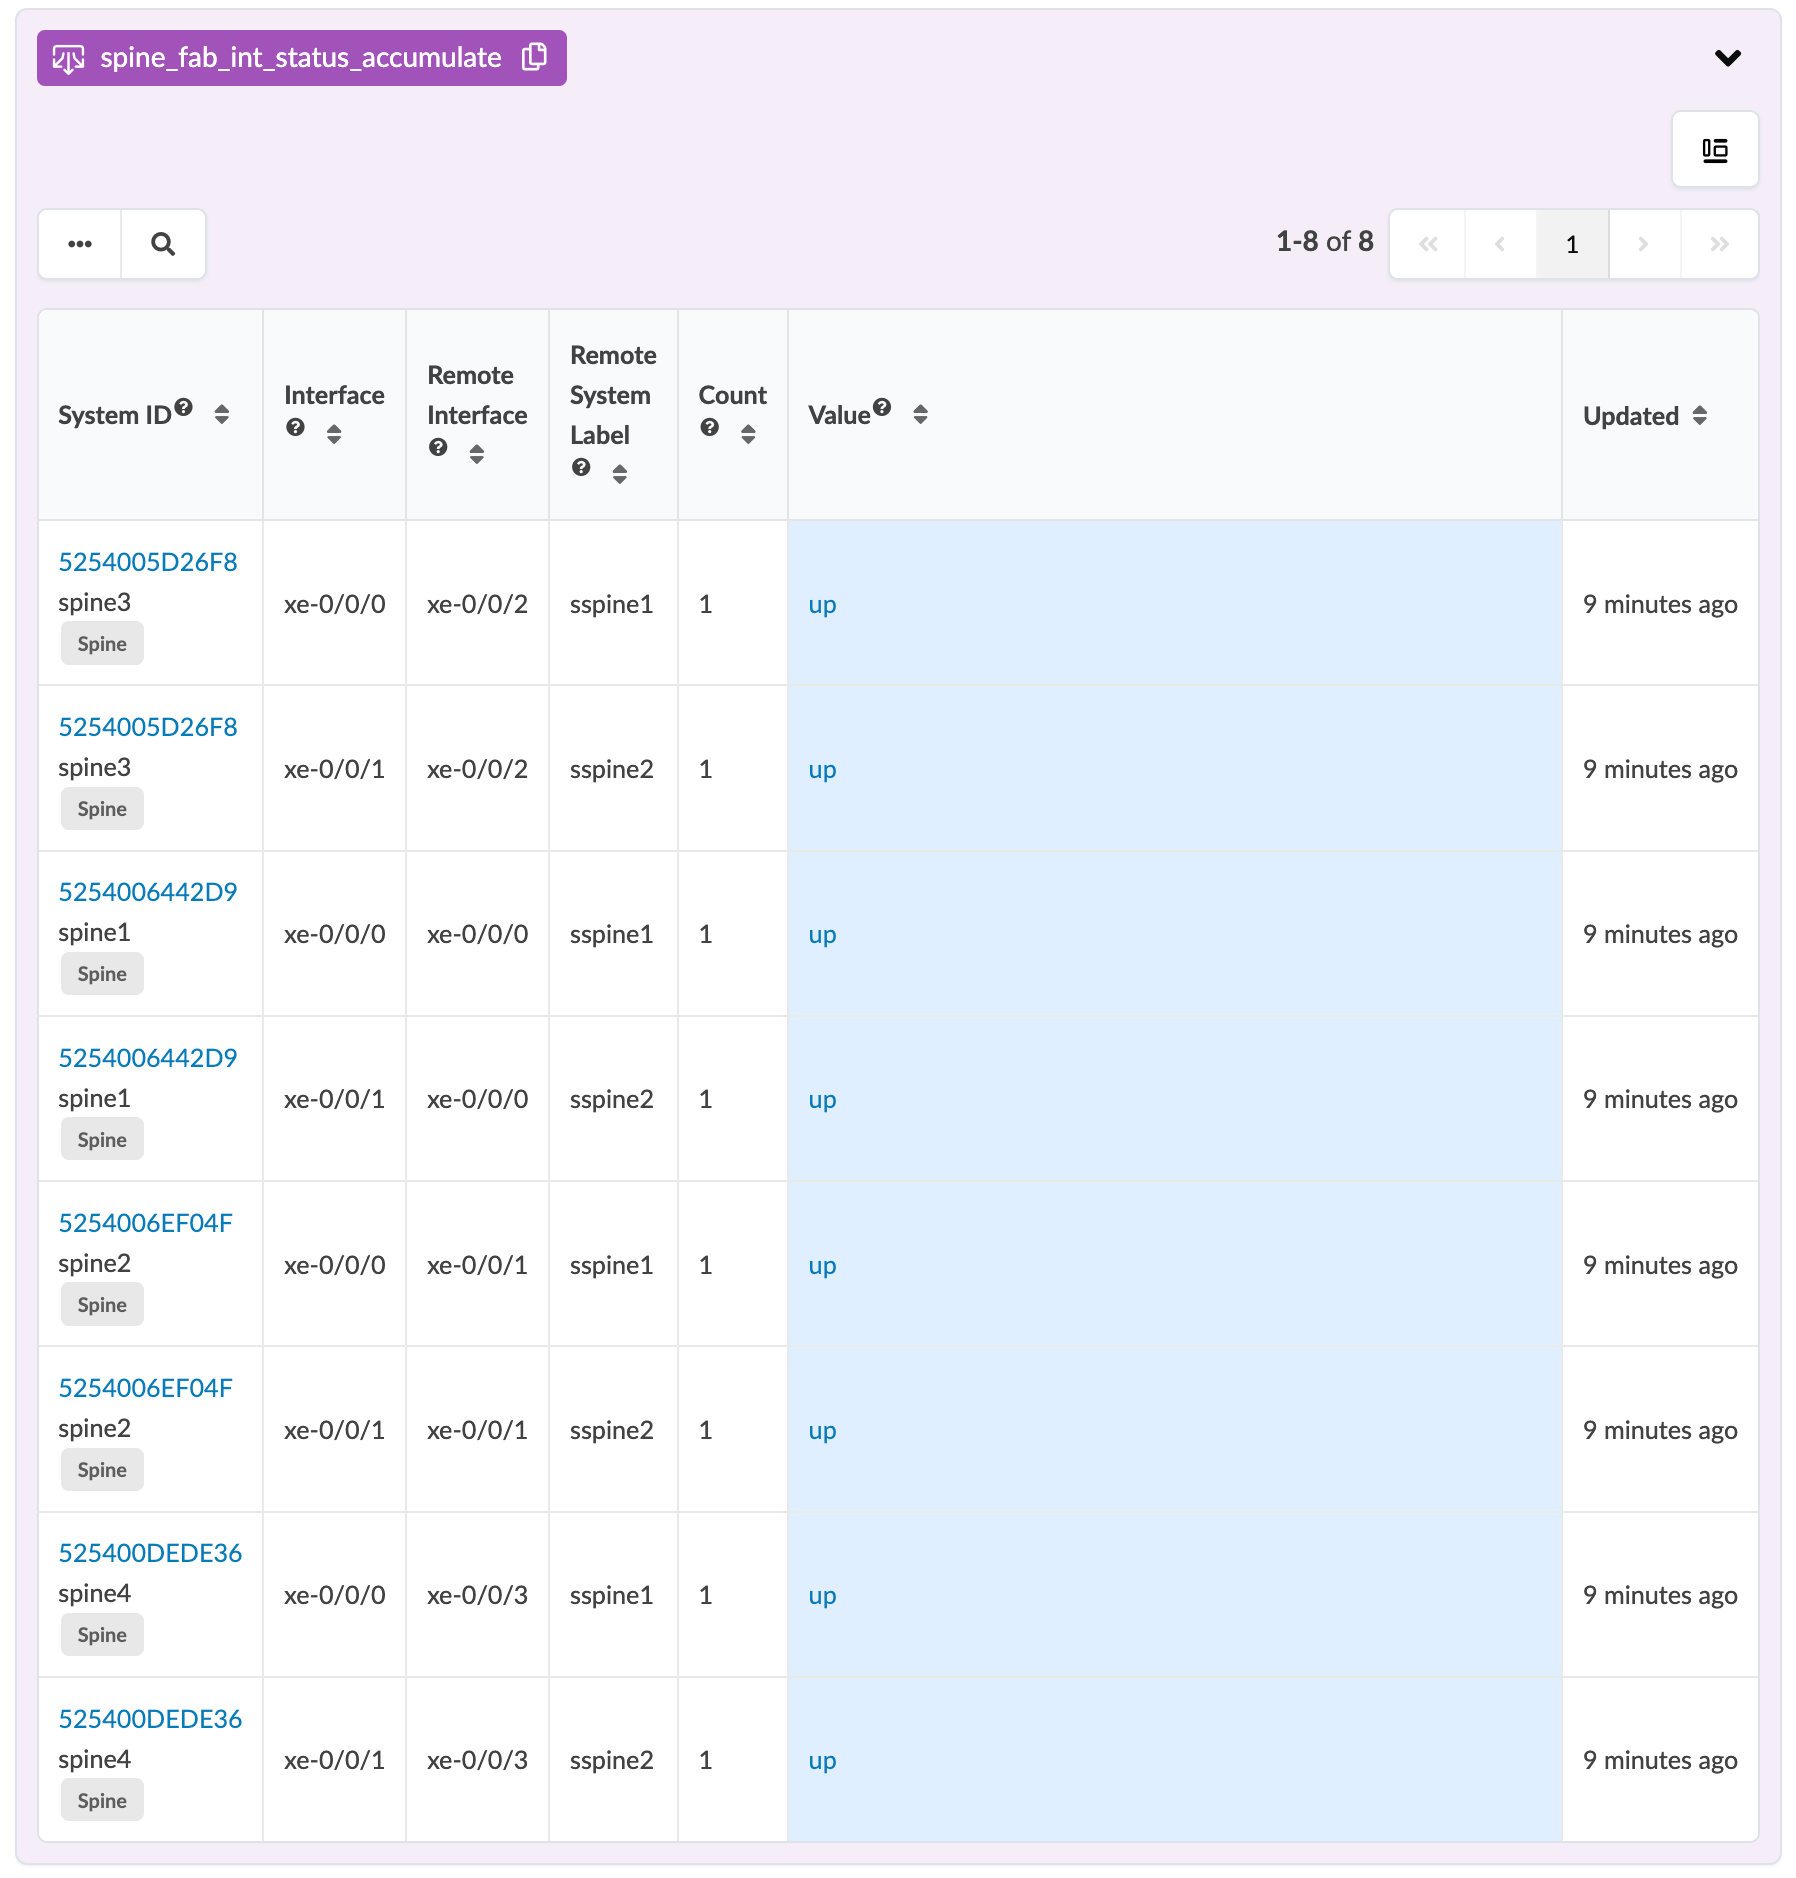
- Spine Fabric Interface Status Accumulate (Output)
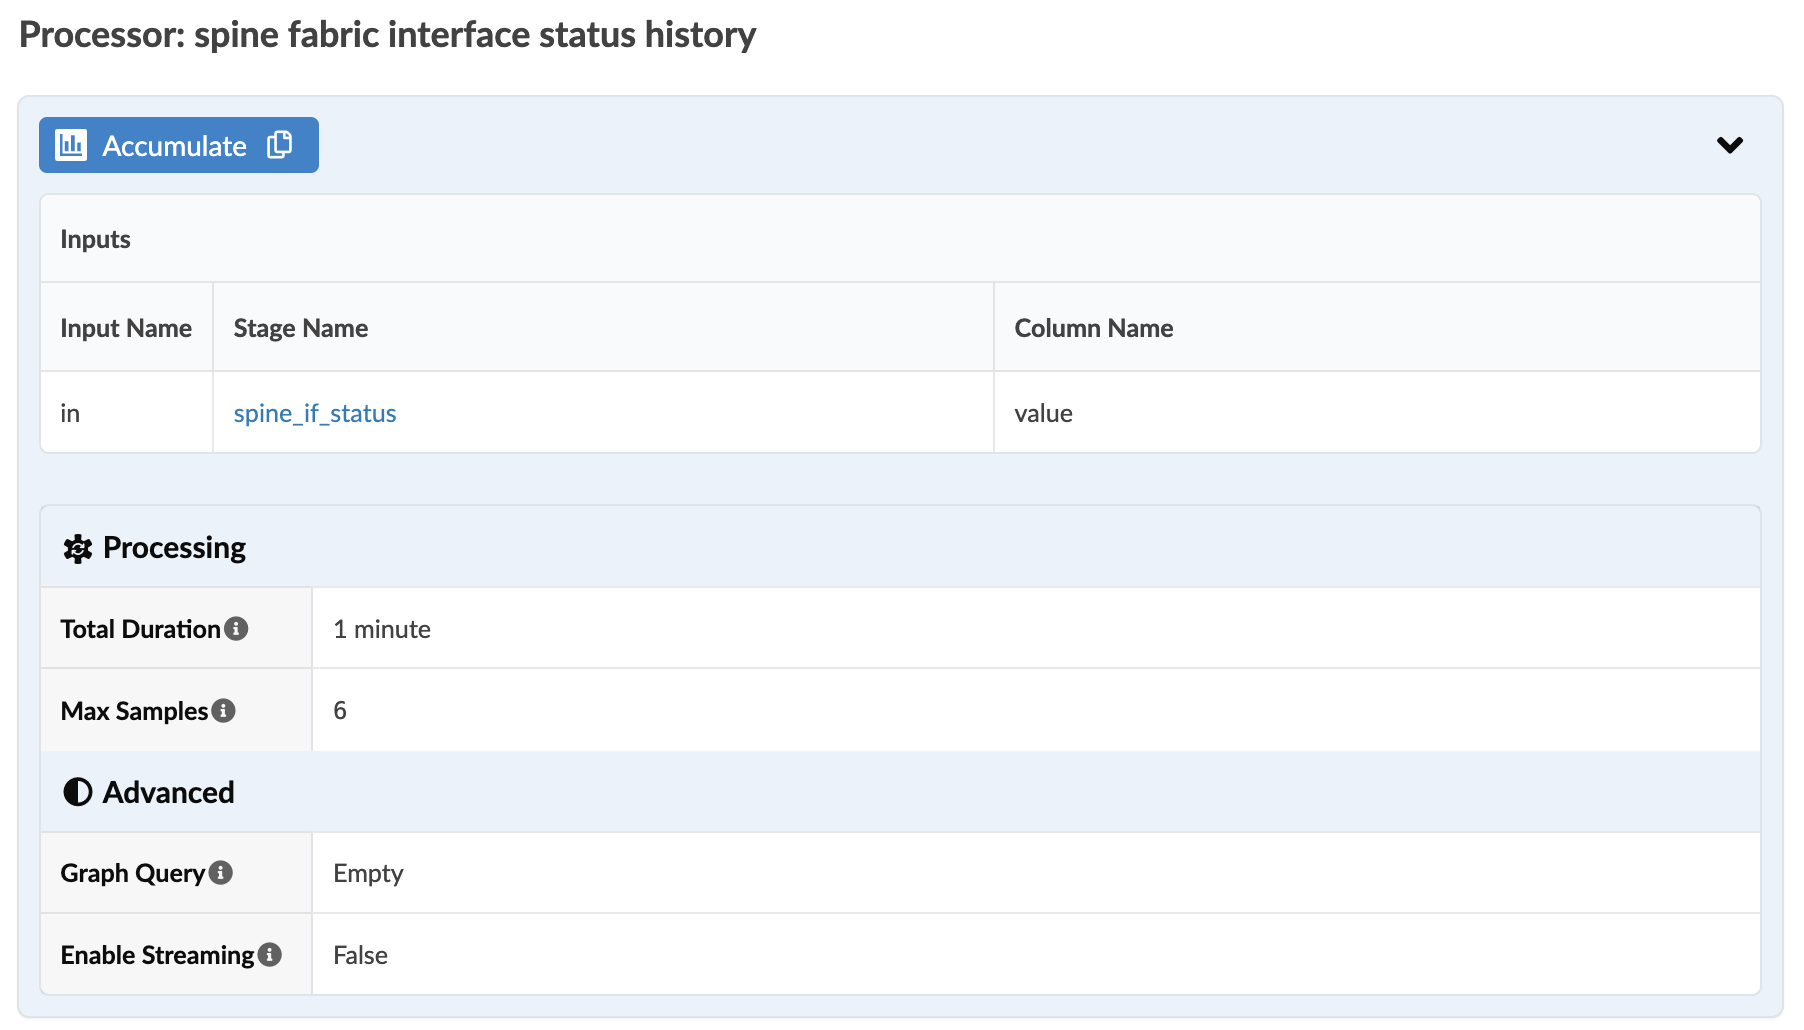
Spine Fabric Interface Status History Accumulate (Input)
For this stage, the Accumulate processor is configured for collecting spine fabric interface status history as shown in the screenshot below.
Spine Fabric Interface Status Accumulate (Output)
Spine Fabric Interface Flapping Processor
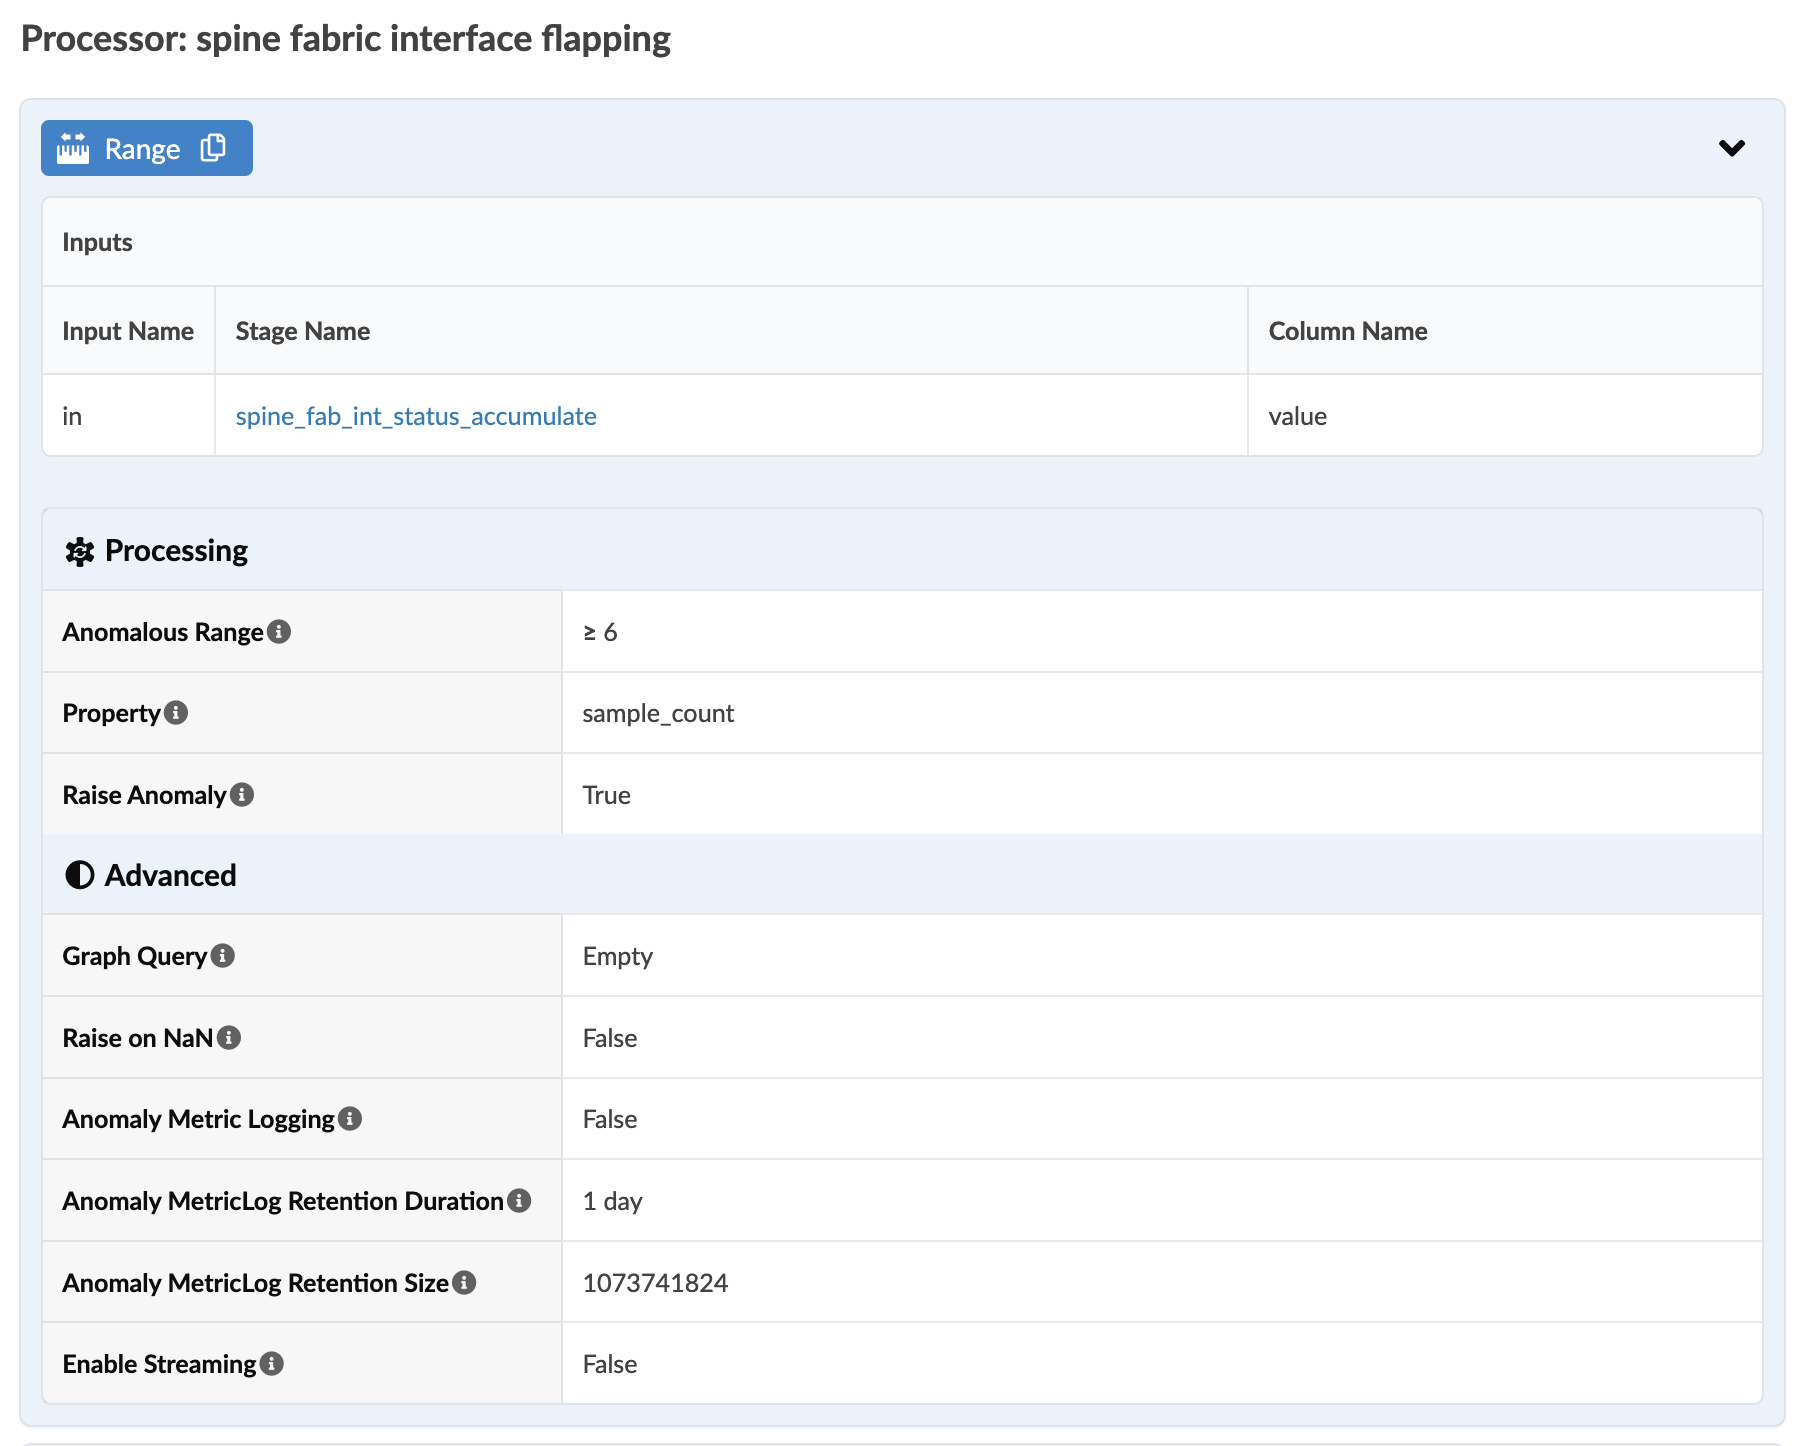
Spine Fabric Interface Flapping (Input)
For this stage, the Range processor is configured for collecting [spine fabric interface status history as shown in the screenshot below. The defaults are shown in the screenshot below.]
Interface Status Flapping (Output)
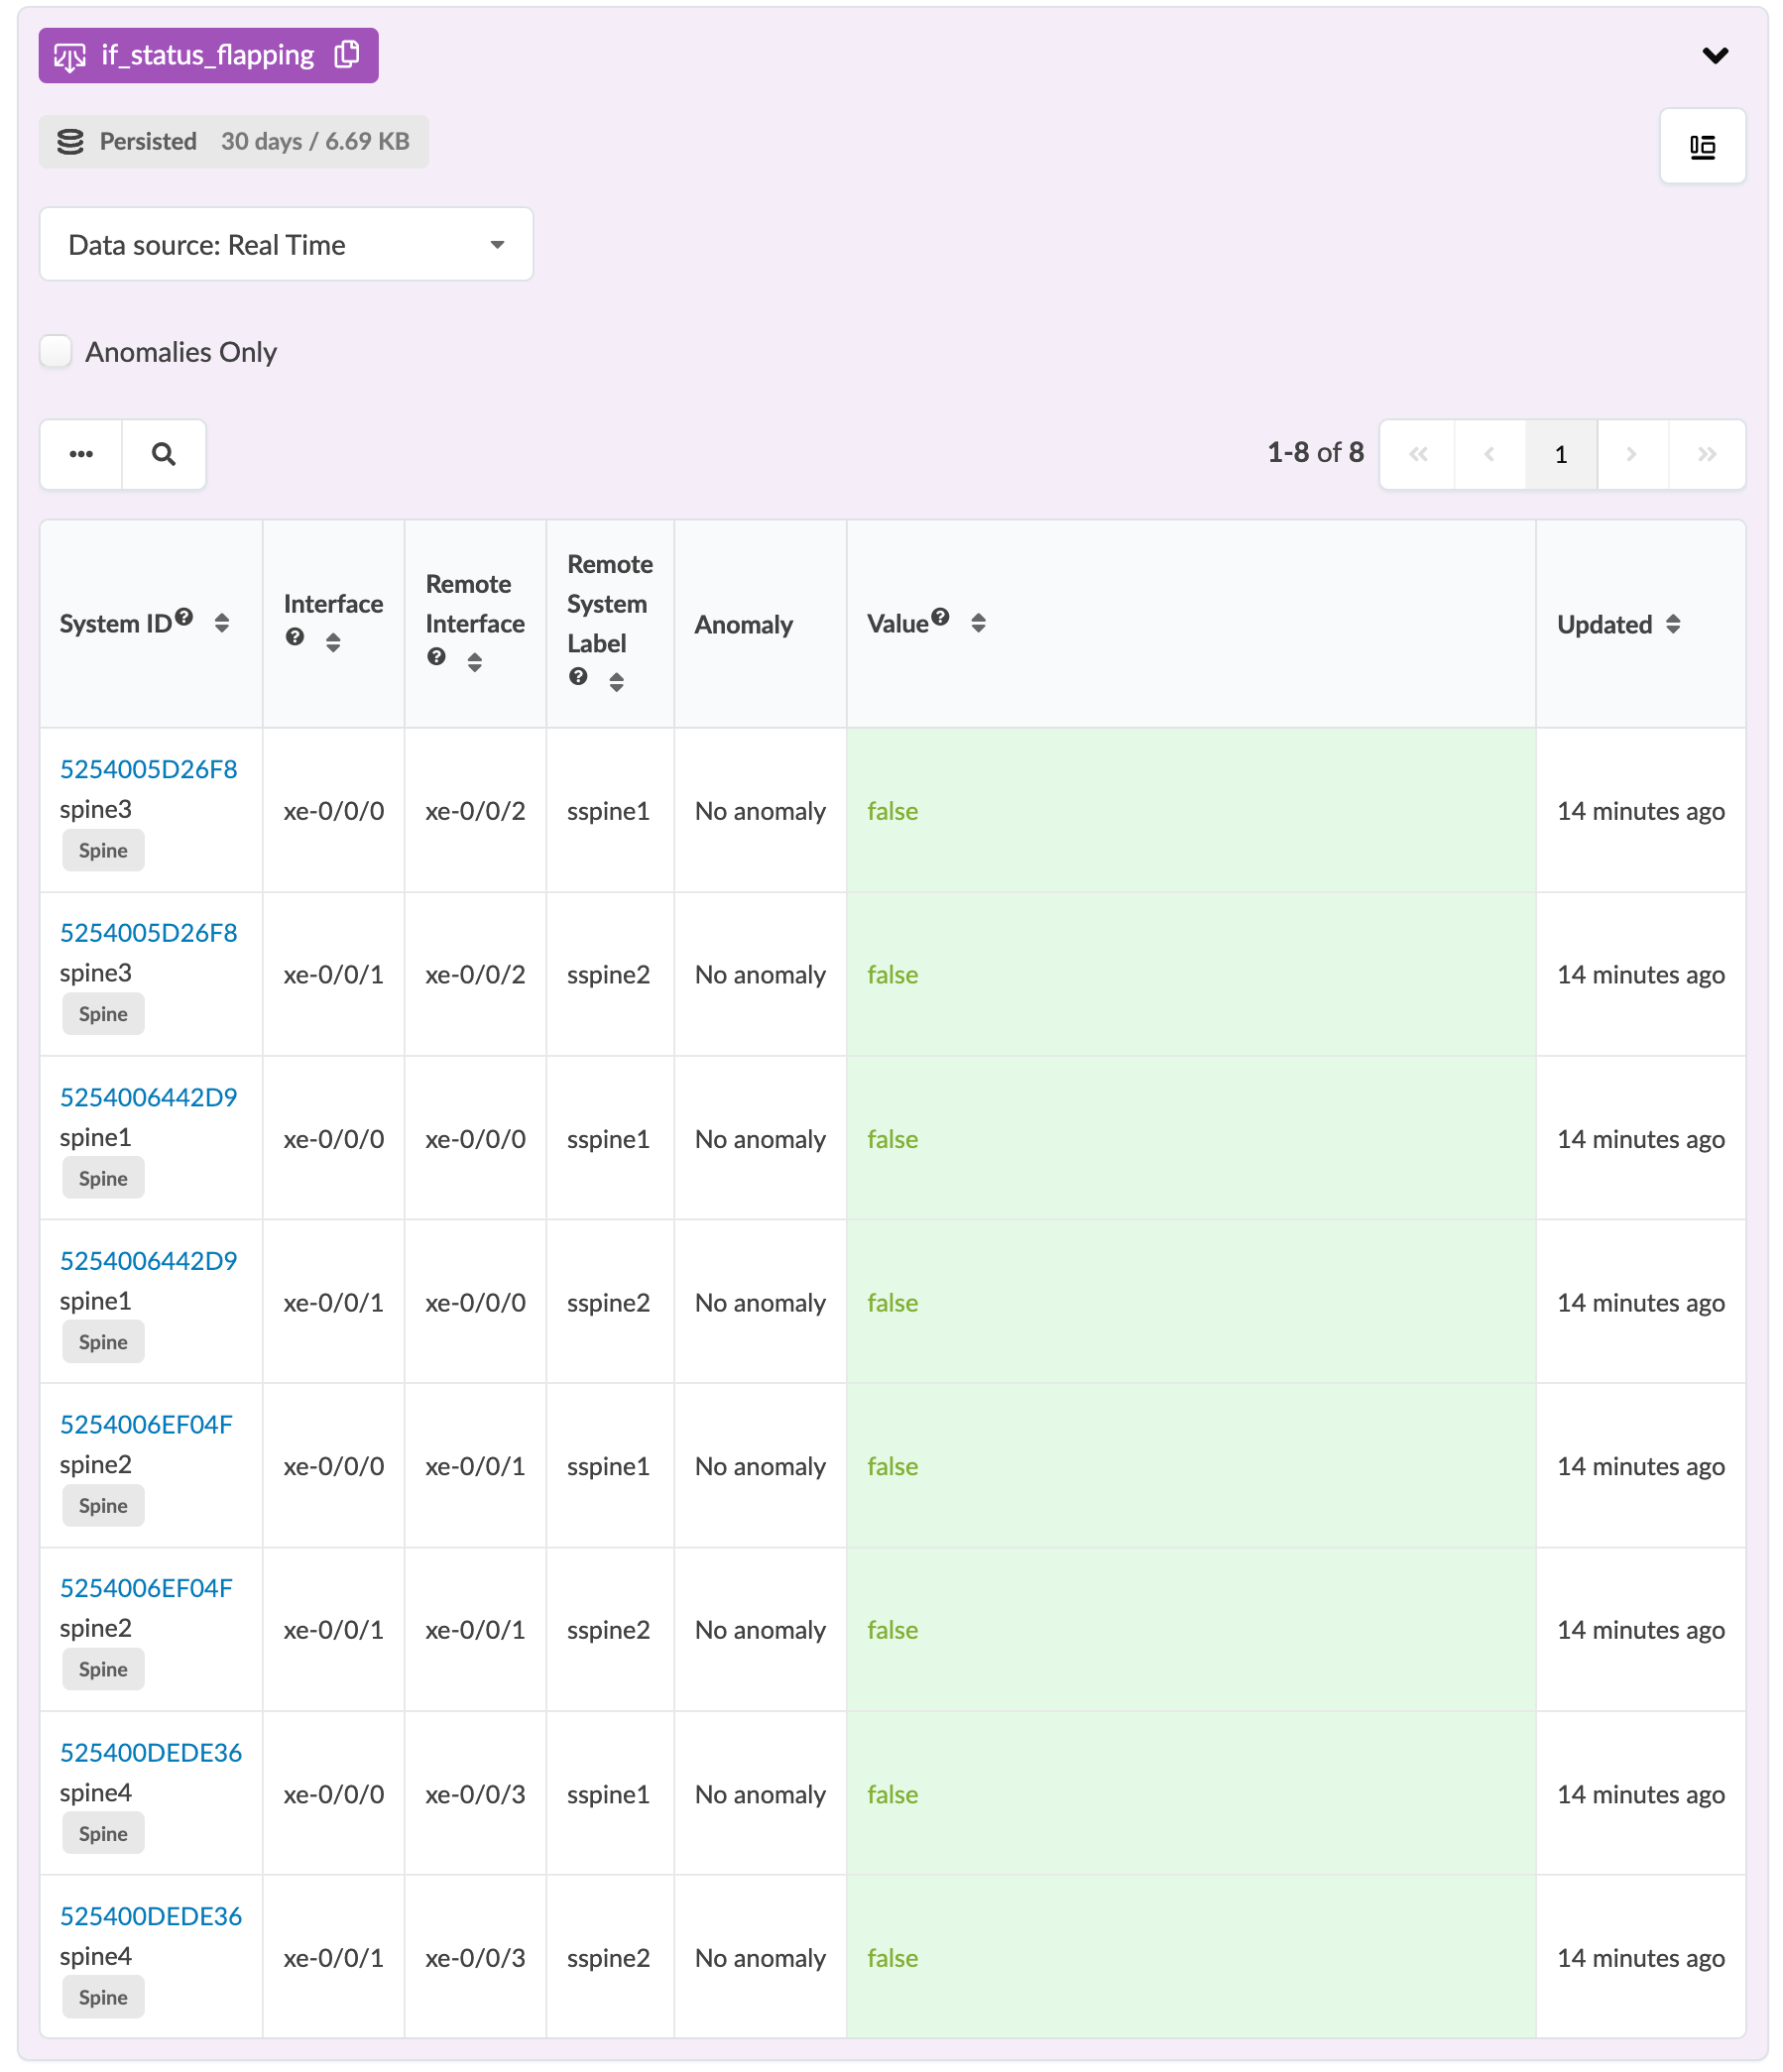
Percentage Flapping per Device Interfaces Processor
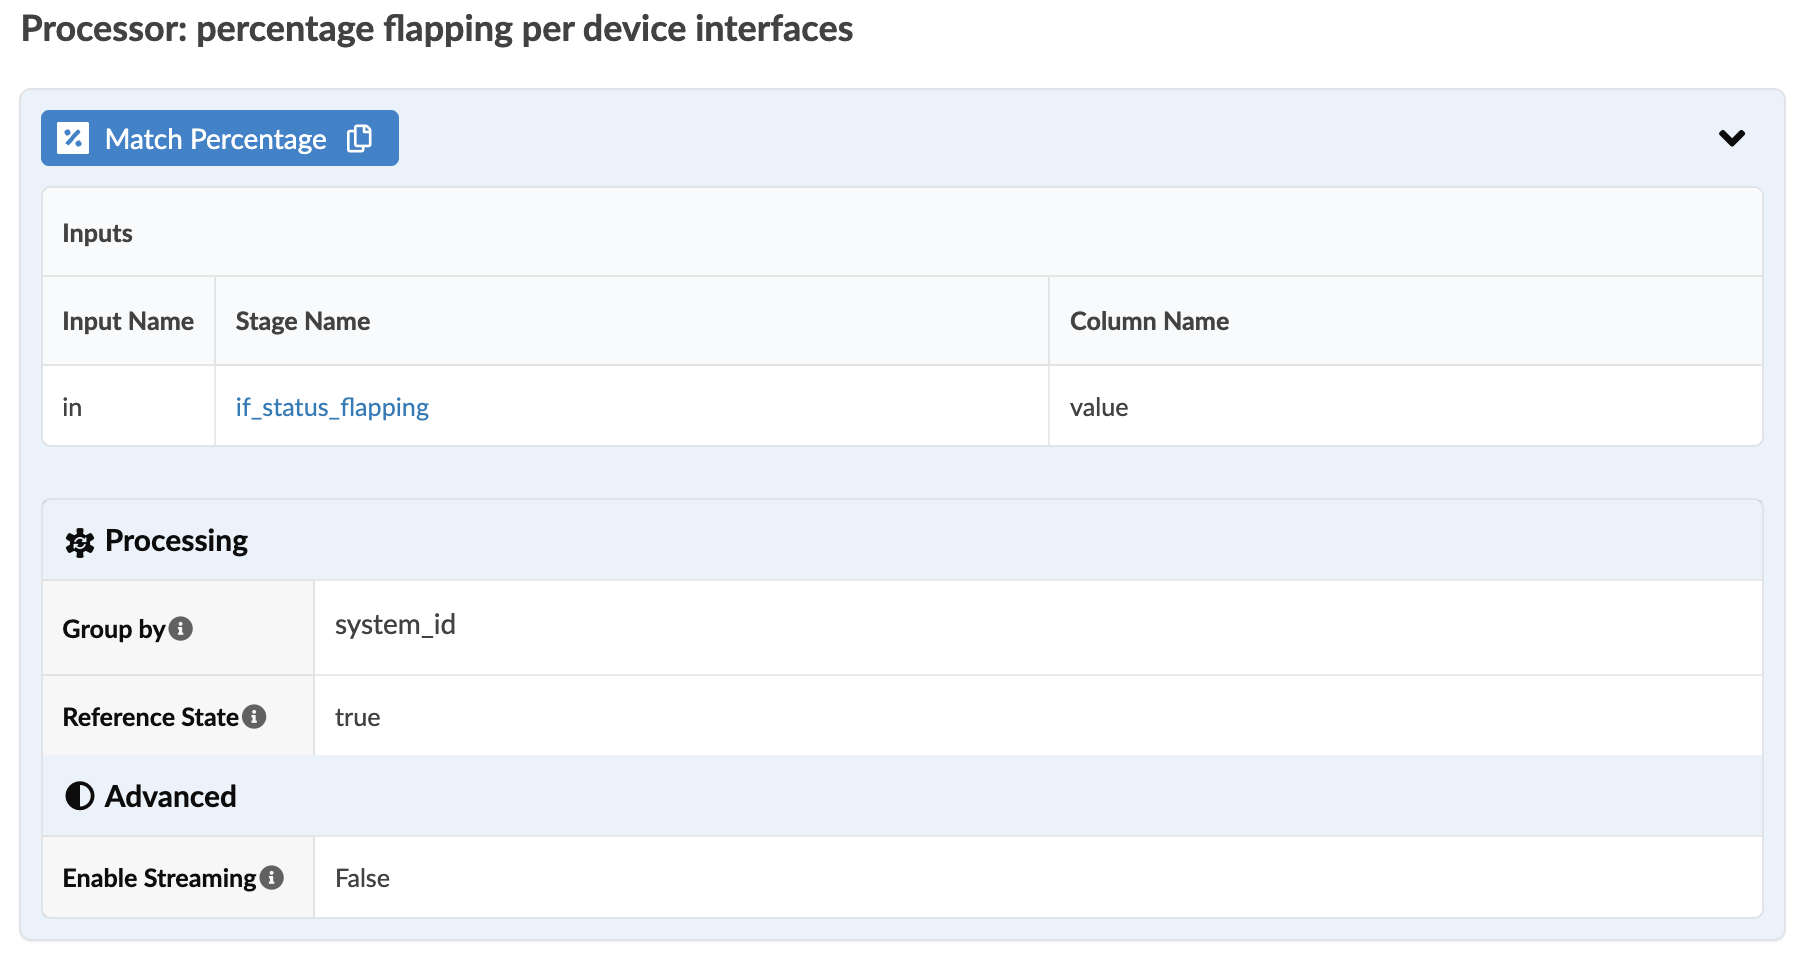
Percentage Flapping per Device Interfaces (Input)
For this stage, the Match Percentage processor is configured for collecting [spine fabric interface status history as shown in the screenshot below. The defaults are shown in the screenshot below.]
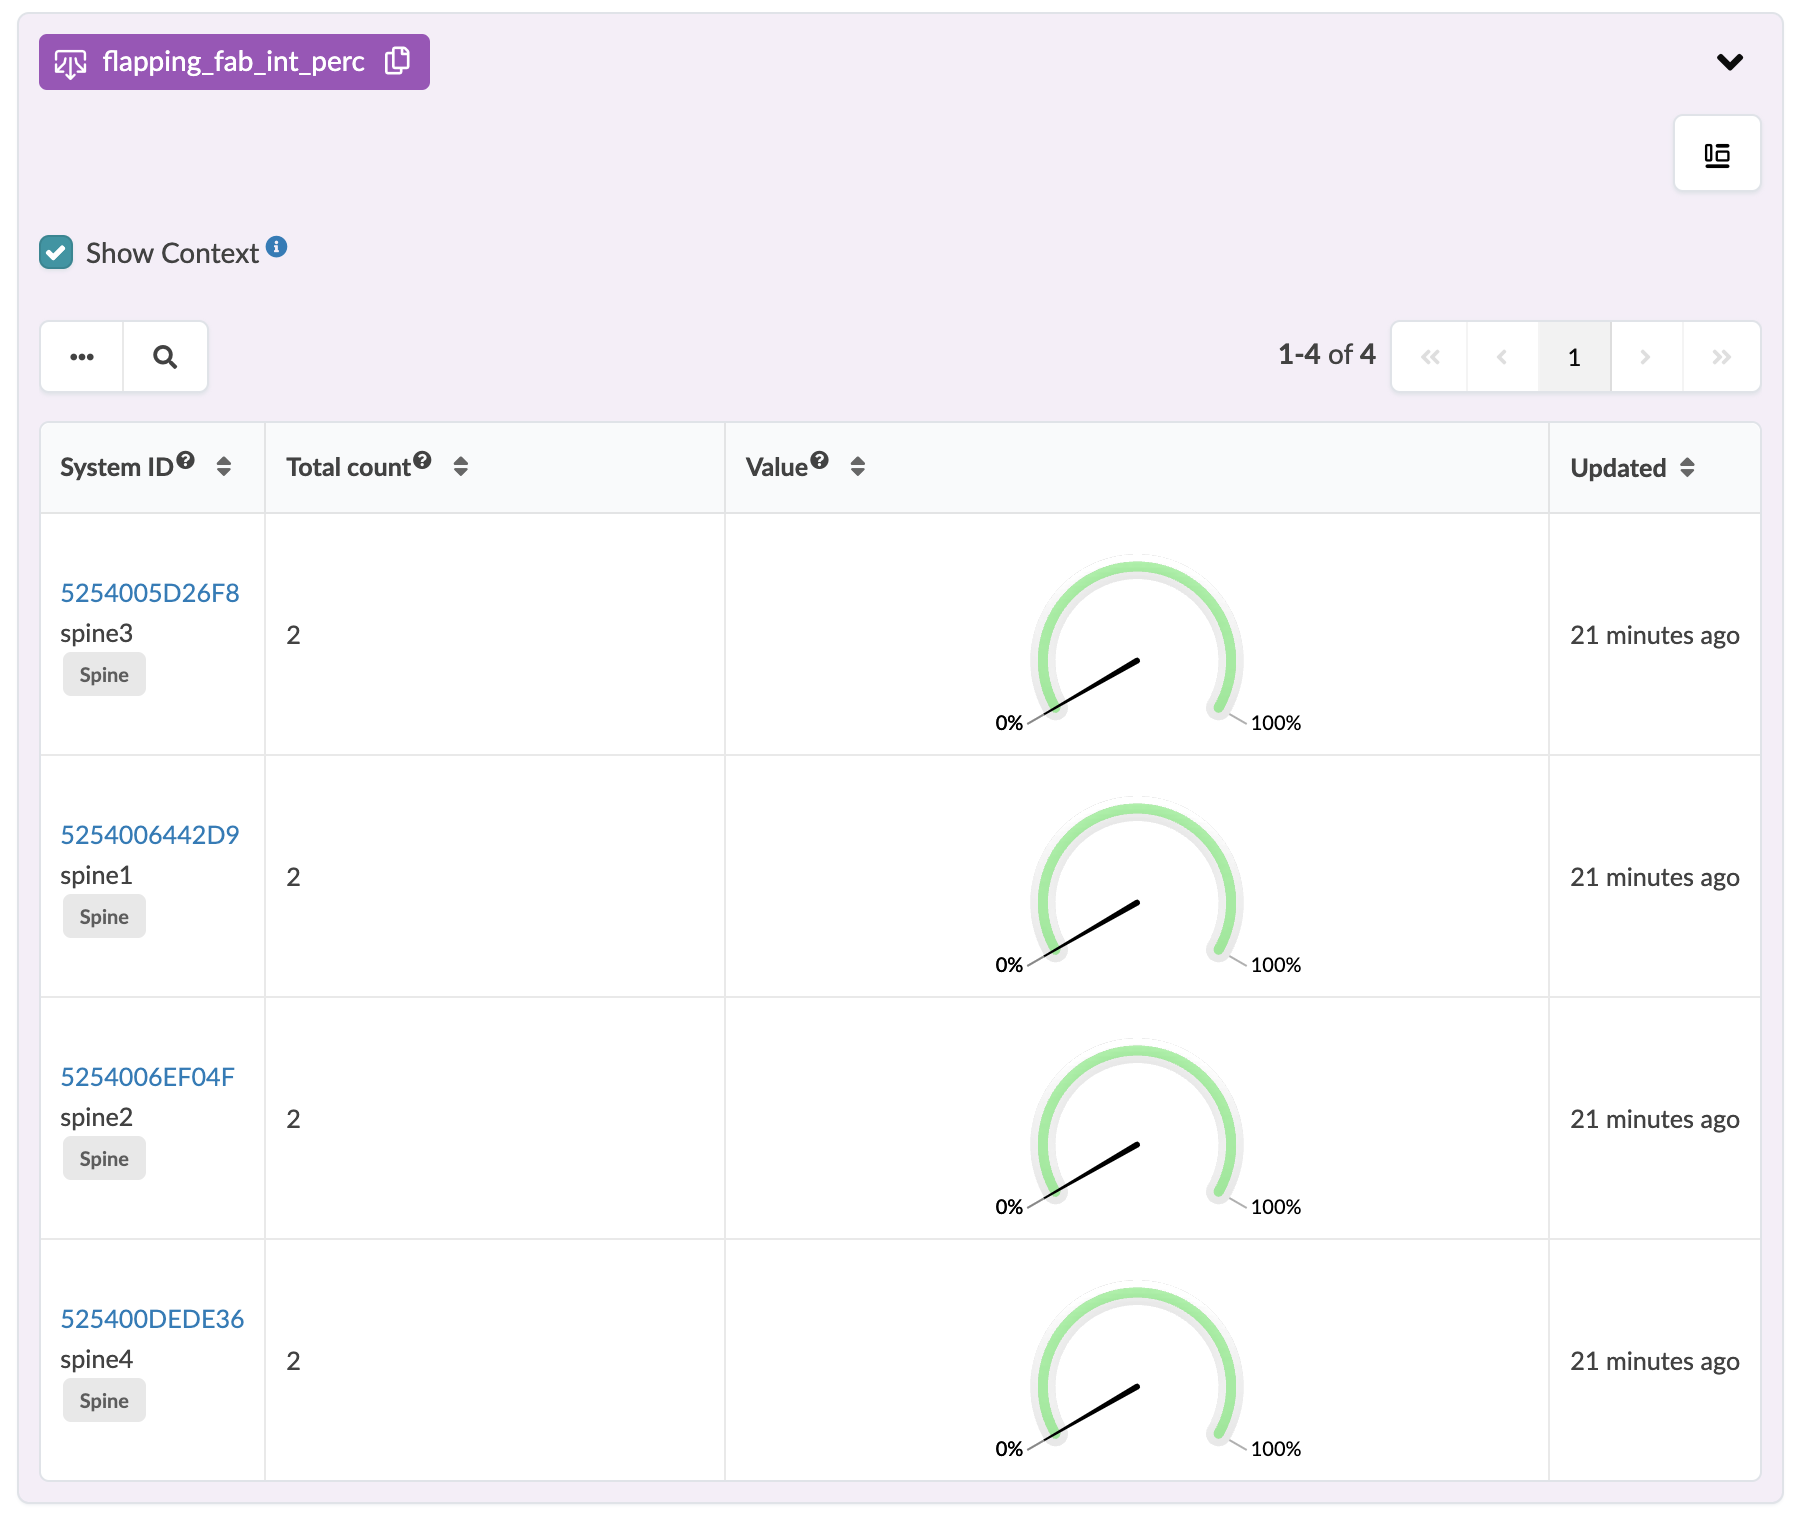
Flapping Fabric Interface Percentage (Output)
System Anomalous Flapping Processor
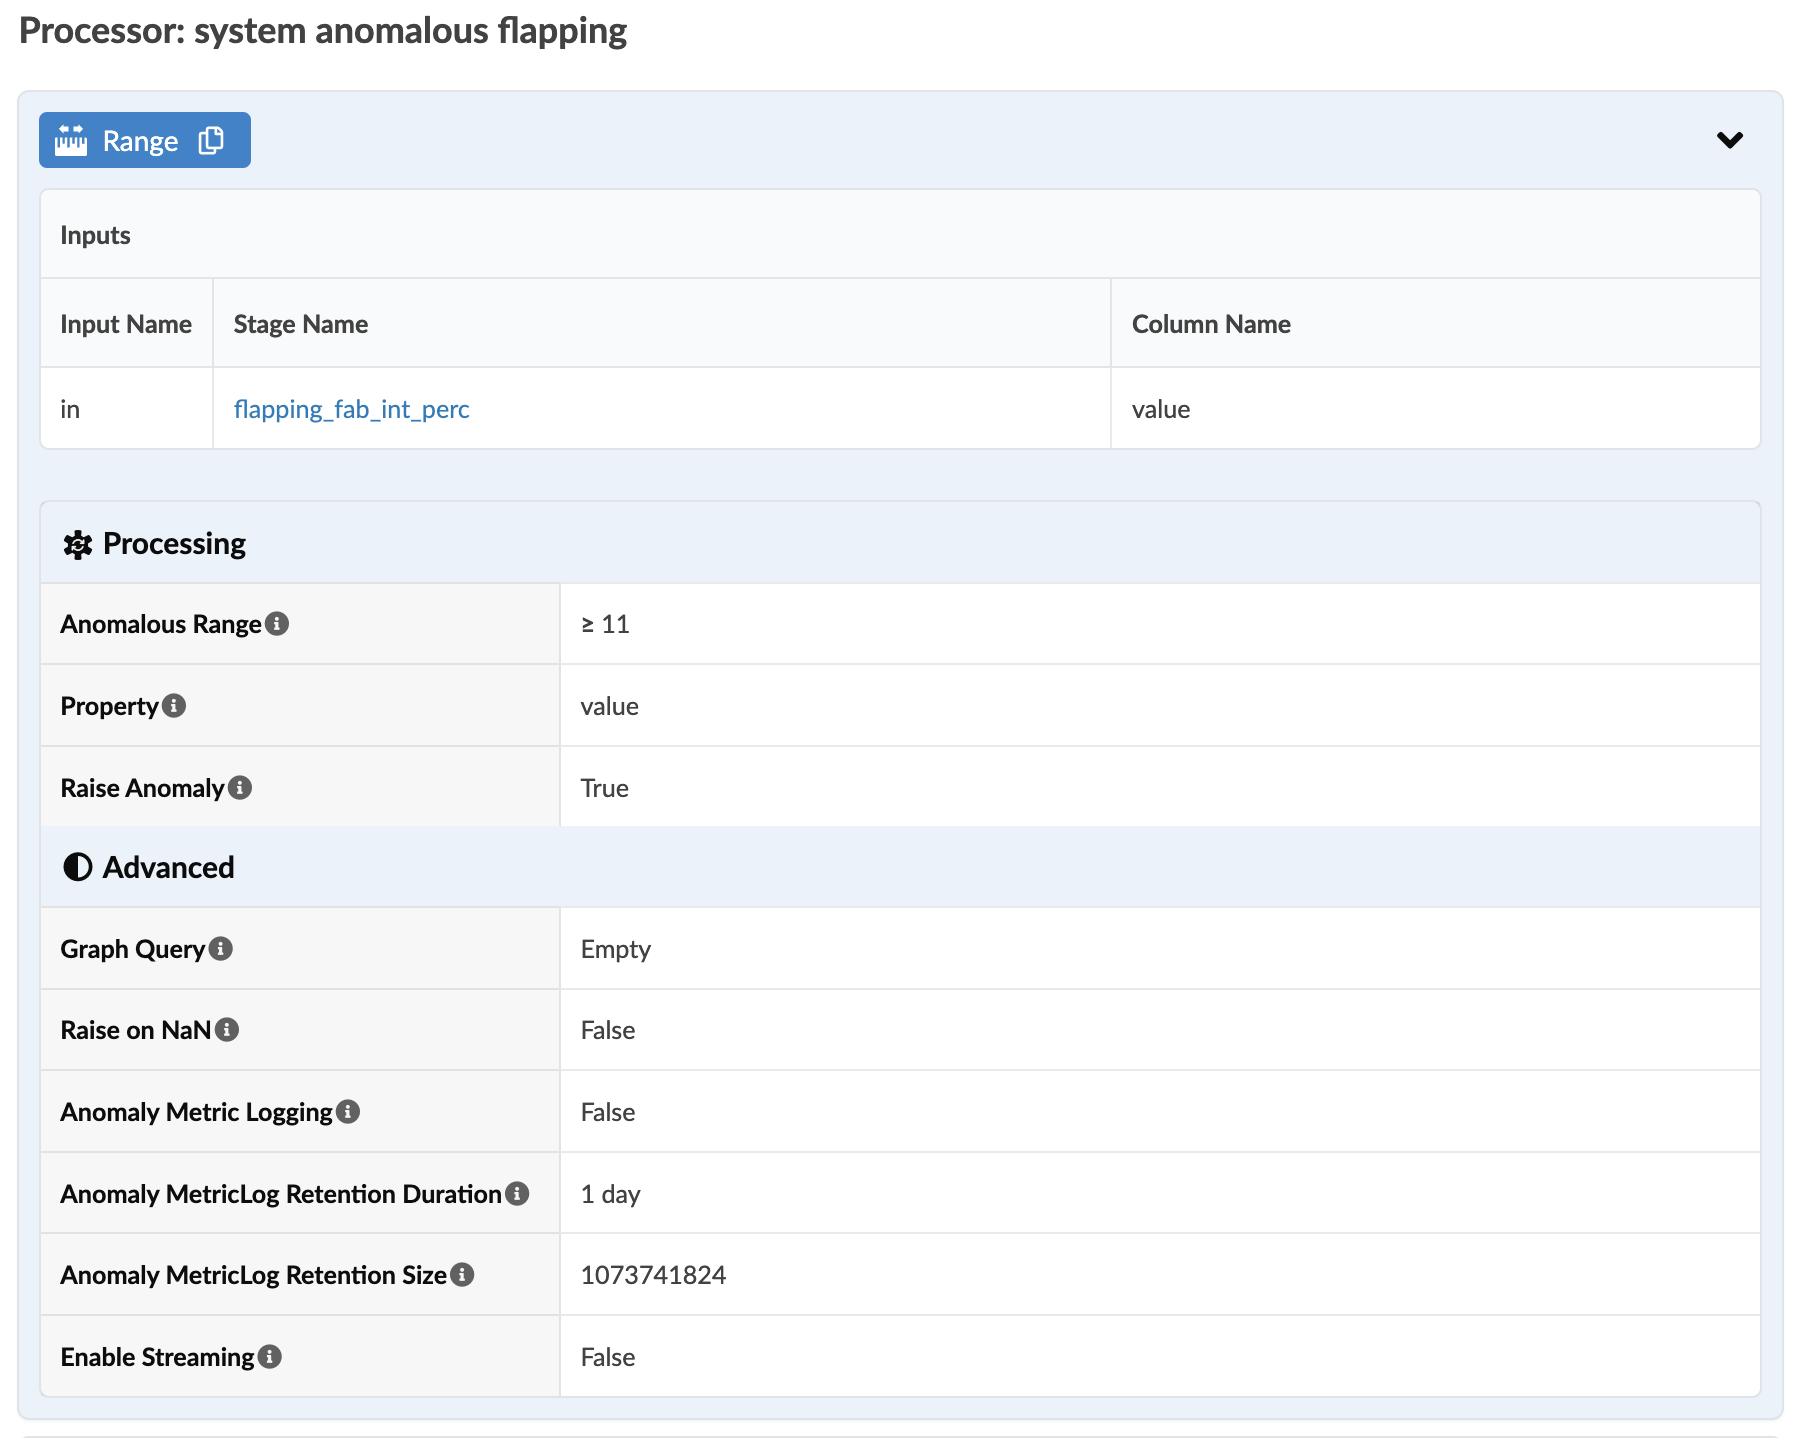
System Anomalous Flapping (Input)
For this stage, the Range processor is configured for collecting [spine fabric interface status history as shown in the screenshot below. The defaults are shown in the screenshot below.]
System Flapping (Output)