Critical Services: Utilization, Trending, Alerting Probe
The critical services probe monitors critical services identified by user tags and provides trending data for interfaces hosting the generic systems tag. Users are proactively notified of issues from potential bandwidth contention. Additionally, historical data is persisted for trending analysis for troubleshooting or assisting in right-sizing future deployments. By default, the probe displays 1h/1d/30day average information and alerts if any individual interface with the specified tag reaches utilization threshold.
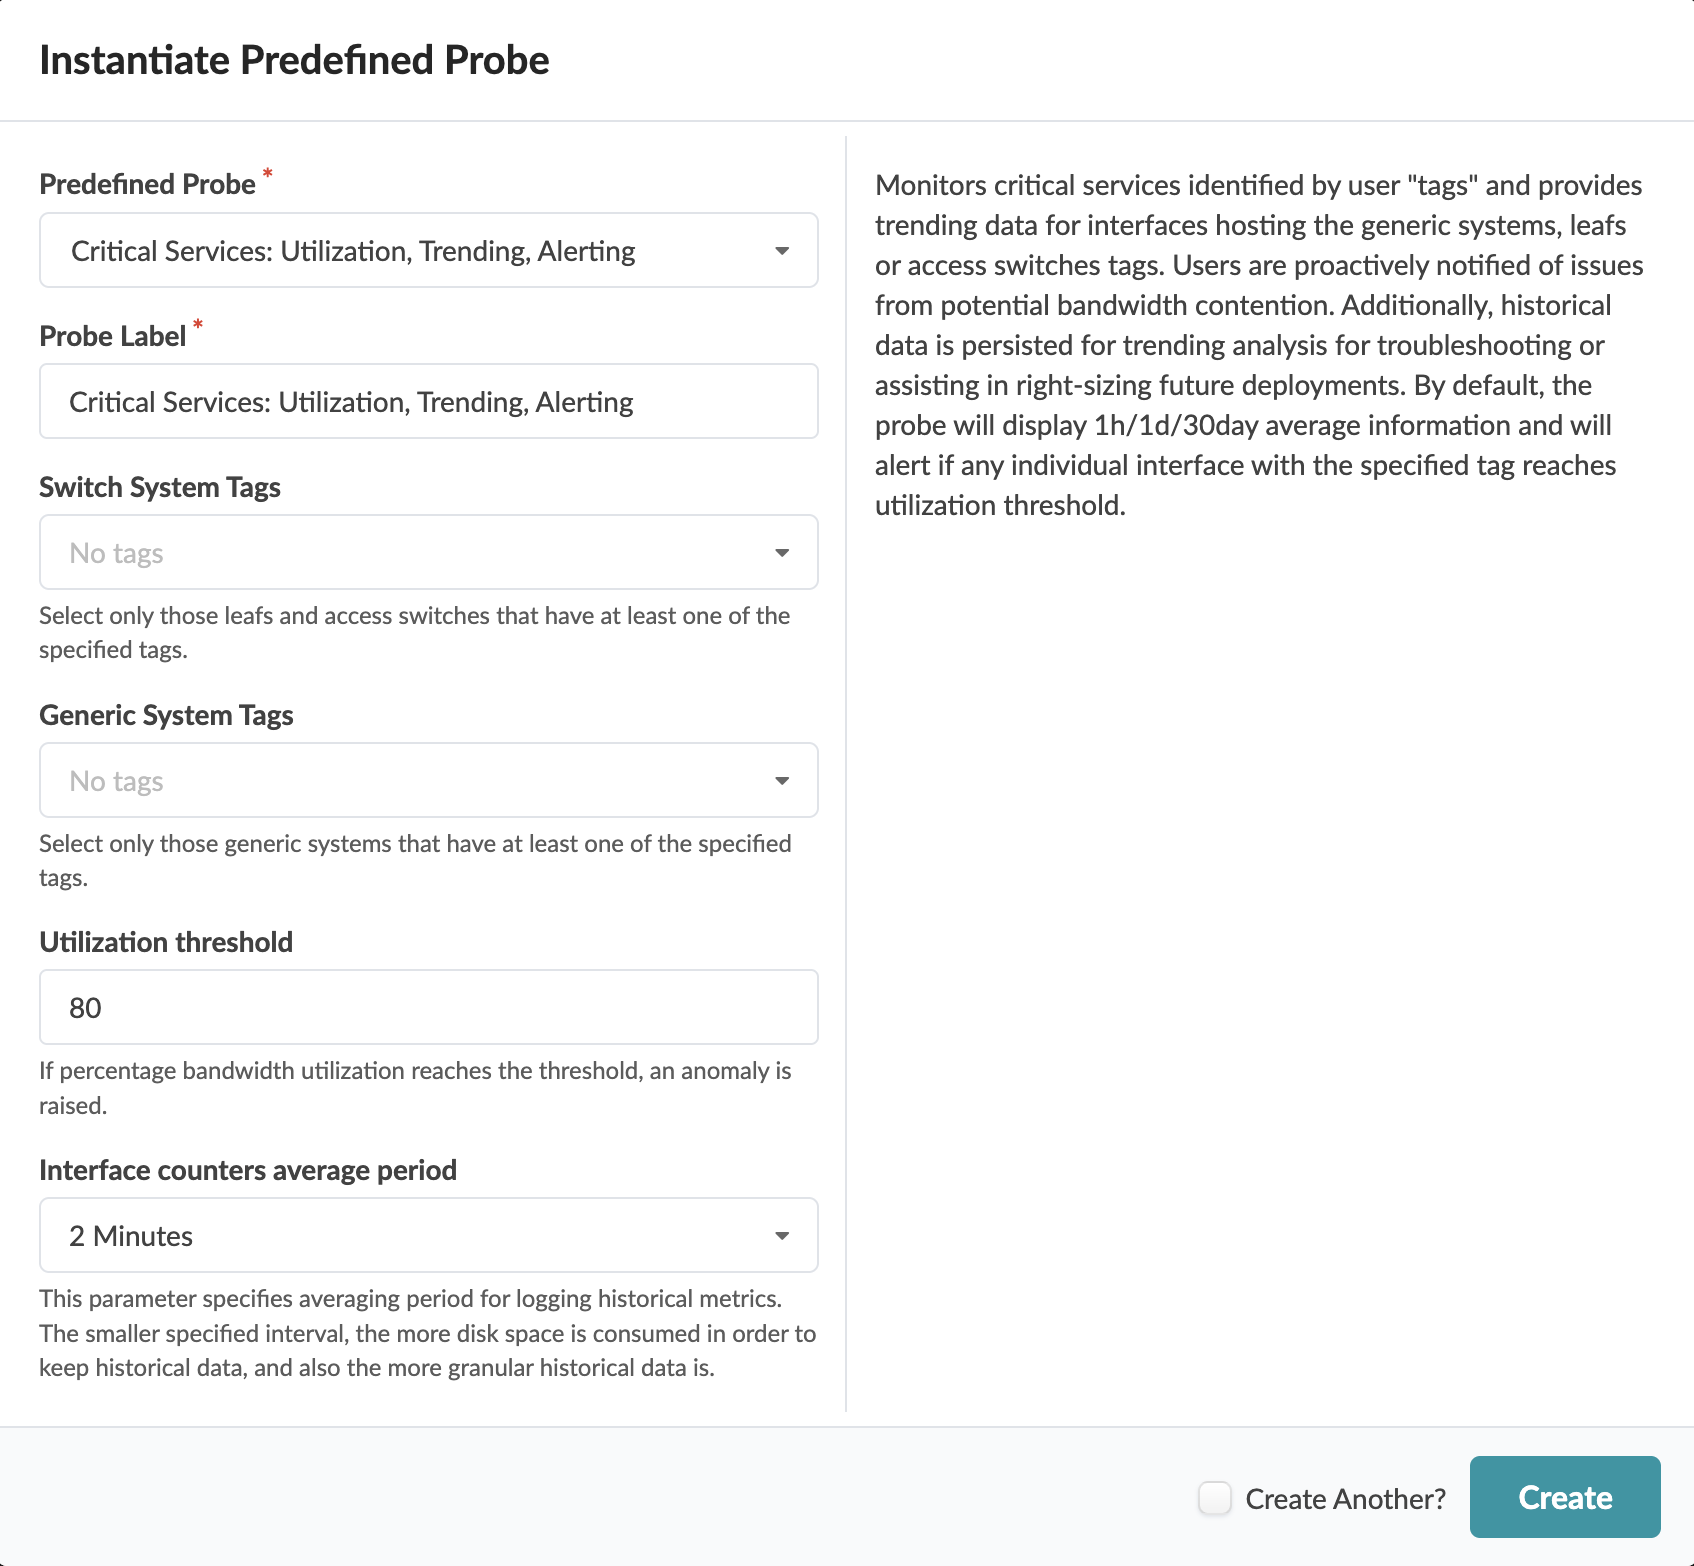
When you instantiate the predefined Critical Services probe you can customize parameters or leave default values as is, as shown in the screenshot below.
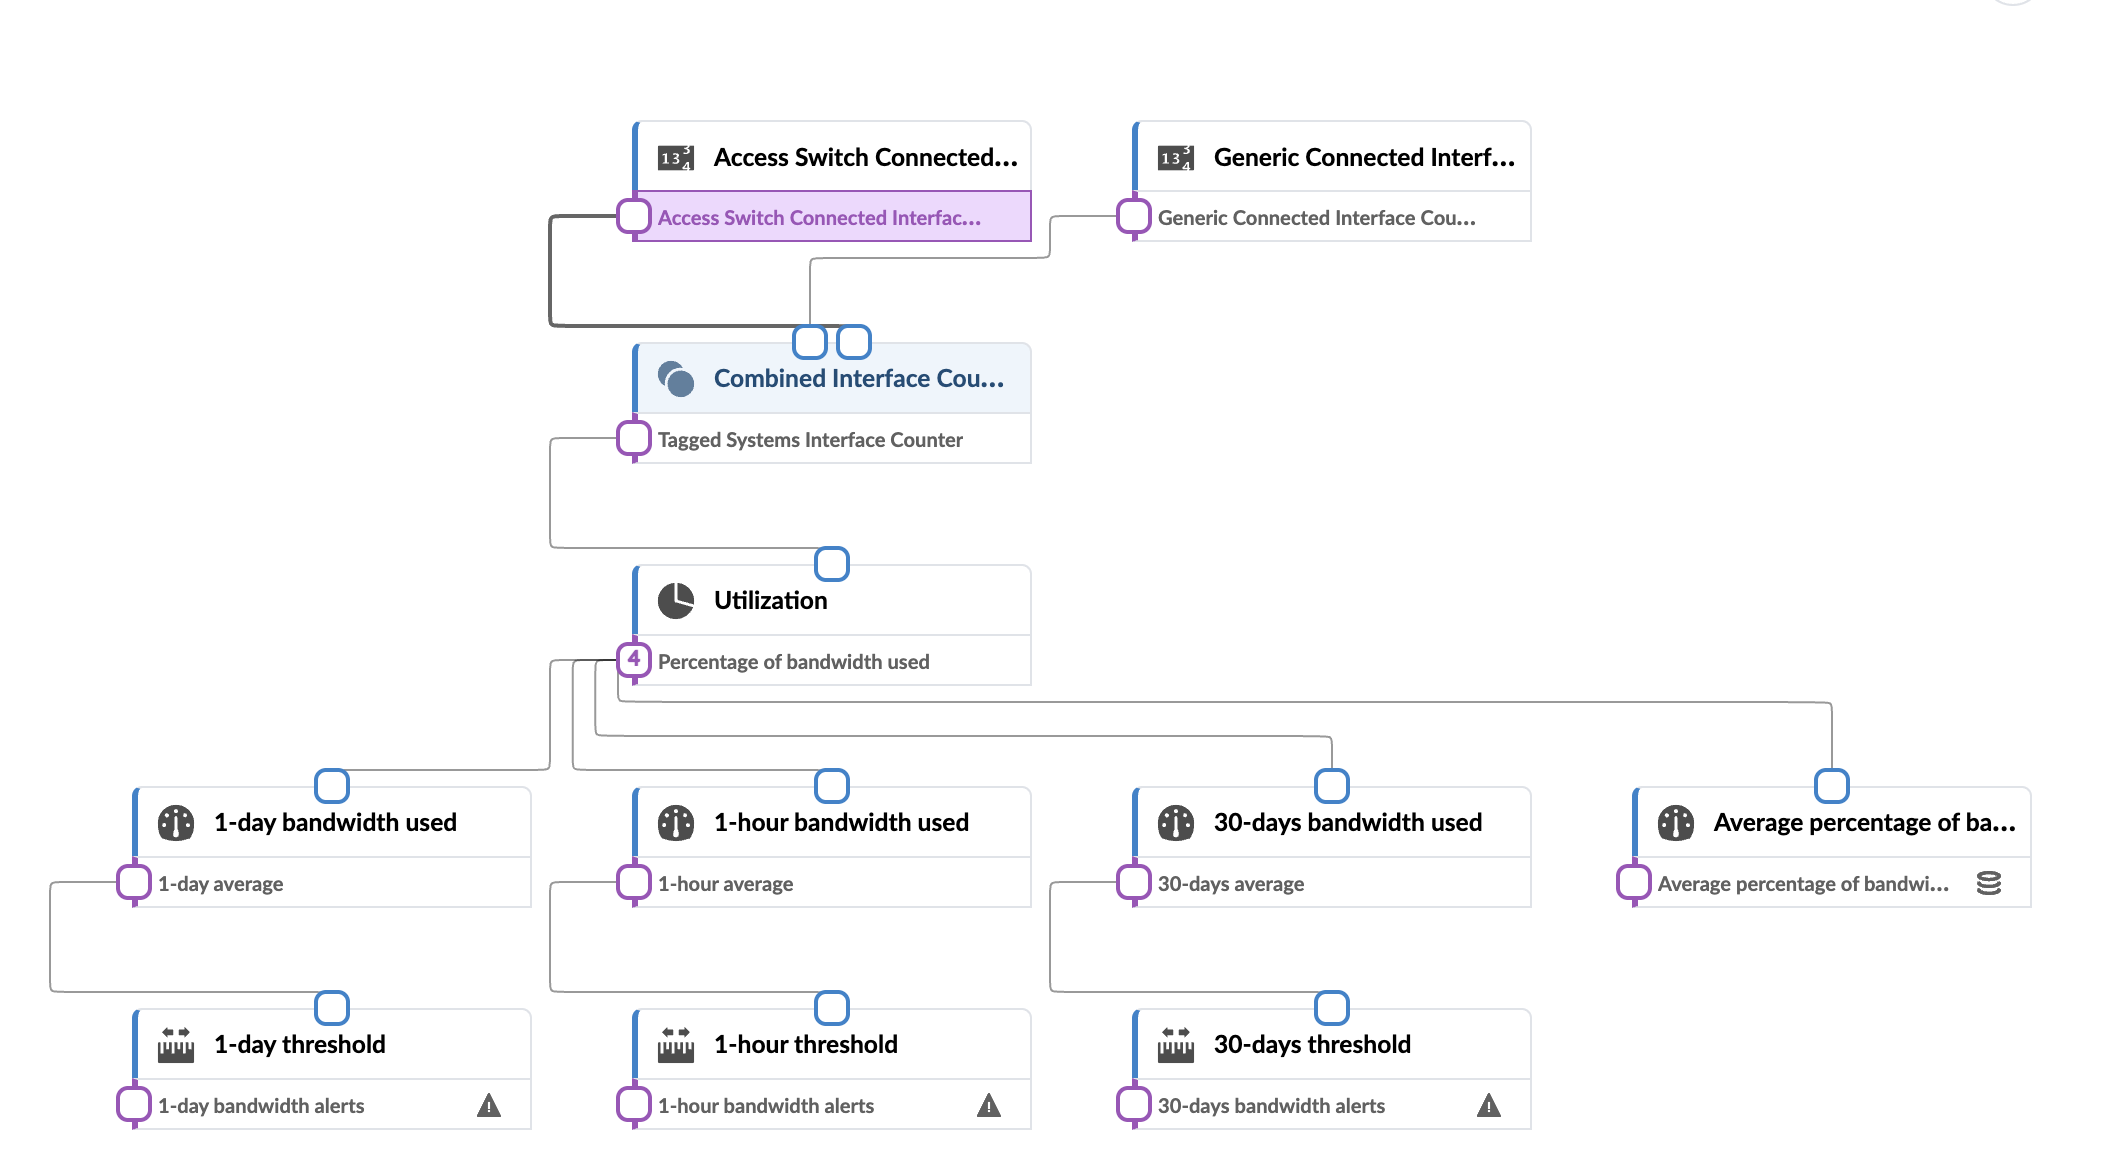
The following stages are used in the interface flapping probe for specific fabric interfaces:
For more information about this probe, from the blueprint, navigate to Analytics > Probes, click Create Probe, then select Instantiate Predefined Probe from the drop-down list. Select the probe from the Predefined Probe drop-down list to see details specific to the probe.