Control Plane Policing Probe
The Control Plane Policing (COPP) probe validates output on all managed switches in the fabric and protects the control plane CPU from overload caused by host-path punted packets. This probe raises per-protocol violations, with each violation indicating a dropped packet. You can use this probe to help troubleshoot unexpected network forwarding behavior. Supported platforms include Junos OS, Junos OS EVO, Arista EOS, CISCO NX-OS, and SONiC.
The Control Plane Policing (COPP) probe:
-
Collects the system response of Control Plane Policing outputs. The collector uses the following commands:
-
Arista EOS:
show policy-map copp-system-policy -
CISCO NXOS:
show policy-map interface control-plane -
SONiC:
debugsh -c,ORCHAGENT -eshow system internal orchagent copp policers -
JUNOS:
show ddos-protection protocols
-
Probe Settings
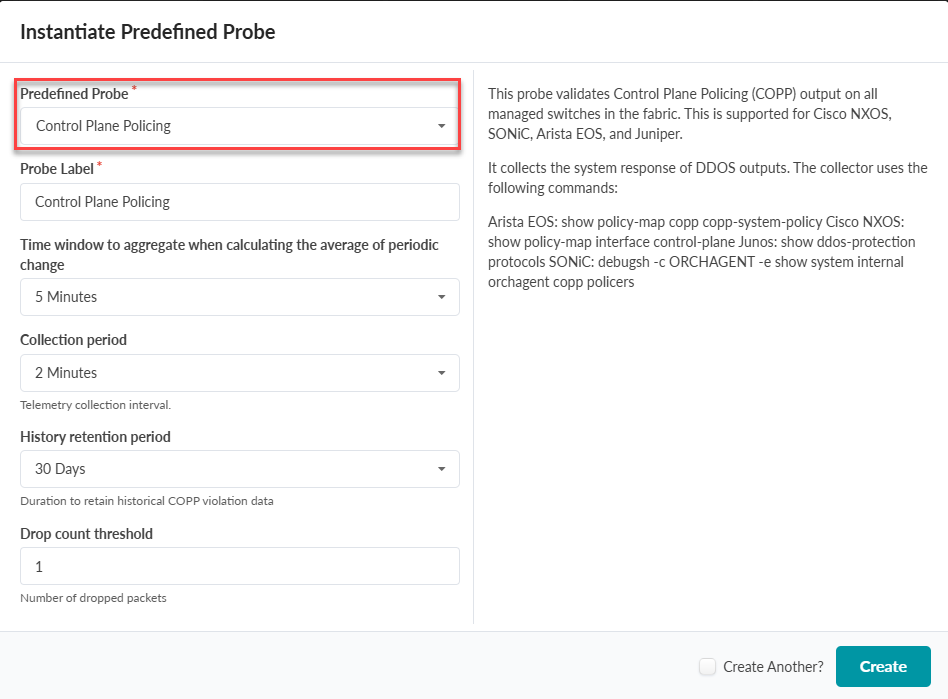
To specify the probe settings, follow the instructions in Instantiating the Predefined Probe. Select the Control Plane Policing probe from the drop-down menu and specify the probe parameters.
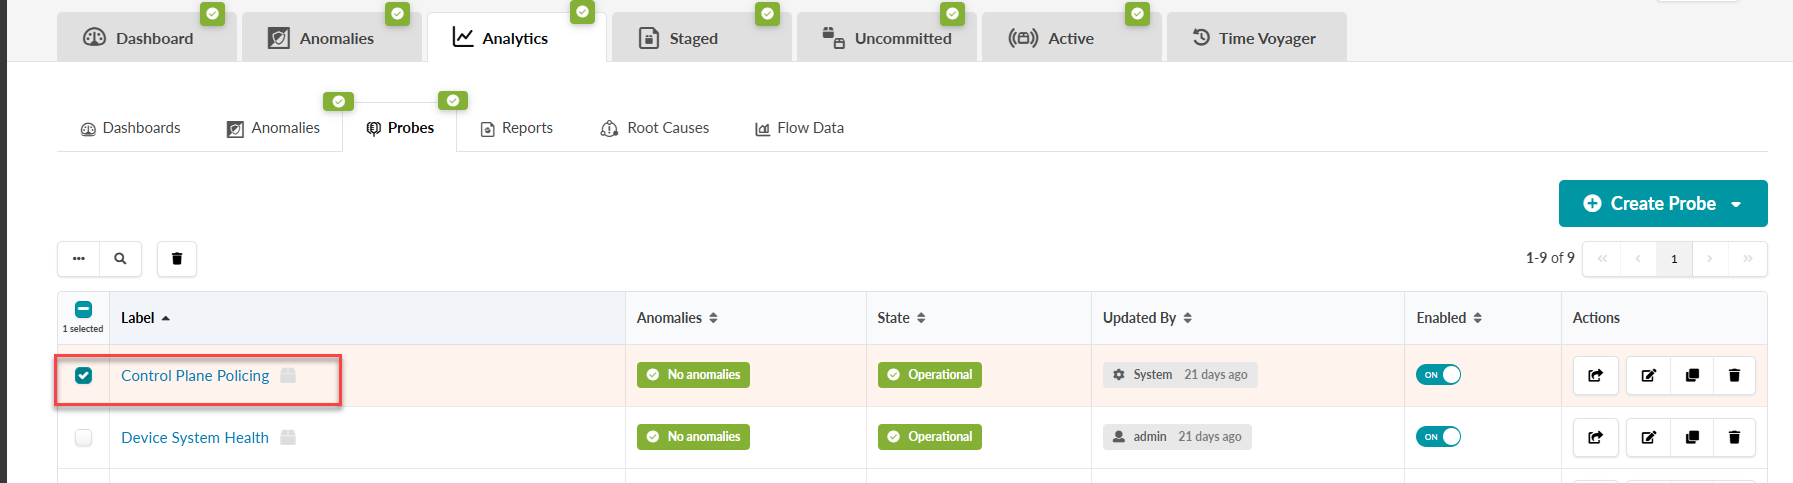
To configure the probe, navigate to Analytics > Probes and click the Control Plane Policing probe.
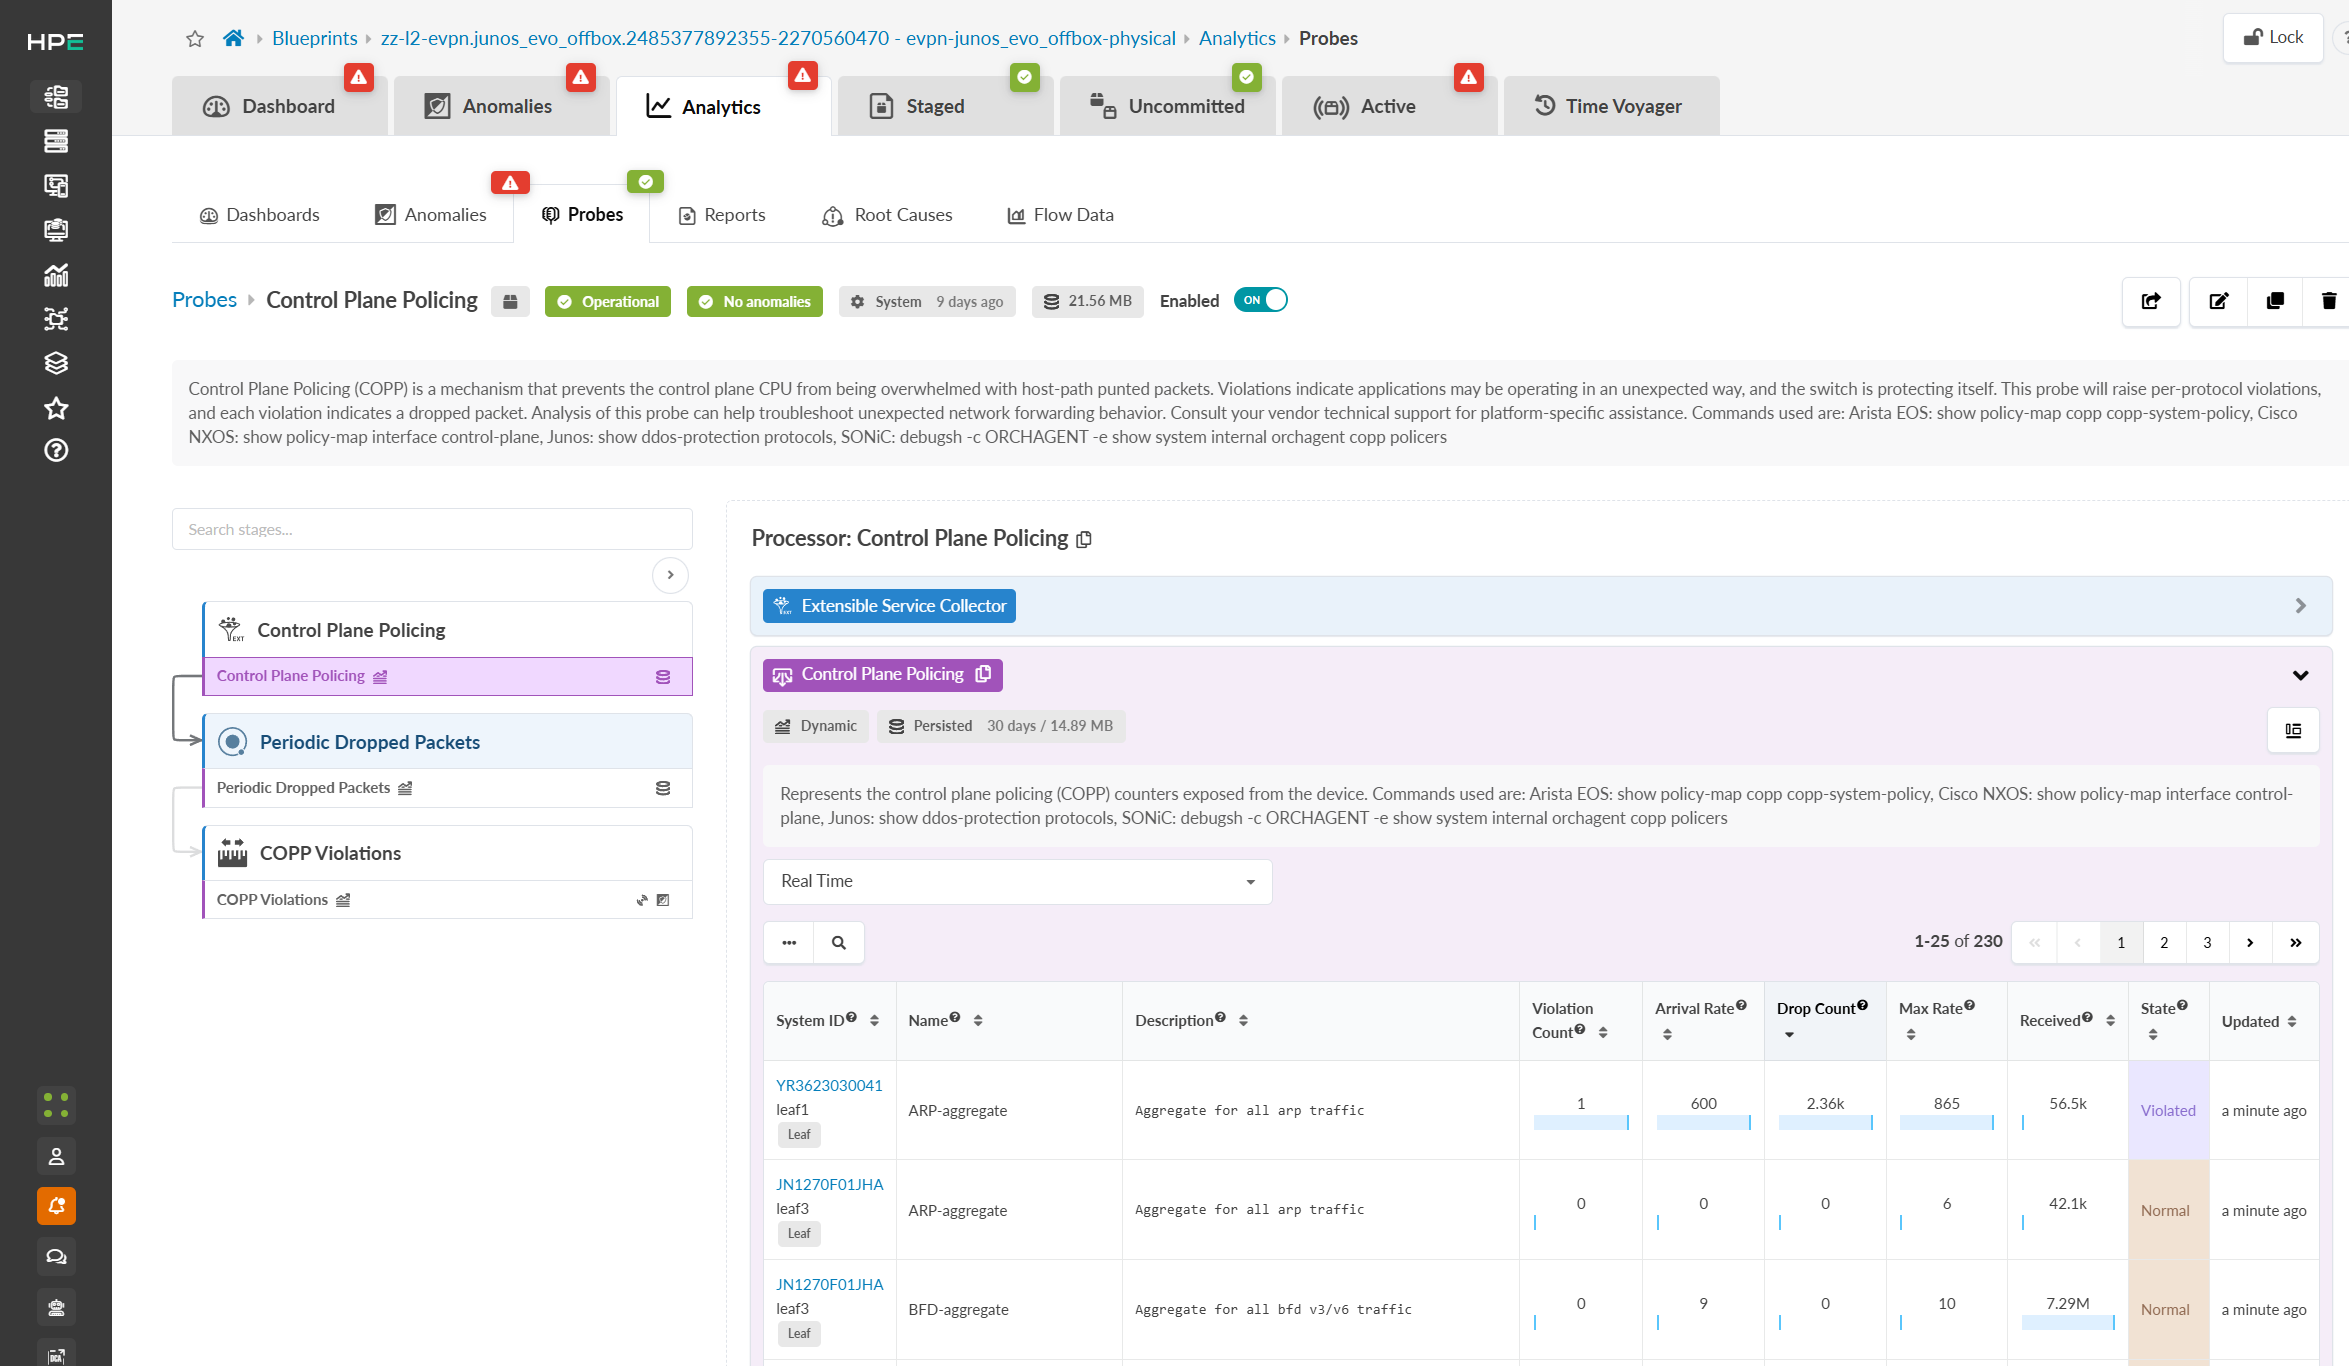
Processor: Control Place Policing
Control Plane Policing (COPP) stops host-path punted packets from overwhelming the control plane CPU. Violations indicate that applications may behave unexpectedly, and the switch protects itself accordingly.
This diagnostic probe raises per-protocol violations, and each violation indicates a dropped packet. Unchecked violations can disrupt routing protocols and management access, especially during COPP attacks or high-volume traffic. Analyzing this diagnostic probe can help troubleshoot unexpected network forwarding behavior.
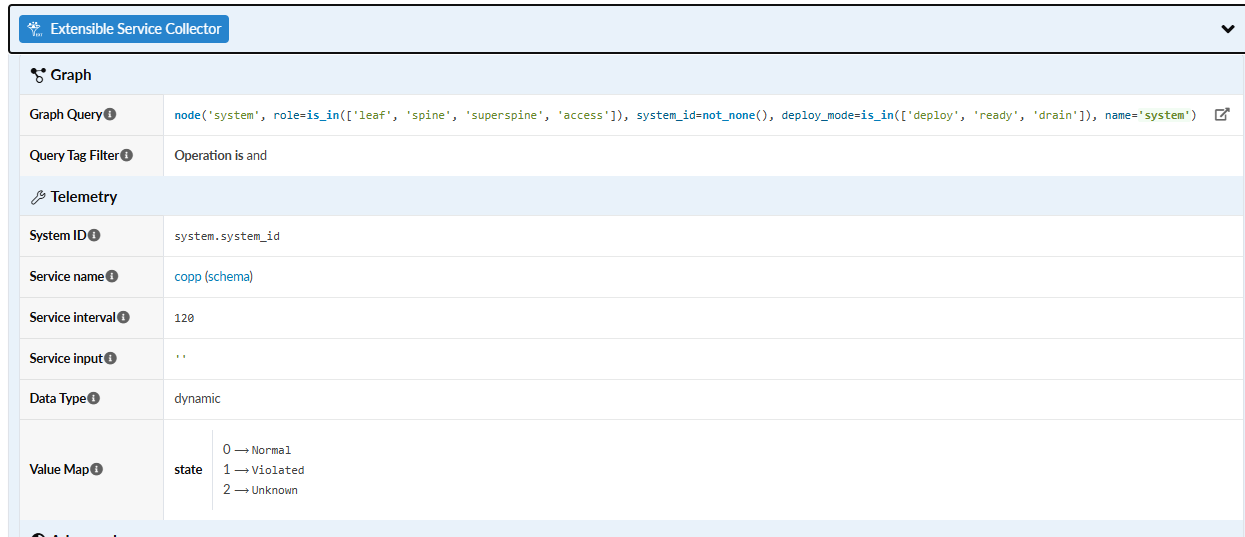
Extensible Service Collector
The Extensive Service Collector ingests data from custom telemetry services. Use this processor for services built with custom telemetry collectors.
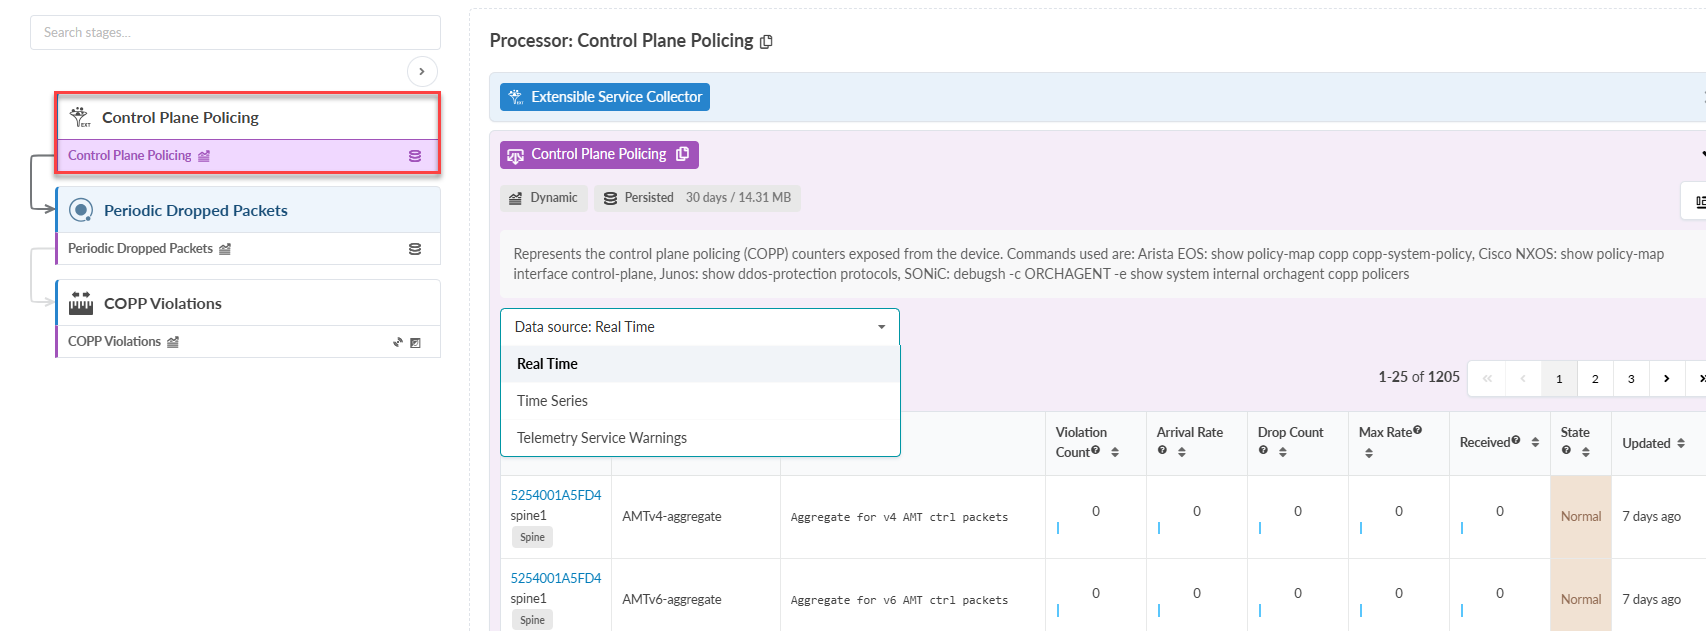
Control Plane Policing
The Control Plane Policing page shows the COPP counters exposed for each device. Control packets such as SSH, ICMP, Telnet, ARP, and BGP are handled by the local processor.
Processor: Periodic Dropped Packets
Anomalies occur when dropped packets exceed the Drop Count Threshold during the Aggregation Period. Periodic packet loss often indicates network congestion, outdated drivers, or faulty hardware. Significant packet loss overwhelms router buffers, causing slower load times and latency.
Telemetry synchronization issues, specifically within the GRPD communication channel, or misconfigured IBA probes can also cause packet loss. The dropped-packet process measures the dropped packet count between collection intervals.
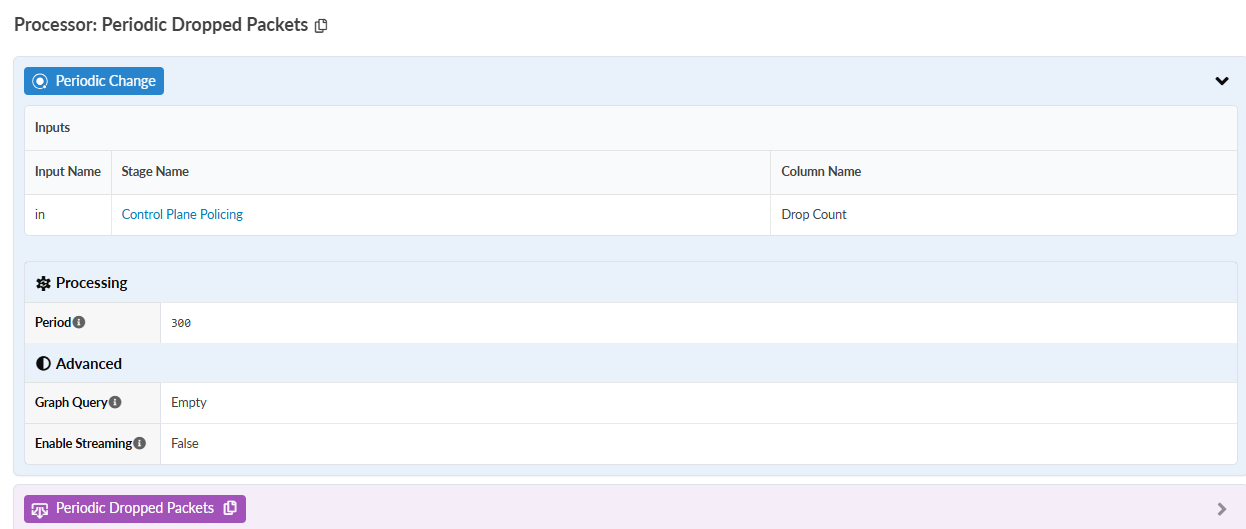
Periodic Change
The Periodic Change Processor calculates absolute changes over a defined period for each input value. Input values increase monotonically, ensuring the number of values never decreases over time.
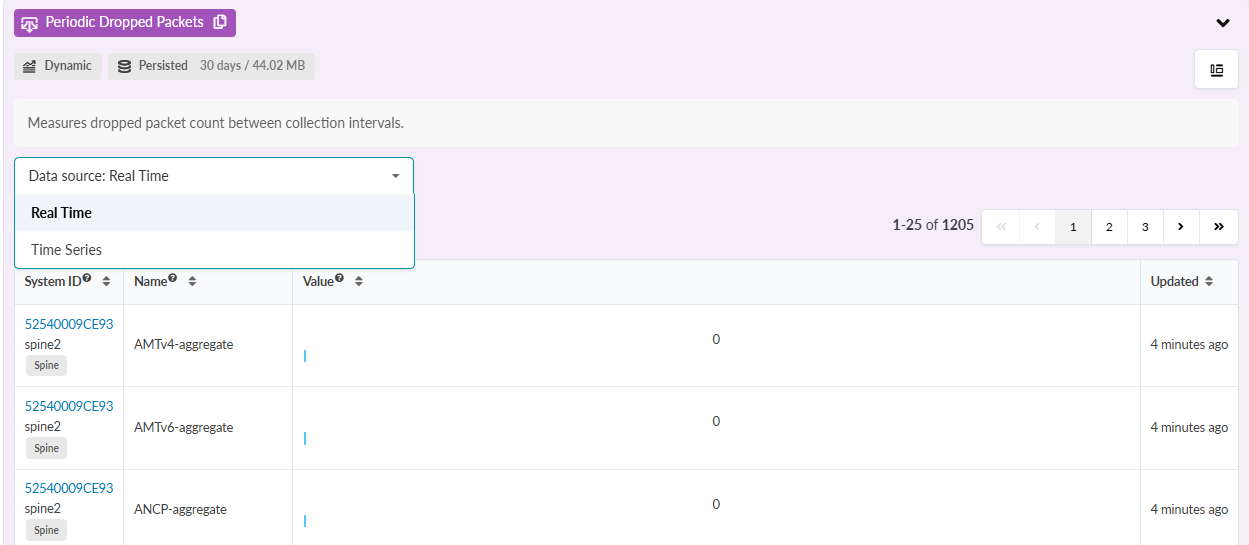
Periodic Dropped Packets
The Periodic Dropped Packets table tracks dropped packets between collection intervals. You can view the data in real time or as a time series.
Processor: COPP Violations
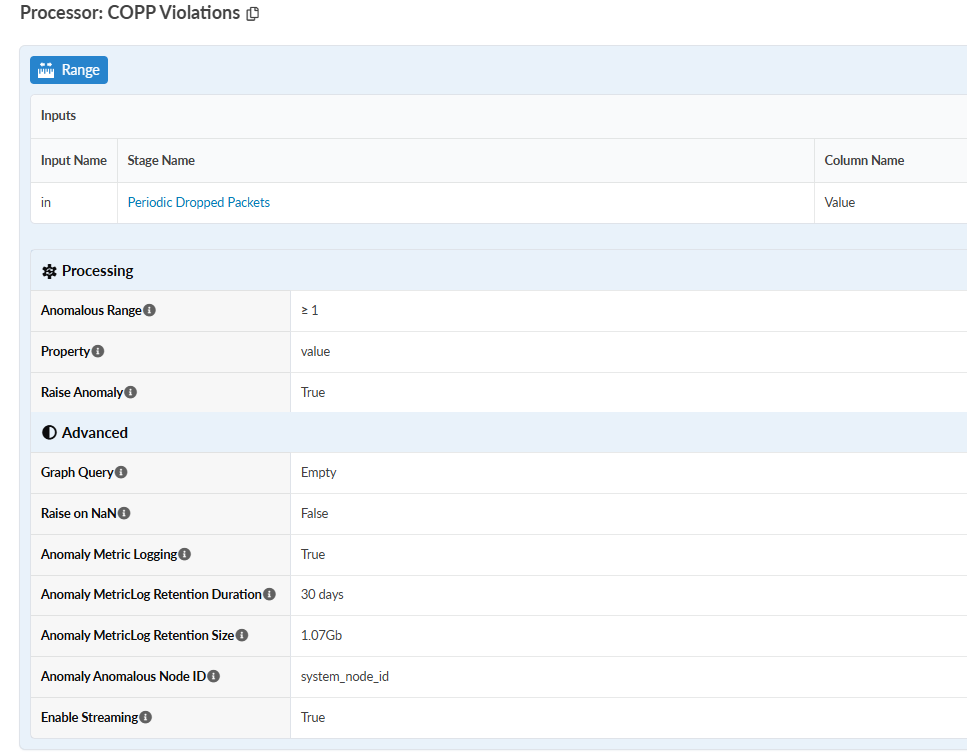
Range Processor
The Range Processor checks a value against a defined range. It can evaluate either the series value or a series aggregation, such as sum, average, last, standard deviation, or sample count.
COPP Violations
COPP violations raise anomalies if dropped packets exceed the Drop Count Threshold within the defined Aggregation Period.
An anomaly is raised if the Drop count threshold value specified in Probe Settings exceeds the Time Window. For example, a threshold of 1 and 300 seconds raises an anomaly after 1 dropped packet in 300 seconds. The anomaly clears if the counter stays below the threshold in the next time window.
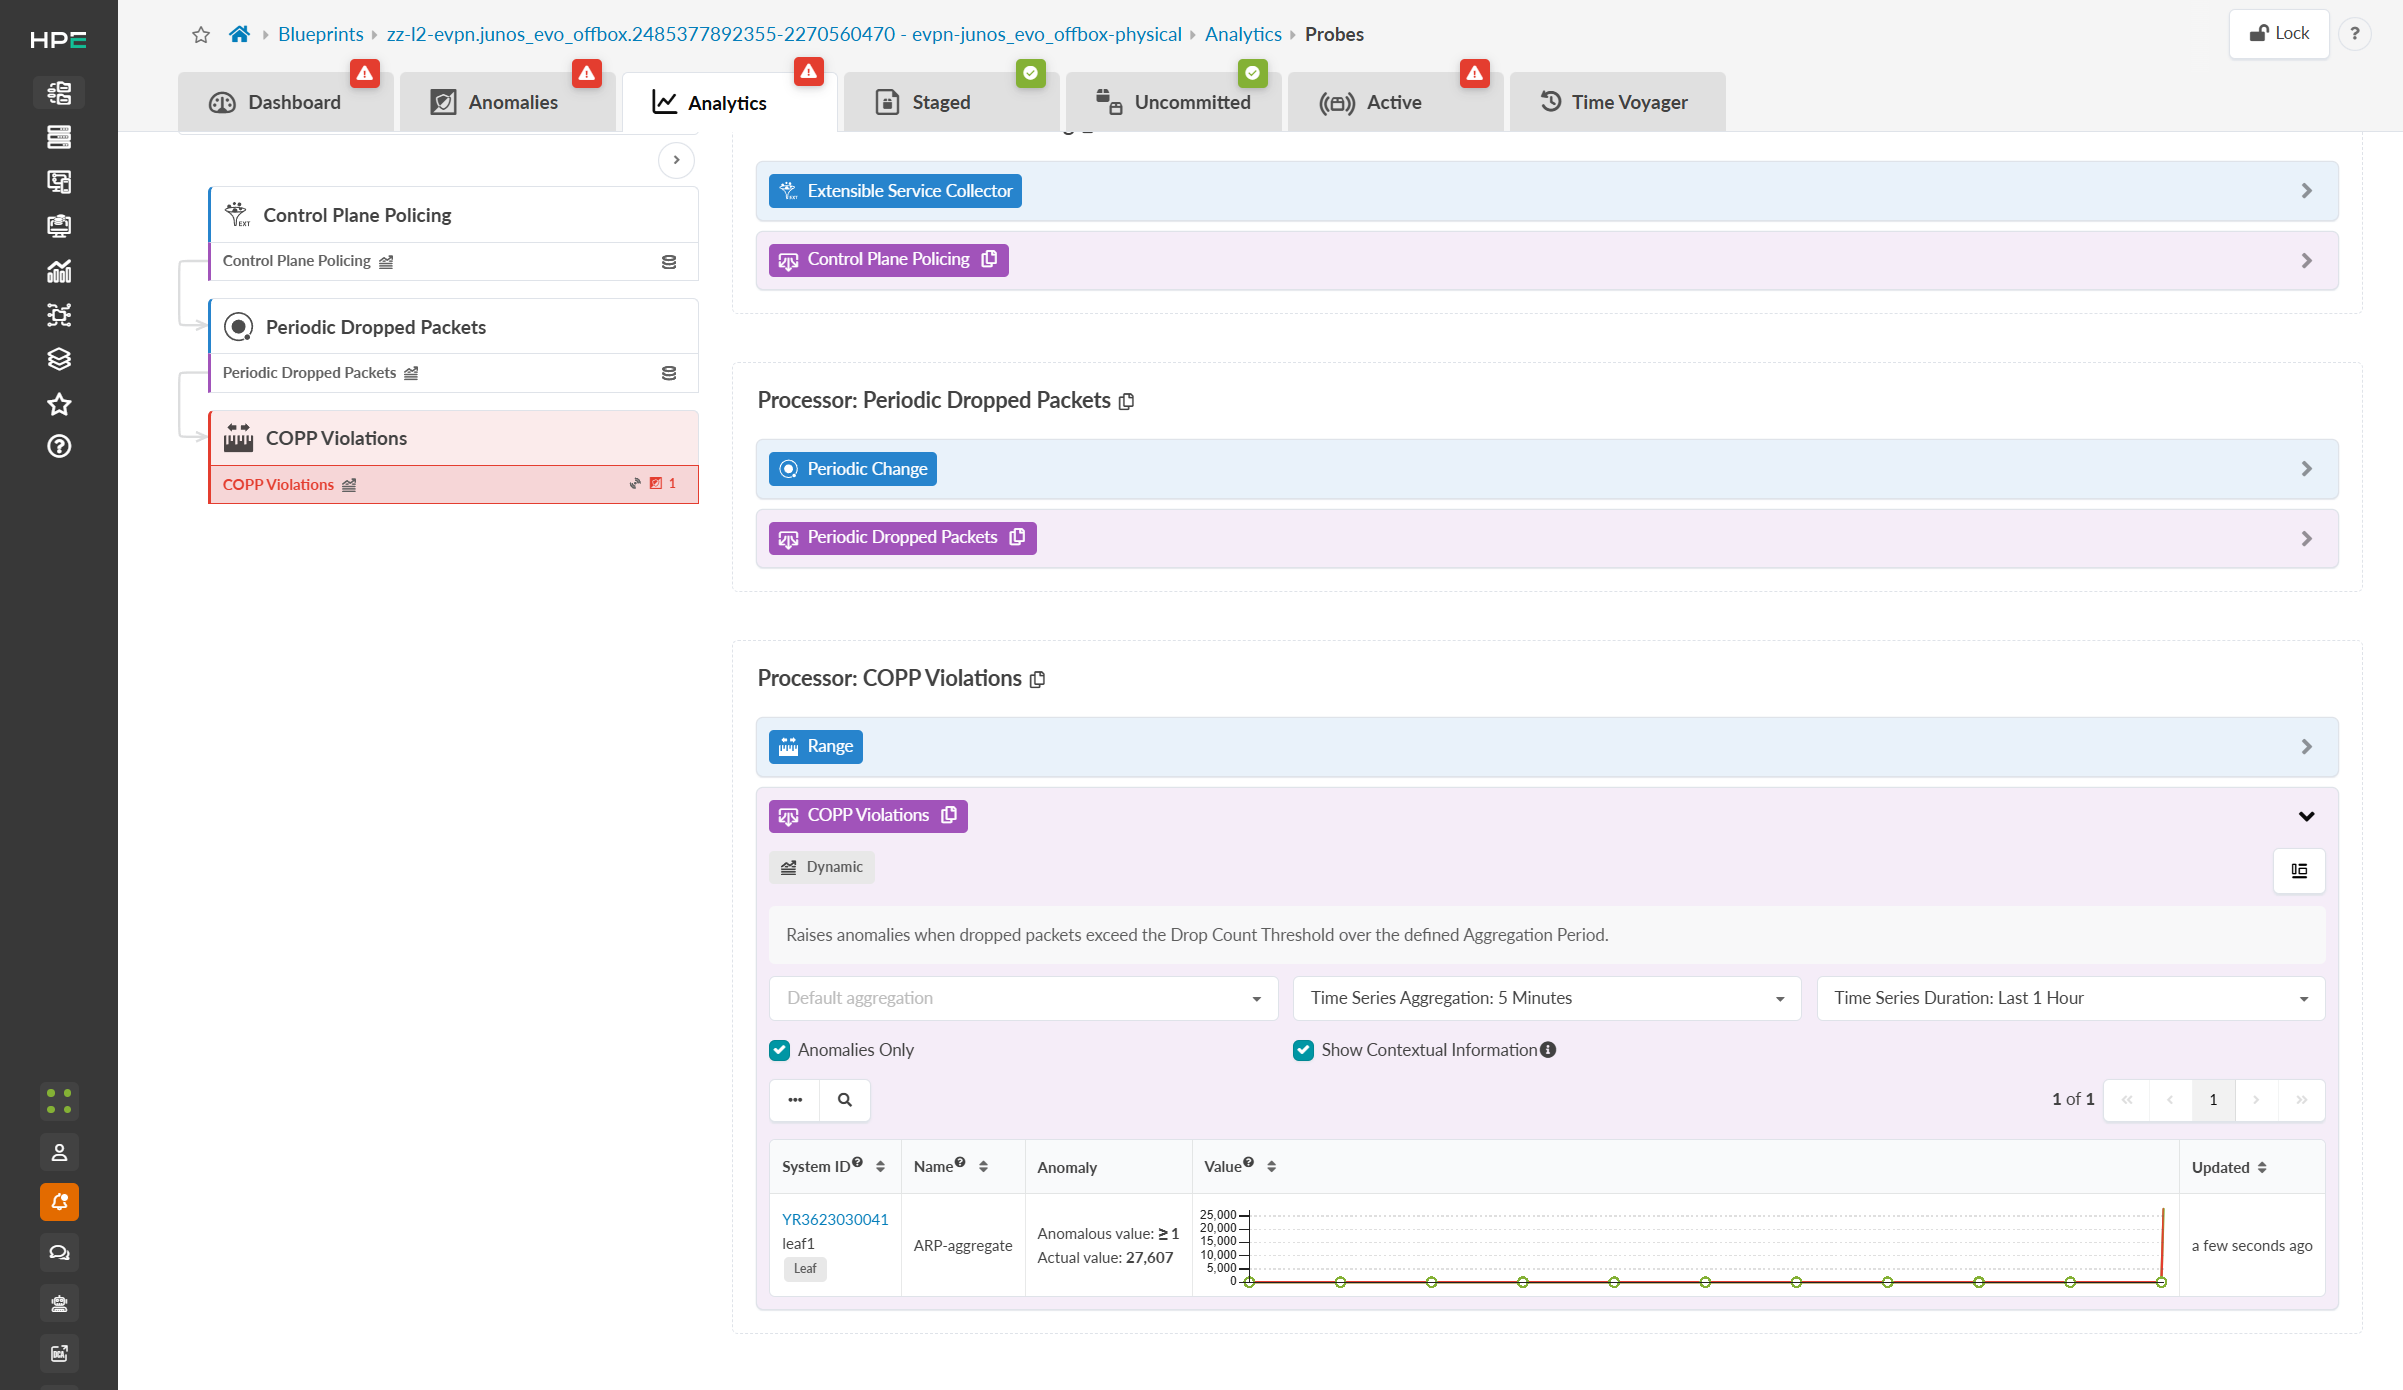
Here is an example of a COPP violation (filtered view), which occurs when ARP packets exceed the threshold within the specified time value.
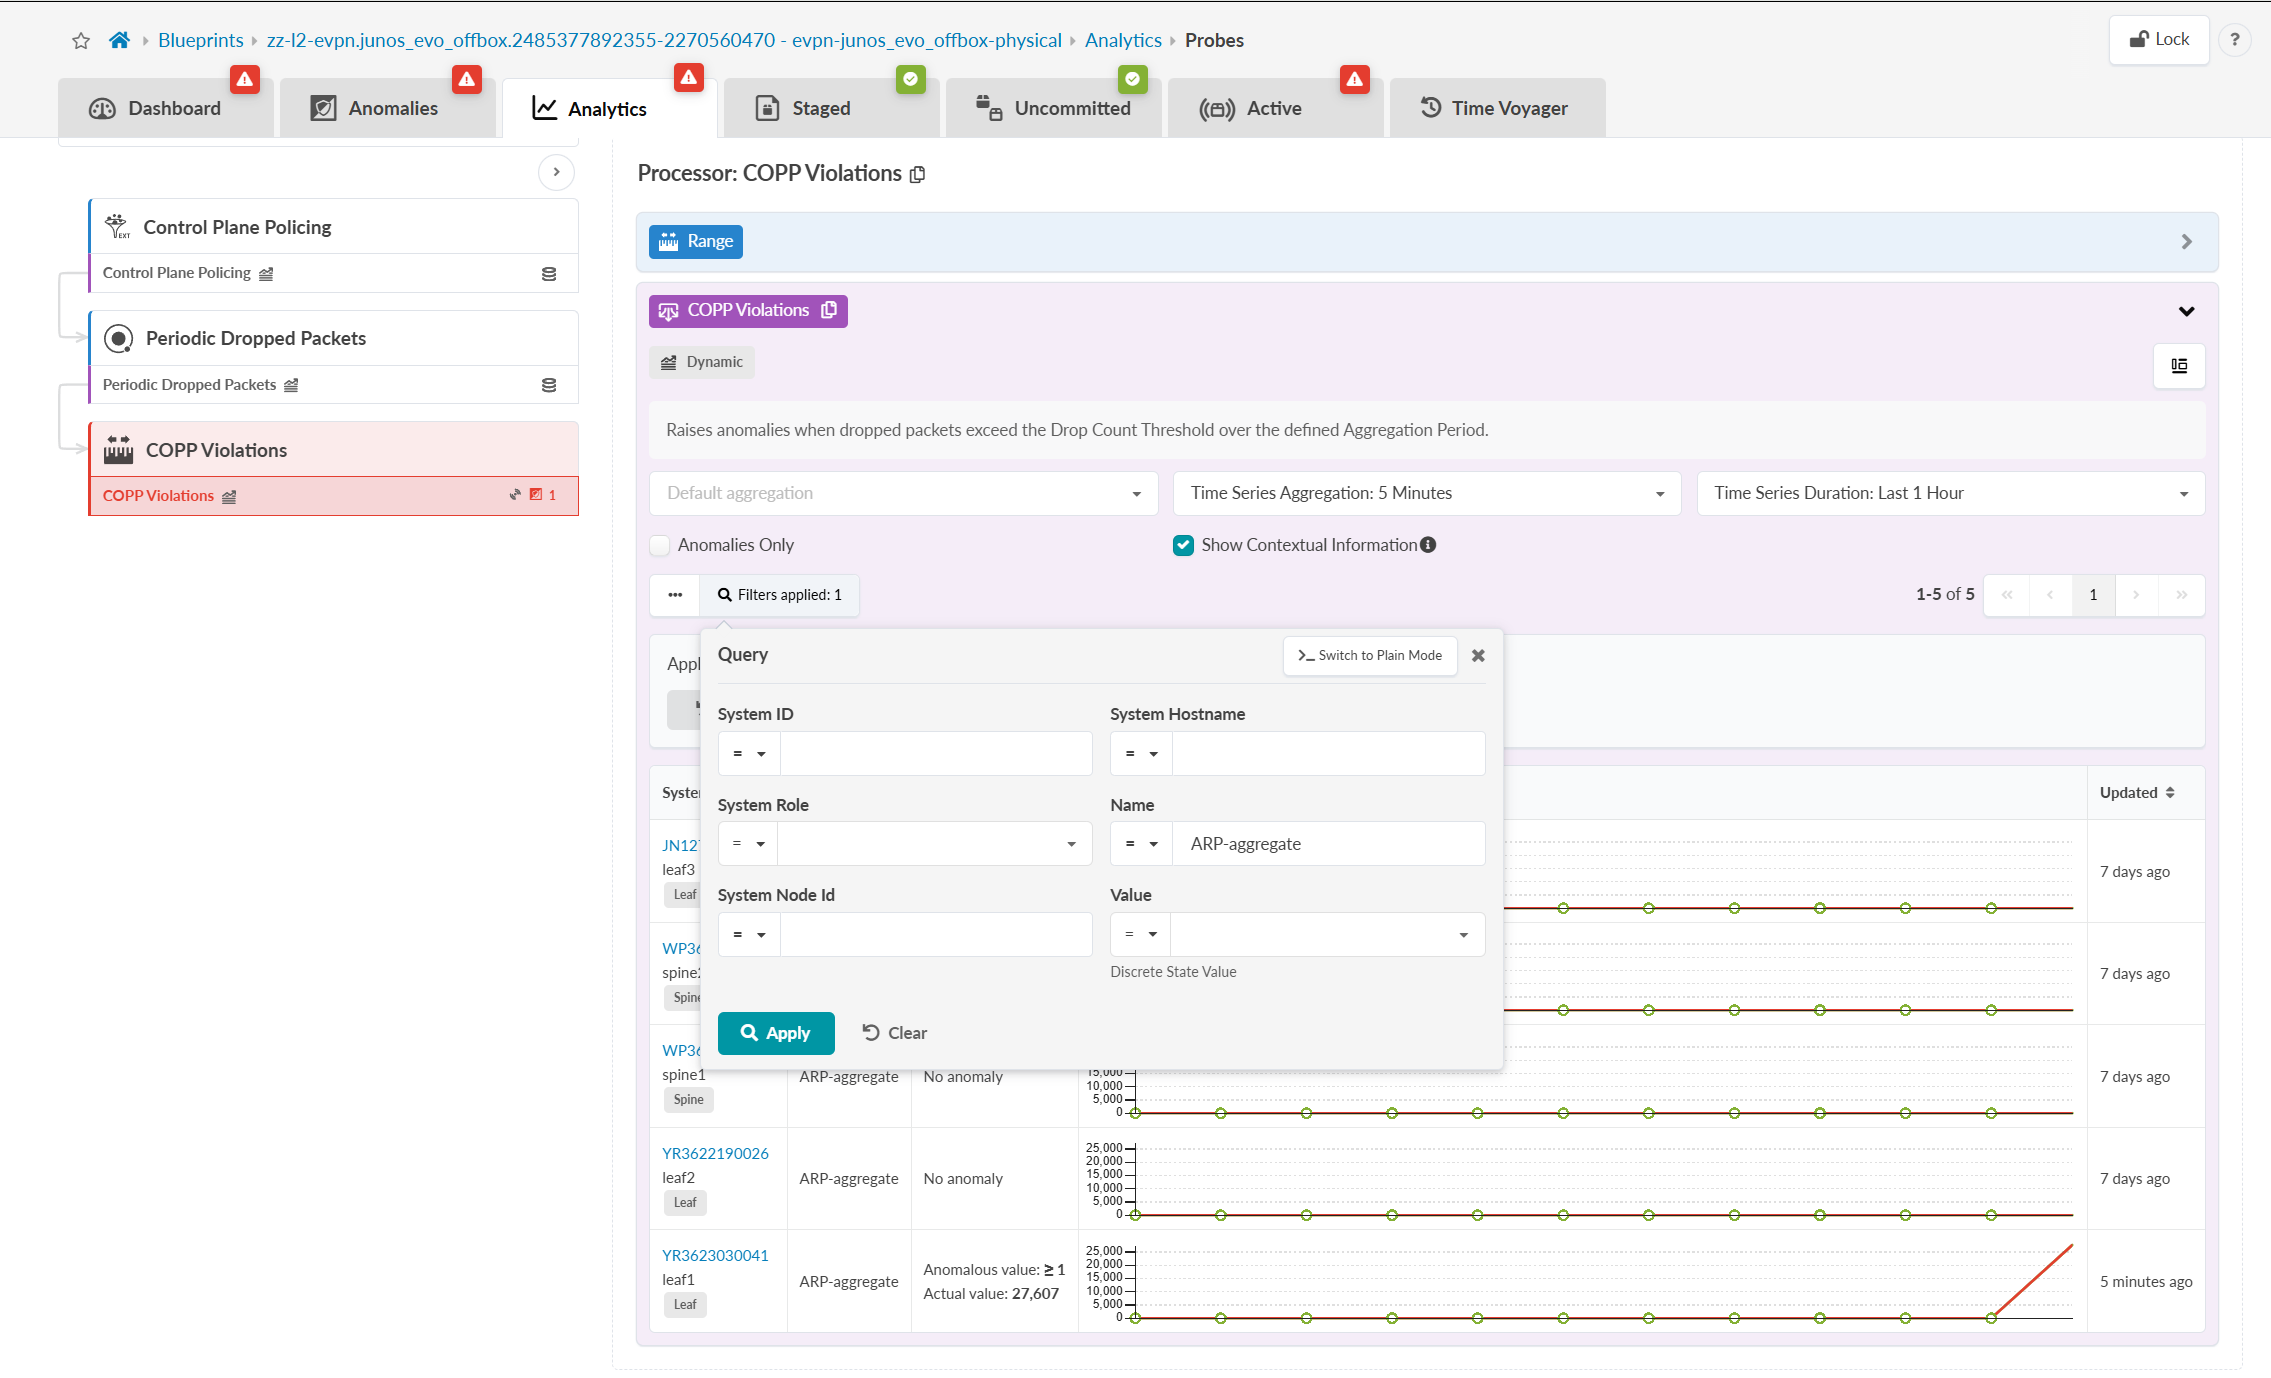
This example shows when the anomalies are resolved.