Anomalies History (Blueprint)
Use the Anomalies History page to monitor anomalies within a specified time period. Use advanced filtering options enable precise monitoring of anomaly history.
Use the history page to track trends, focus on specific intervals, and analyze historical occurrences of anomalies for improved troubleshooting and analysis. Anomaly history complements real-time anomaly detection (Current State) by offering historical context.
To view anomaly history in the GUI:
Select a blueprint and navigate to Anomalies > History within the blueprint.
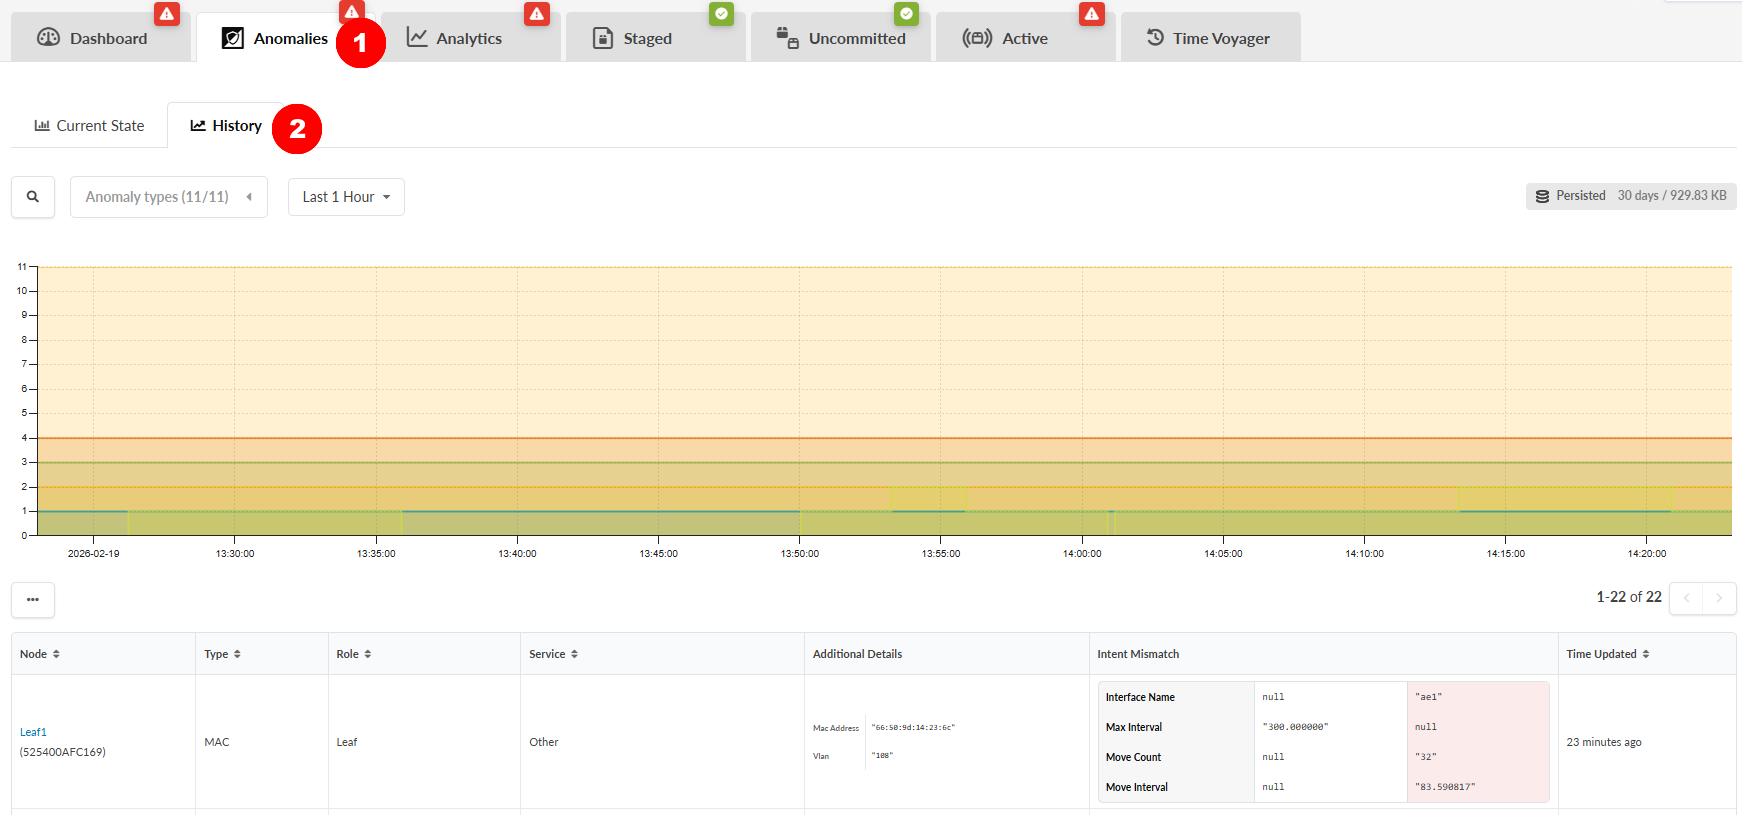
View Anomaly History
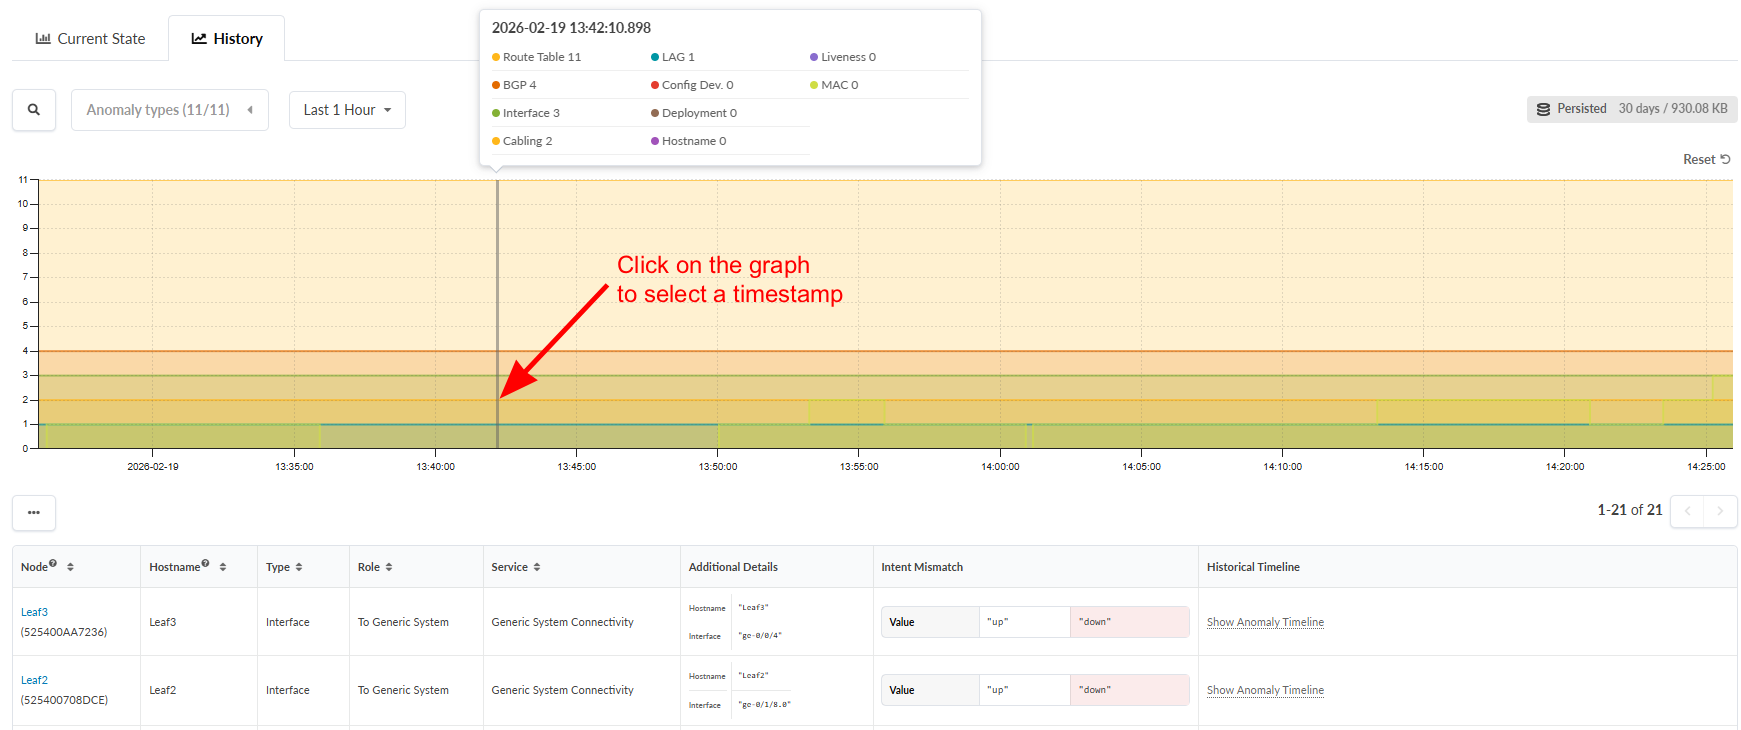
The default table displays anomaly data starting from the most recent saved event. Select a specific section of the graph to choose a timestamp and populate the table with anomaly data from the selected timestamp. Click on the Reset button above the graph to reset the selected timestamp.
Hover over the chart to display an overlay with additional details.
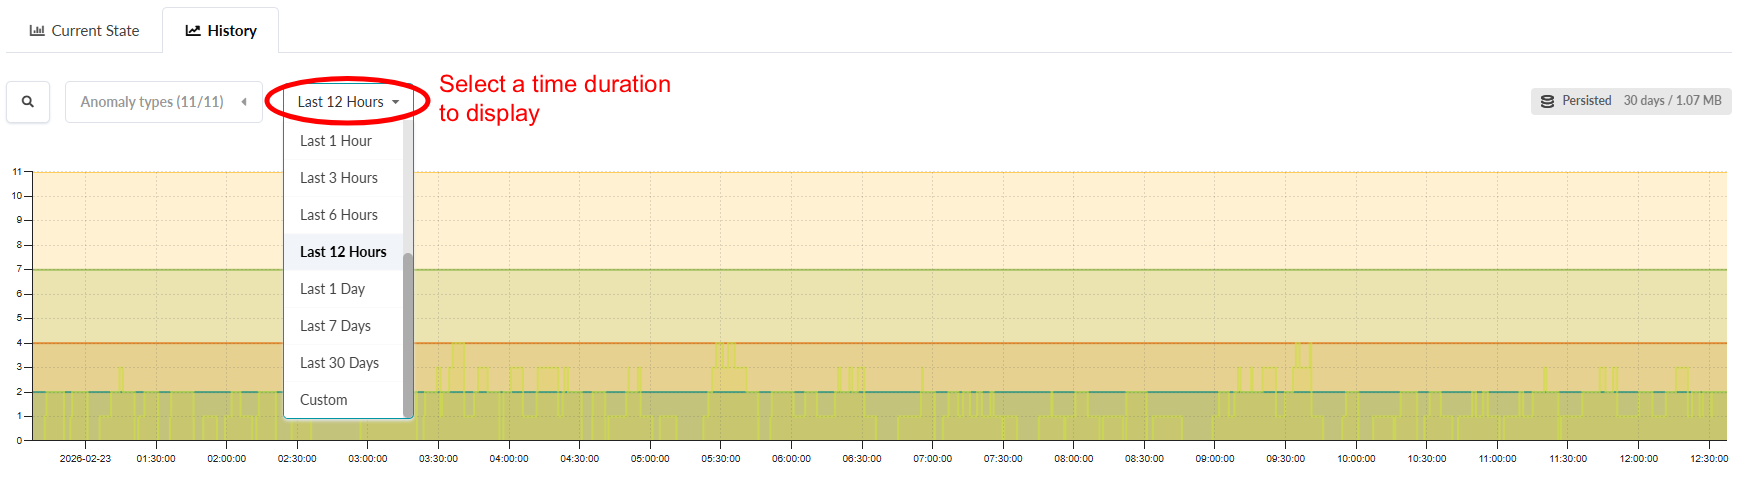
Use the drop-down menu and select a time duration to adjust the graph results. Scroll with your mouse wheel to navigate in or out through time on the graph.
Refine with Filters
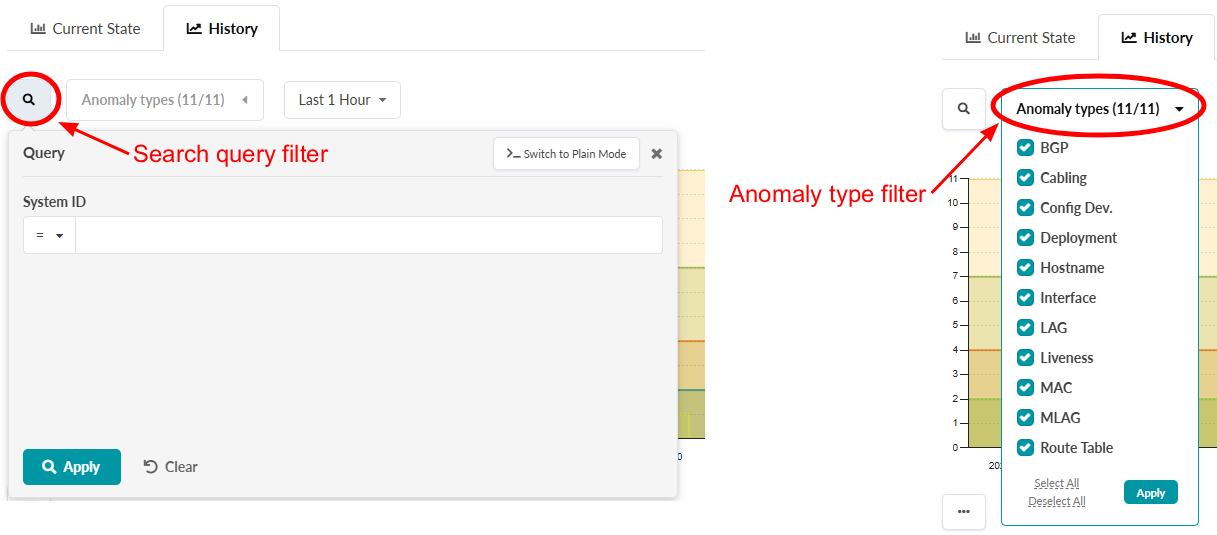
Further refine your anomaly search using filters. You can use one or both available filtering methods. The filtered results display in both the anomaly timeline graph and anomalies table.
The search query filters by the system ID. Locate the system ID under the device name in the Node column of the anomalies table. Select a search parameter from the drop-down menu to apply to your search. The search parameters include or exclude specific system IDs from the results displayed in the anomalies table. Enter a system ID into the field next to the drop-down menu and select Apply.
-
Select an appropriate search parameter, then input a System ID in the query to narrow down the results.
Use the Anomaly types filter to show or hide service anomalies by type. The filtered results are displayed in the anomalies table.
-
Filter by specific anomaly using the Anomaly types filter.
Expanded Anomaly Timeline
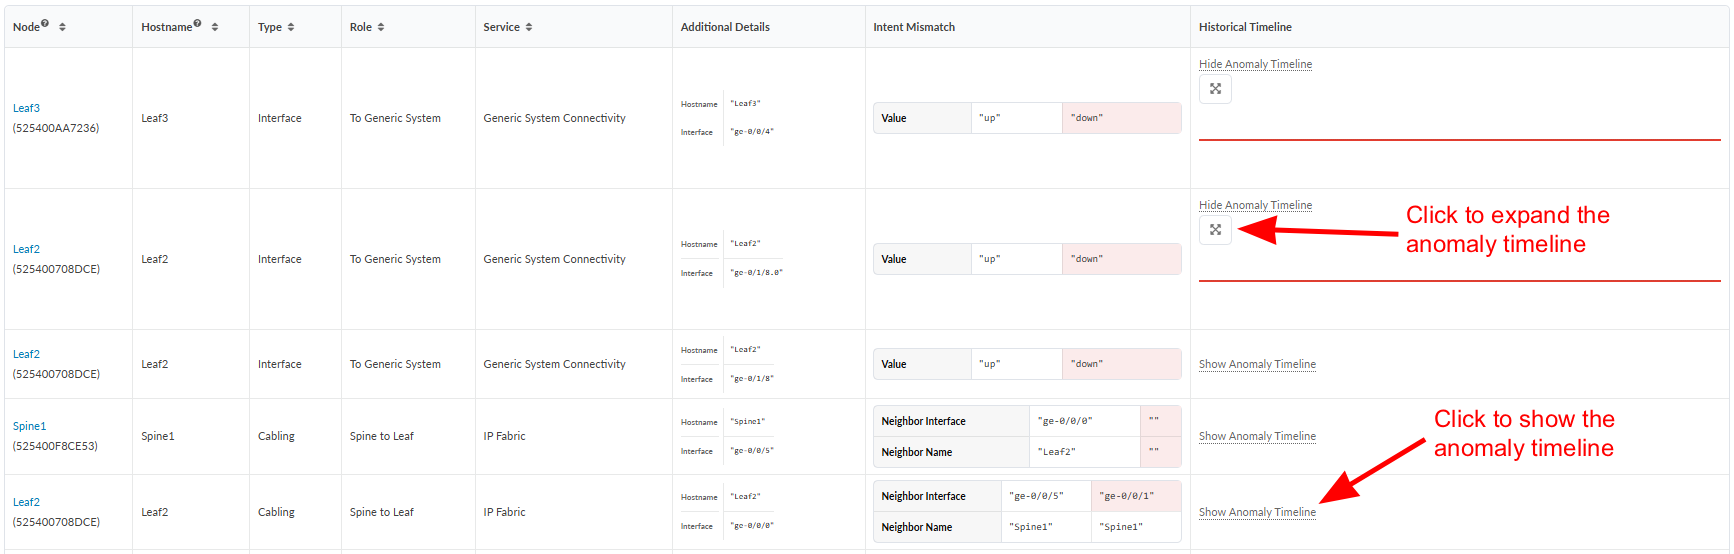
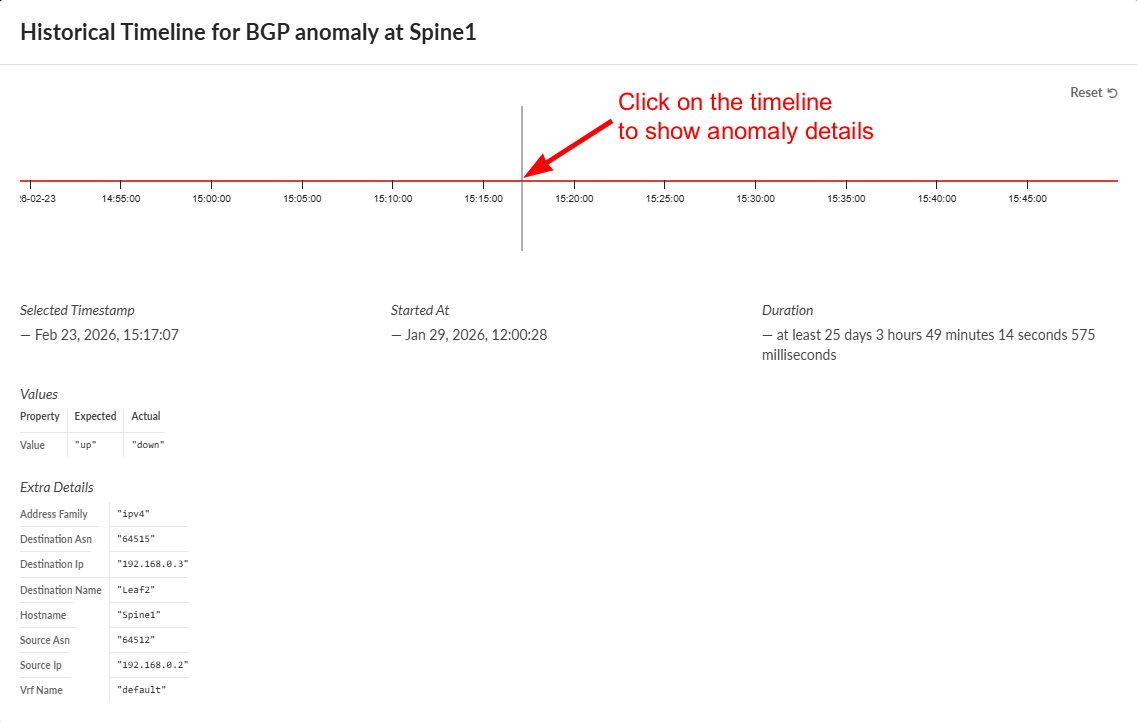
Use the anomaly's historical timeline to perform troubleshooting activities and correlate the anomaly with network changes or events that occurred over a specific period. You can view the anomaly's start time and its duration. Additional details are displayed in the expanded anomaly timeline window.
To show an expanded anomaly timeline:
Select a timestamp on the anomaly timeline graph. This will populate the table with the Historical Timeline column.
Click Show Anomaly Timeline in the Historical Timeline column of the table.
Click Show expand anomaly timeline to open the anomaly timeline in a new window.
Click any location on the anomaly timeline to see additional anomaly data. Click on the Reset button to reset the timestamp selection.
View Anomalies by Node
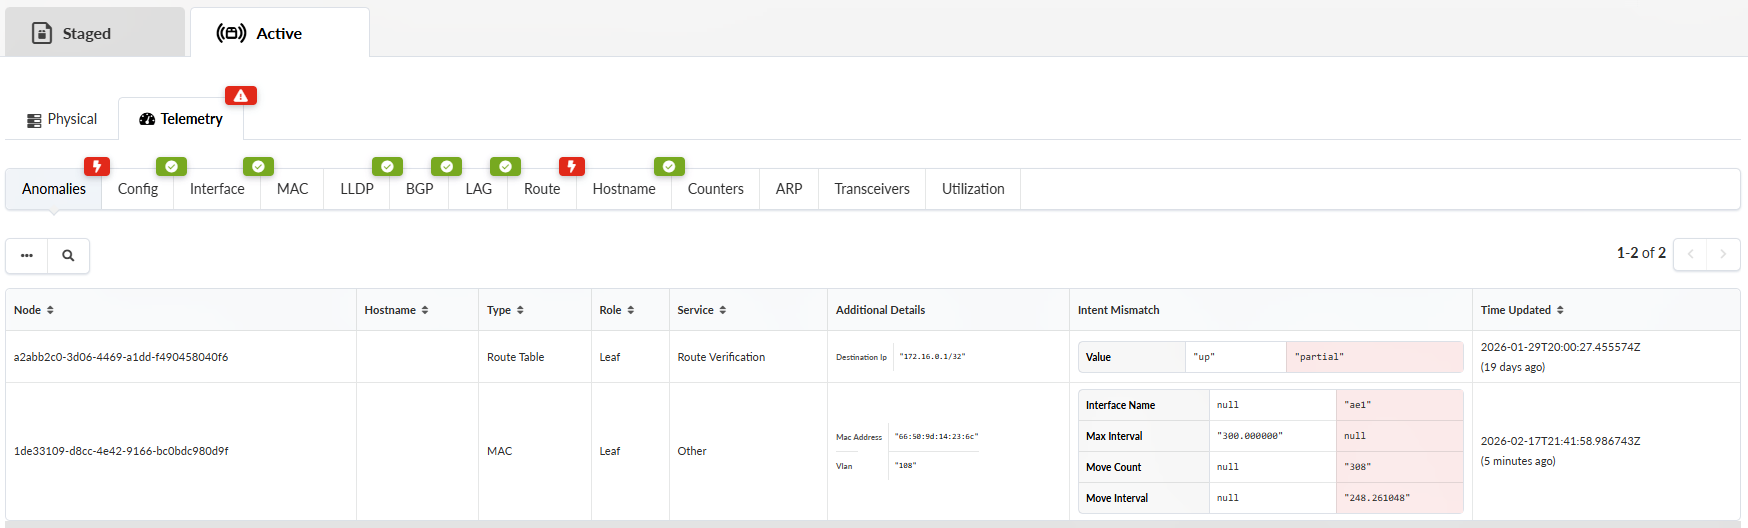
Click on a device from the anomaly table Node column to go to its telemetry page. The Anomalies tab under Telemetry displays all related device anomalies
You can also reach the device telemetry section by:
Use the left navigation menu in the GUI. Navigate to Devices > Managed Devices. Click the Management IP of the device to view.
Click the Telemetry tab to open the Telemetry details page
Click on the Anomalies tab Telemetry > Anomalies. All anomalies (indicated in red) from the telemetry services are aggregated under the Anomalies tab.