Launch the Apstra DC Director Flow Dashboard

Congratulations! You successfully installed and configured Apstra Data Center Director Flow on your network. Now you're ready to launch the Apstra DC Director Flow dashboard.
Note:

You can also access the Apstra DC Director Flow dashboard directly from your blueprint in the Apstra DC Director GUI. See Access the Apstra DC Director Flow Dashboard from the Apstra DC Director GUI for instructions.

To launch the Apstra DC Director Flow dashboard:
  1. From your browser, enter the IP address or hostname of your Apstra DC Director Flow VM.
    https://<ip-or-hostname-of-flow-data-vm>:5601/
  2. Log in to the Apstra DC Director Flow dashboard using the OpenSearch credentials you created during the initial configuration, see step b. in Configure Your OpenSearch Password.
  3. From the OpenSearch Dashboards page, click Dismiss.
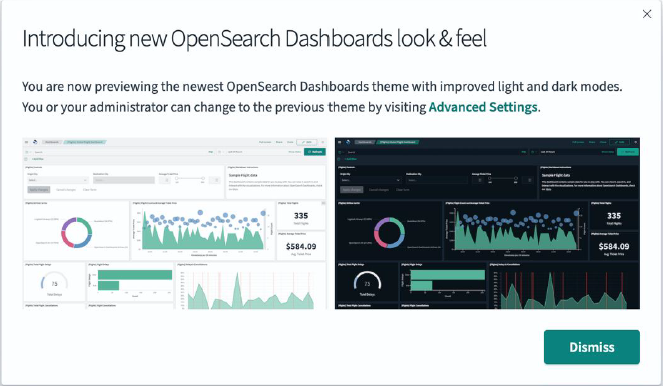
    OpenSearch Dashboards announcement showcasing new light and dark themes with option to revert in Advanced Settings.
  4. Select Global as your tenant and click Confirm.
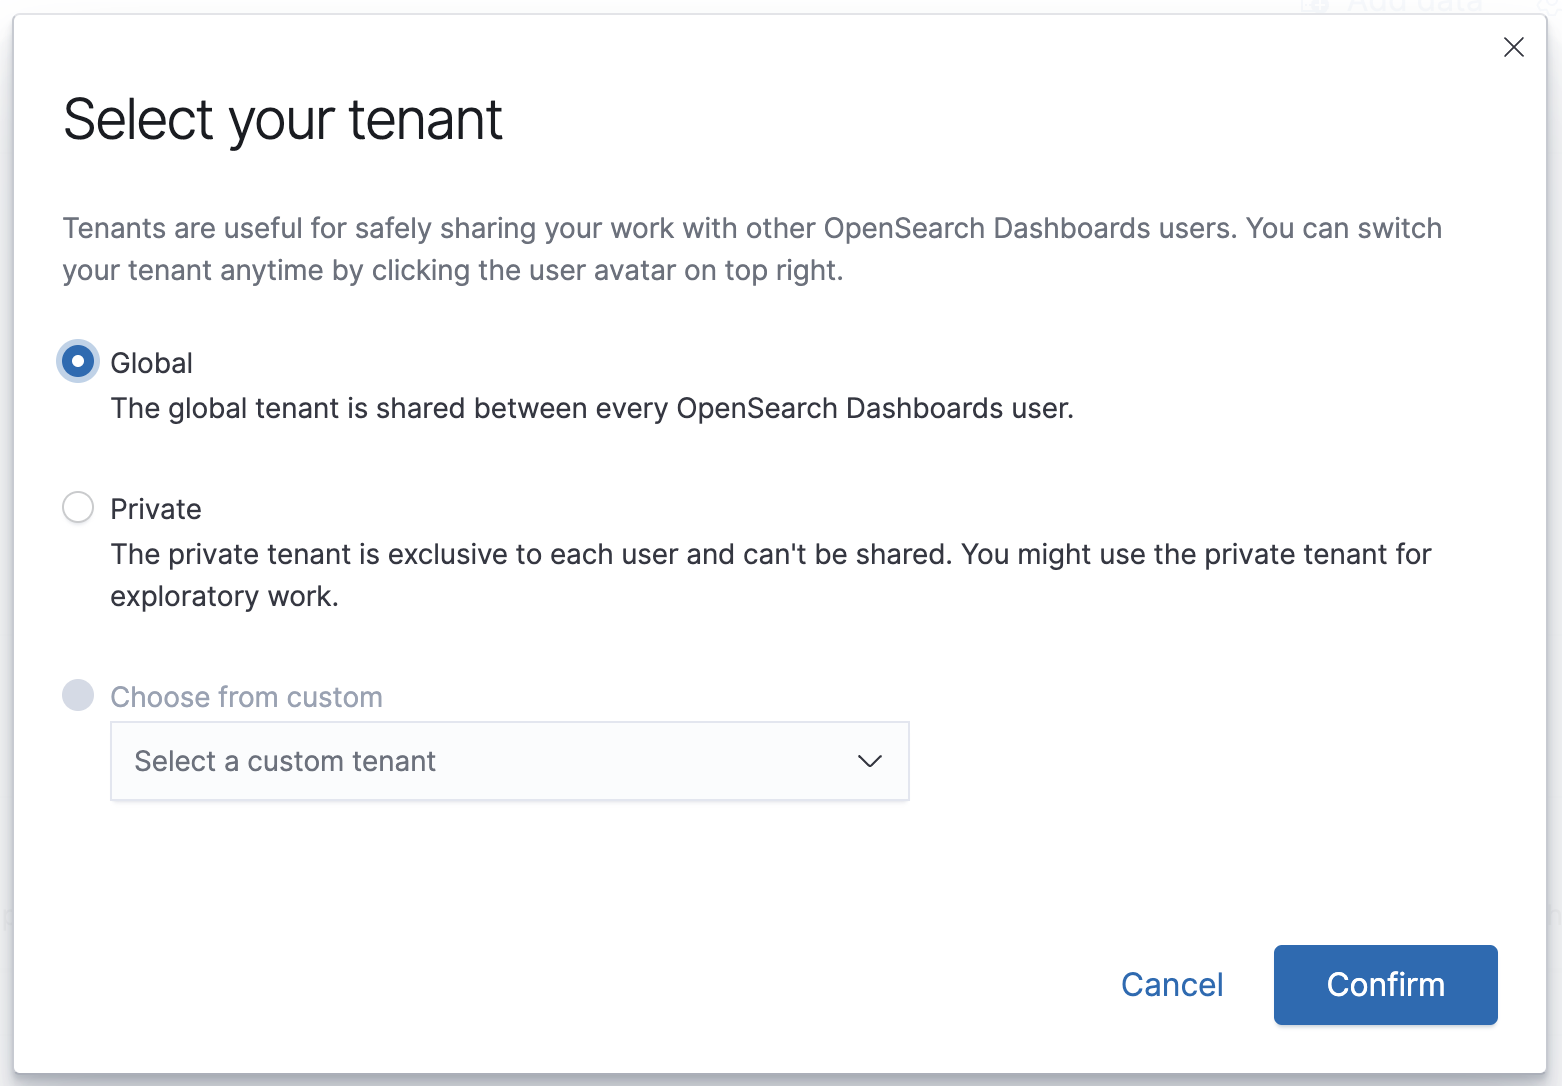
    OpenSearch Dashboards dialog to select a tenant with Global selected; options are Global, Private, and Custom Tenant. Cancel and Confirm buttons at the bottom.
  5. Select Anaylze data in dashboards.
    Juniper Apstra logo with text: Visualize and analyze. Right side: Analyze data in dashboards, Search and find insights.
  6. Select Dashboard from the OpenSearch Dashboards page.
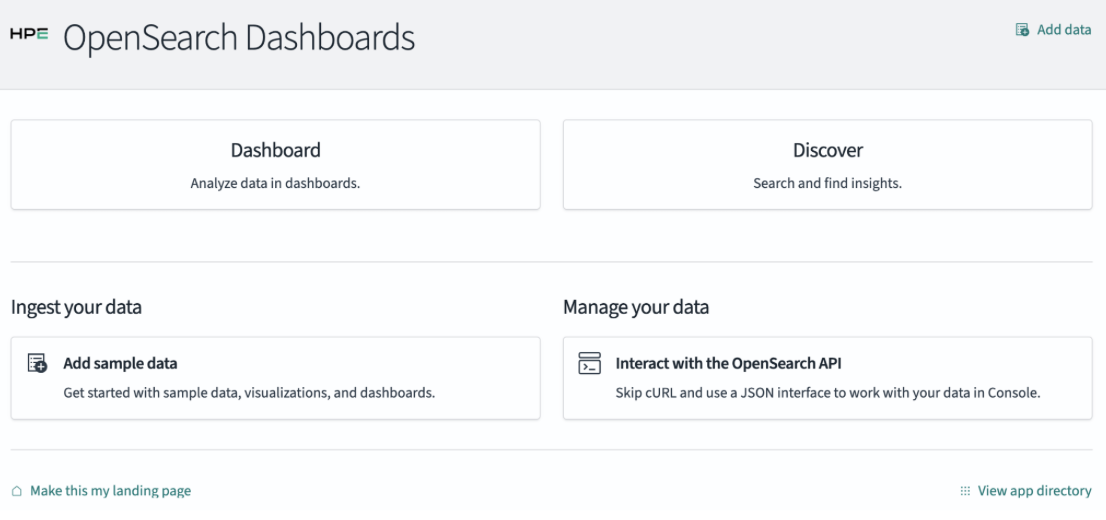
    Main interface of HPE OpenSearch Dashboards showing sections for analyzing data in dashboards, discovering insights, adding sample data, managing data via OpenSearch API, and additional options for app settings and data ingestion.
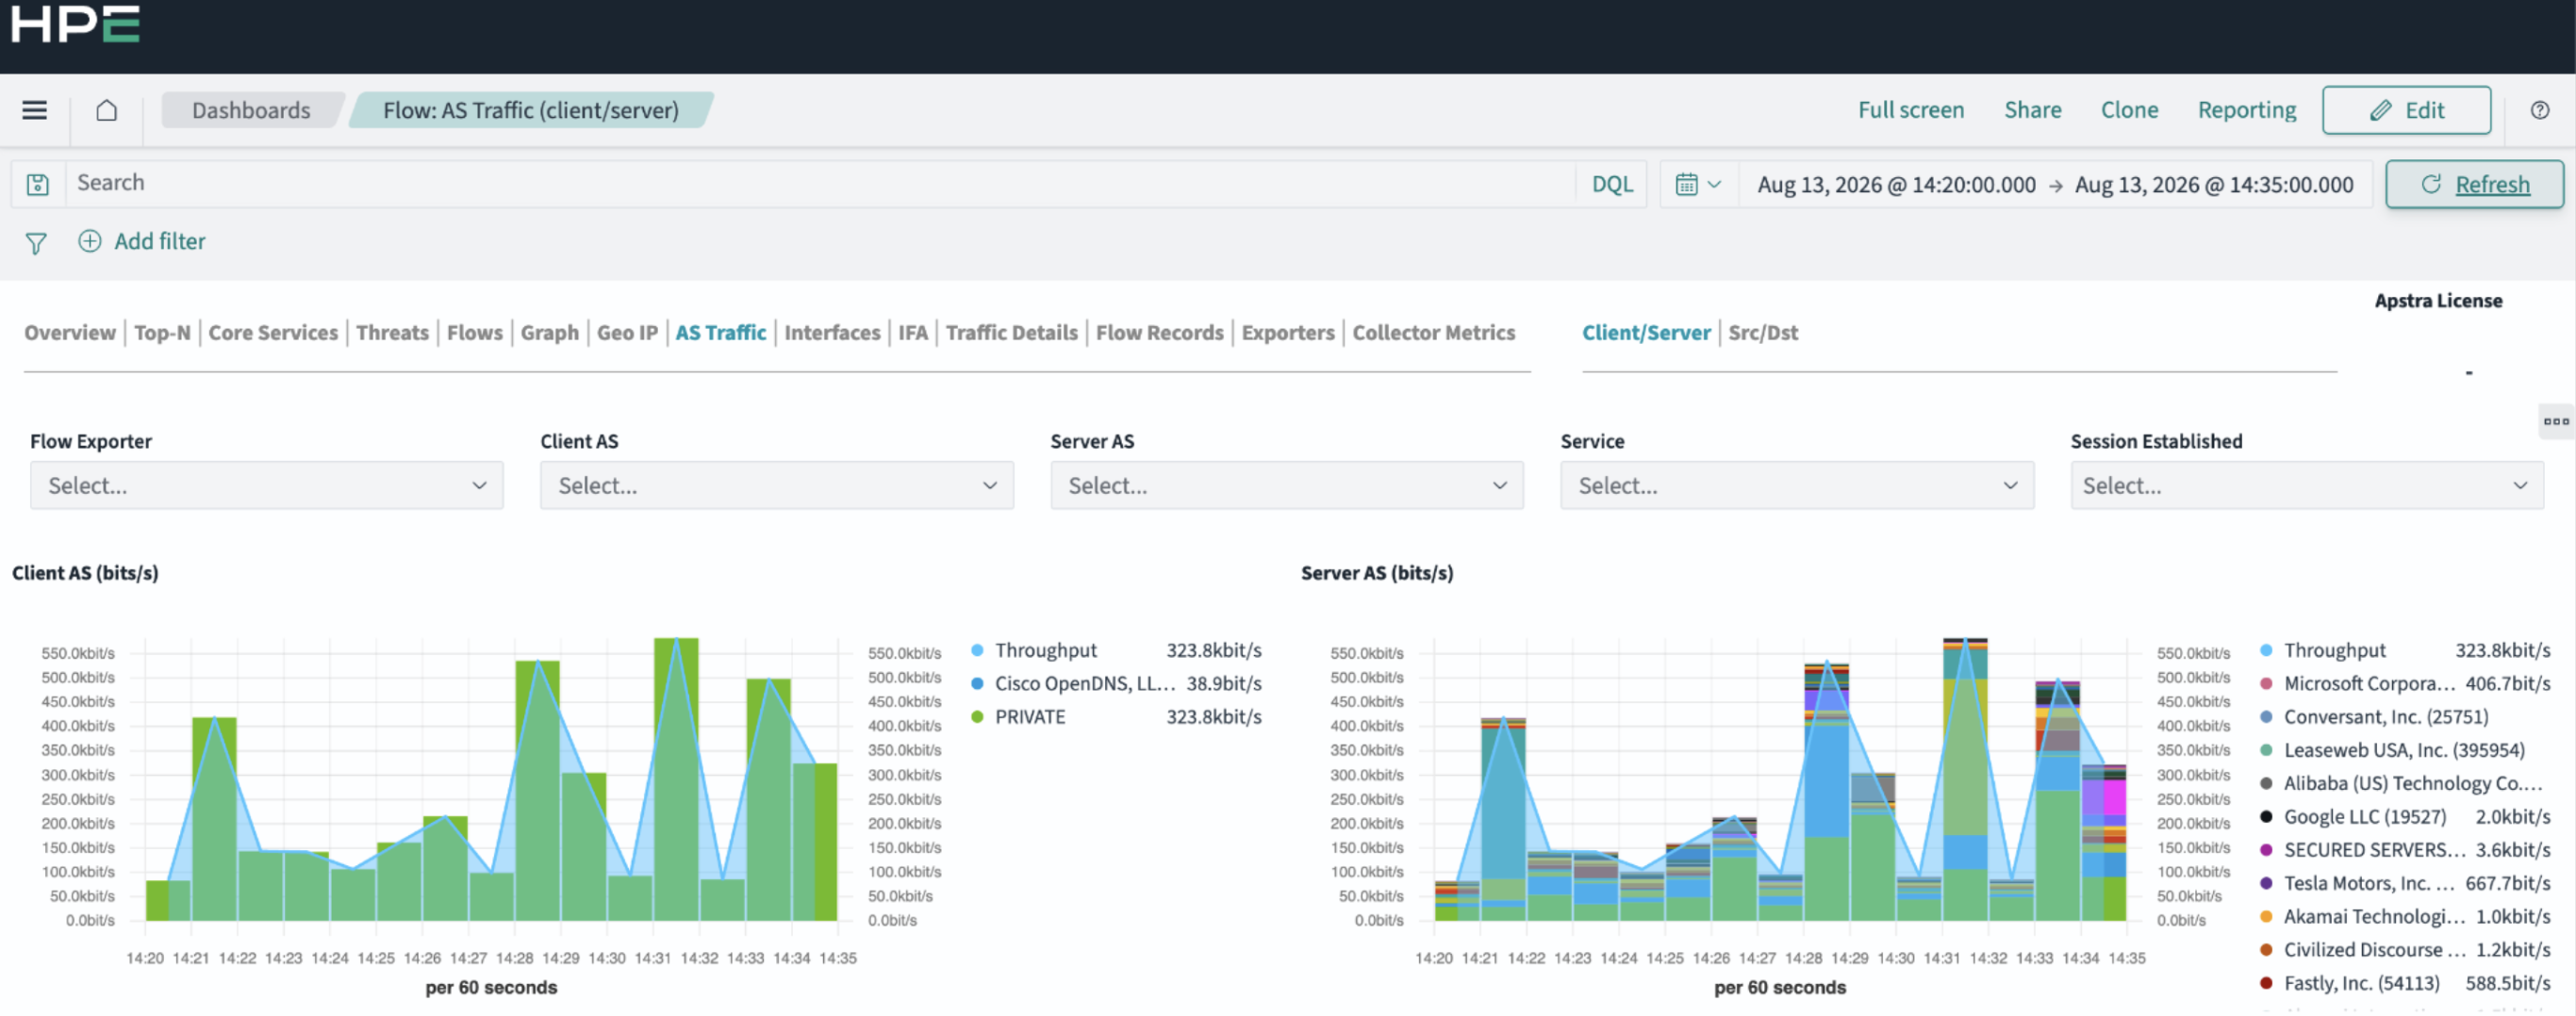
  7. Select a dashboard from the list of predefined dashboards or create a new one. For example: Flow: AS Traffic (client/server).
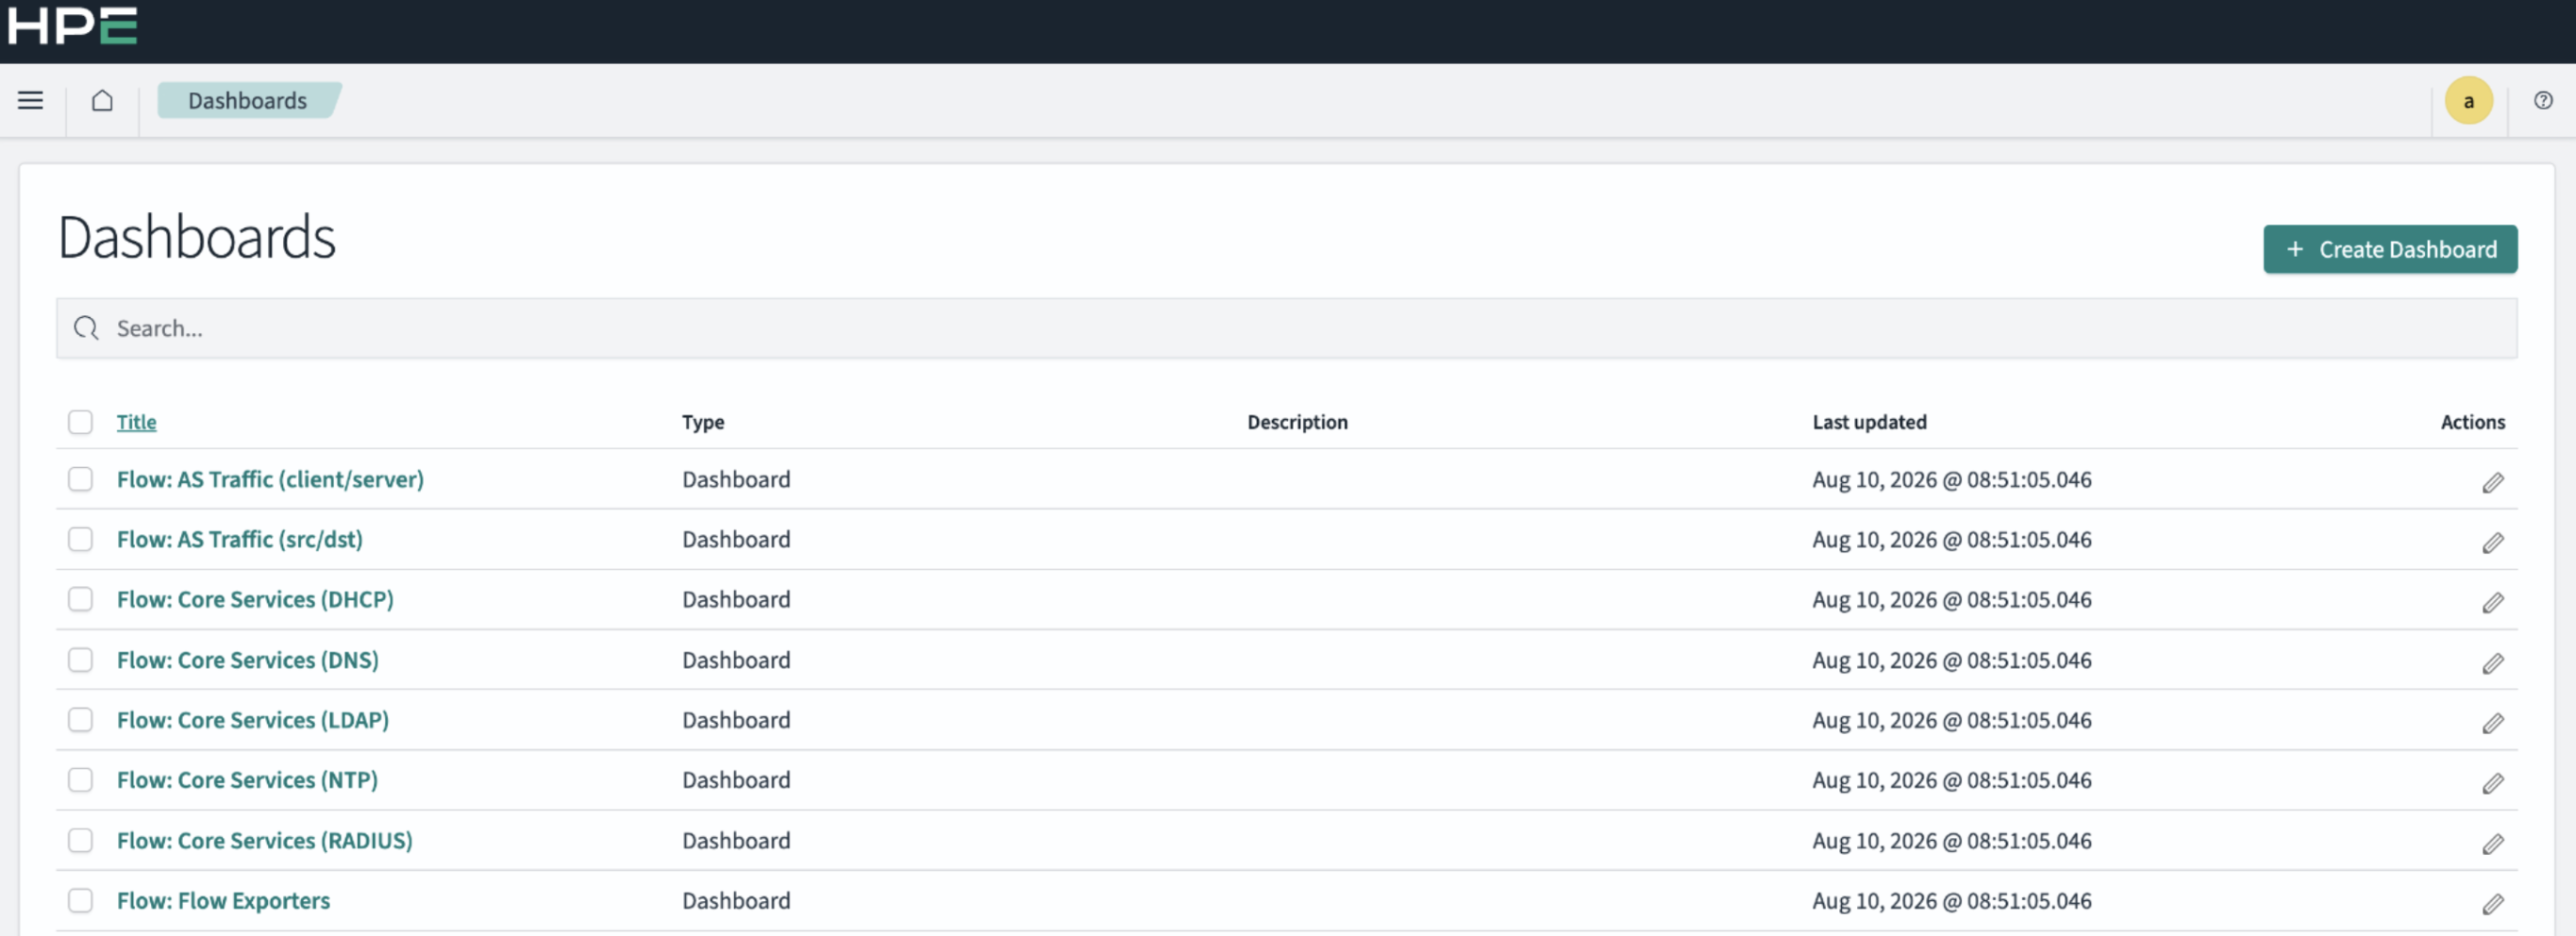
    Dashboard interface showing a list of dashboards with titles, types, descriptions, last updated timestamps, and actions. Includes a Create Dashboard button and a search bar for filtering dashboards.HPE network analytics dashboard labeled Flow: AS Traffic client/server showing network traffic graphs for Client AS and Server AS over time, with color-coded bars, entity legend, filters, and metrics for throughput analysis.
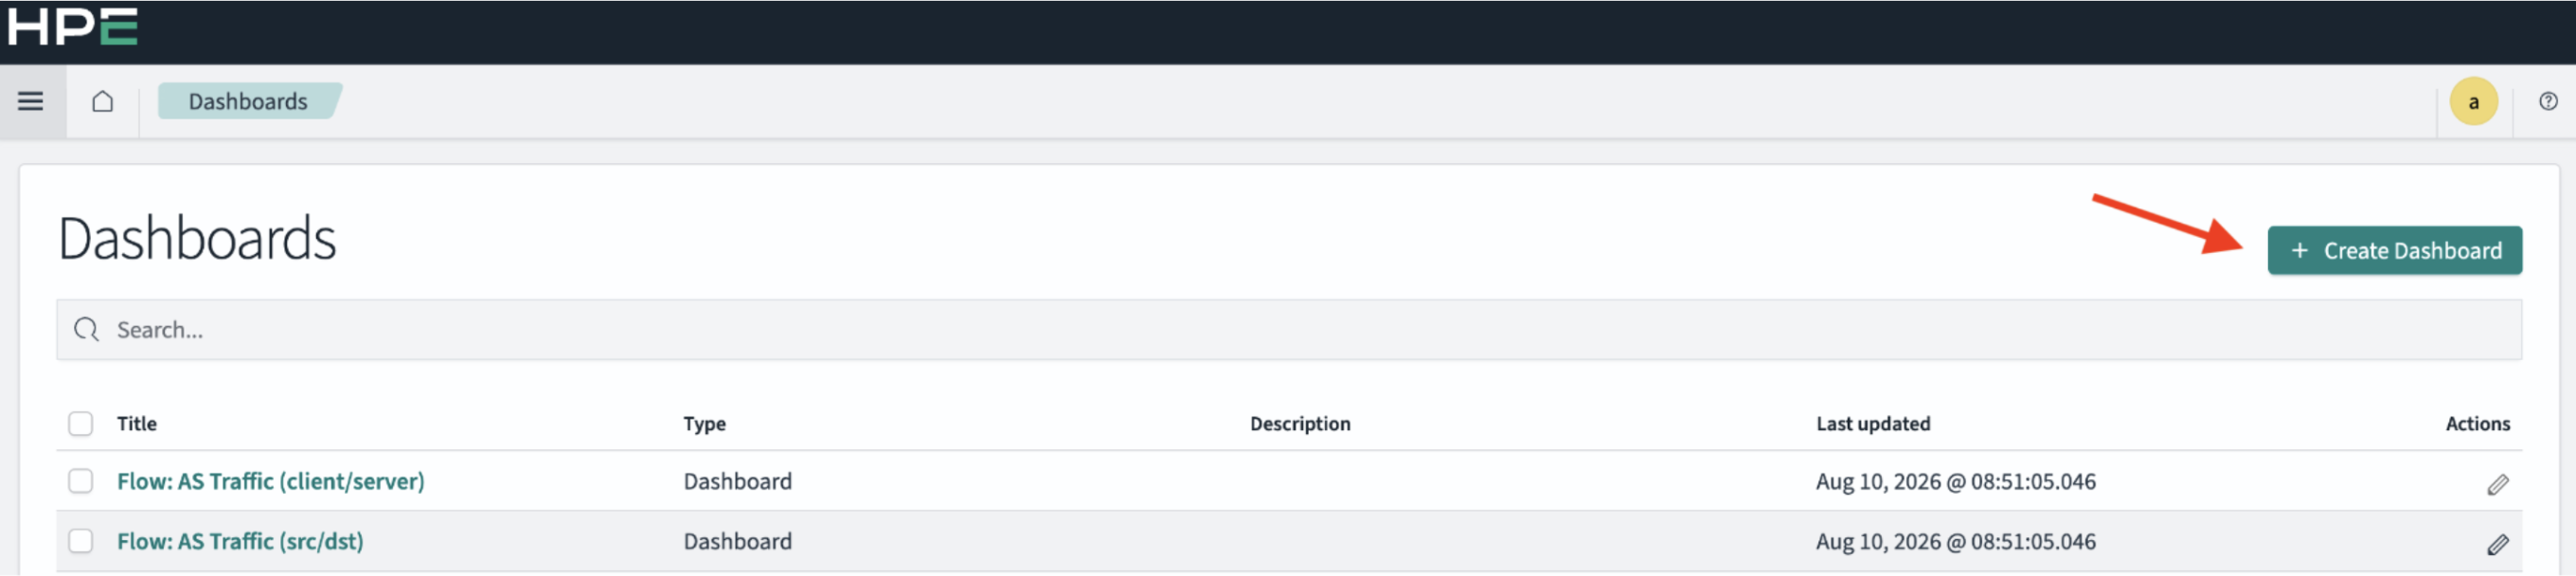
  8. Alternatively, you can add an existing or new object to your dashboard or create a new one. From the Dashboards page, click Create Dashboard. HPE application interface for managing dashboards, showing a header with HPE logo and Dashboards label, search bar, table listing dashboards by title, type, description, and last updated, and a green Create Dashboard button with a red arrow indicating it.
  9. Add a new or existing object from the Edit New Dashboard page. User interface for creating or editing a dashboard in an HPE application with navigation bar, search bar, add filter option, and button labeled Create new to add objects.
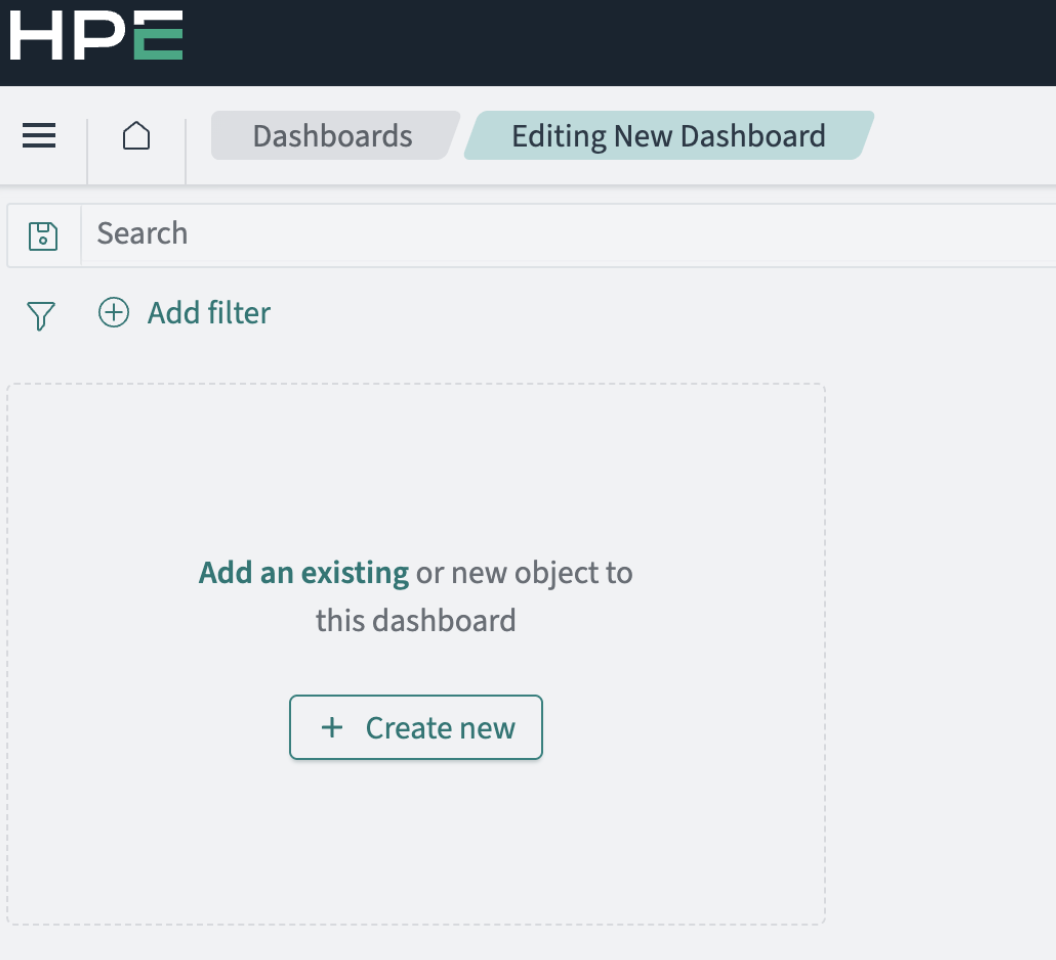
    • To add an exisiting object, select an object under Add panels.
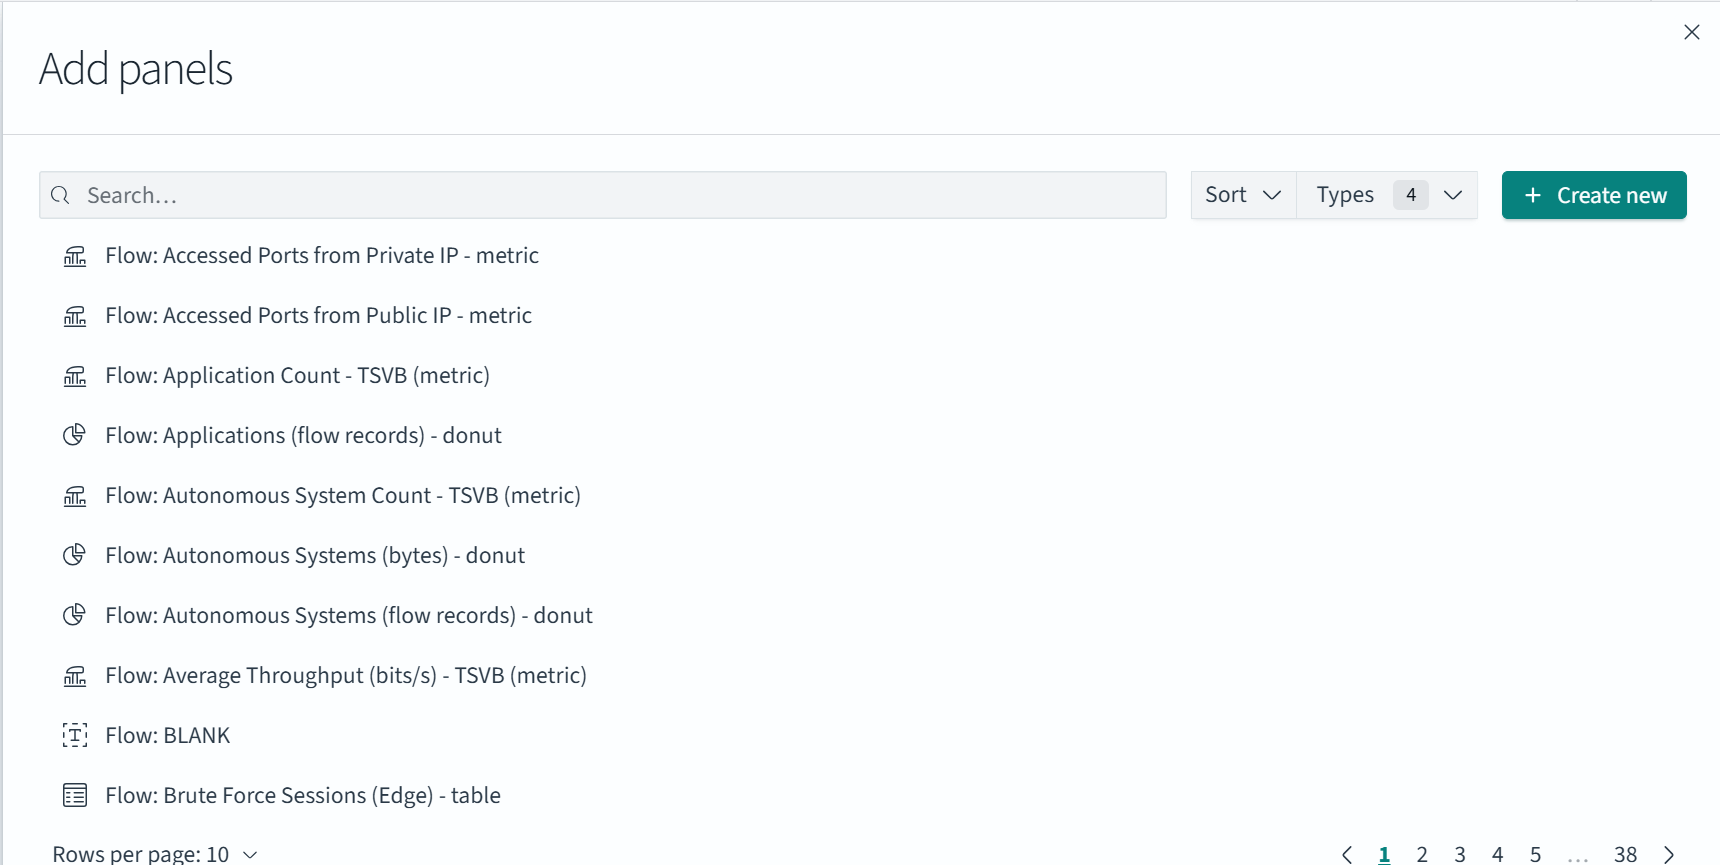
      User interface for adding panels with options like metrics, TSVB, donuts, and tables, a search bar, sorting, filtering, create new button, and pagination for 38 pages.
    • To add a new object, click Create new. Select a visualization type, such as a pie chart or bar graph, and then apply it to a source such as the Flow Records (client-server) type dashboard.
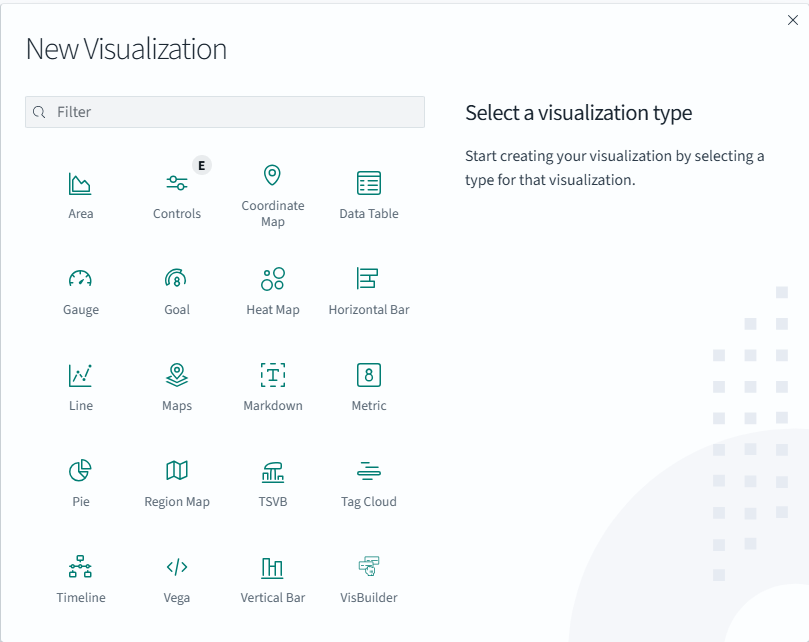
      User interface for creating a new visualization with options like Area, Controls, Coordinate Map, Data Table, Gauge, Goal, Heat Map, Horizontal Bar, Line, Maps, Markdown, Metric, Pie, Region Map, TSVB, Tag Cloud, Timeline, Vega, Vertical Bar, and VisBuilder. Prompt reads Select a visualization type.
  10. Select Overview from a Dashboard to open the Flow:Overview dashboard. Each tab in this dashboard provides a distinct view of your network traffic.
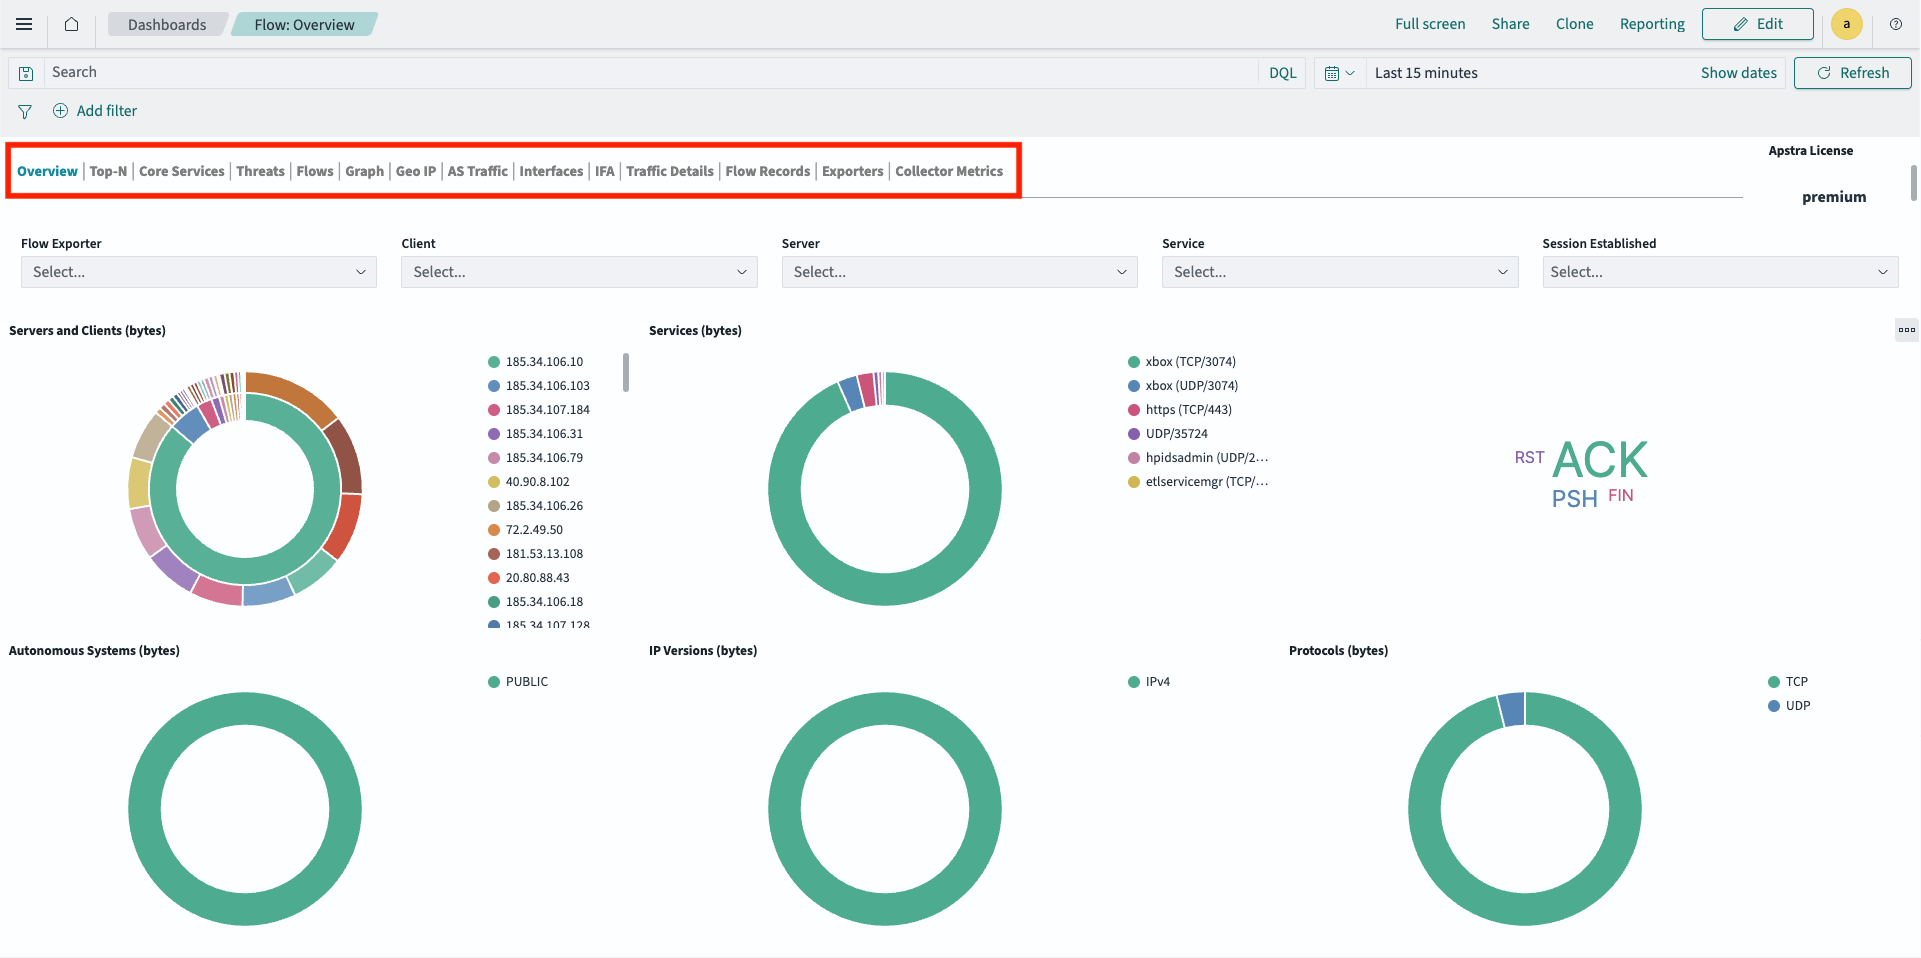
    Network monitoring dashboard titled Flow: Overview with tabs for navigation, filters for data refinement, donut charts for traffic metrics, a word cloud for TCP flags, a time range selector, and action buttons for interaction.

Access the Apstra DC Director Flow Dashboard from the Apstra DC Director GUI

Although Apstra DC Director Flow has its own dashboard, you can also link directly to the dashboard from the Apstra DC Director GUI.
To access the Apstra DC Director Flow dashboard from the GUI:
  1. From the left navigation menu in the GUI, select Analytics > Flow Data > Flow Collector > Create Flow Collector.
  2. Enter the collector name, IP address, username and password and click Create. Use the CLI password you used to access the Flow VM.
    This information tells Apstra DC Director where your VM is located so you can access the flow collector and visualization dashboards.
    Note: Adding the flow VM allows you to collect show_tech files from Apstra DC Director and relevant logs from the flow VM.
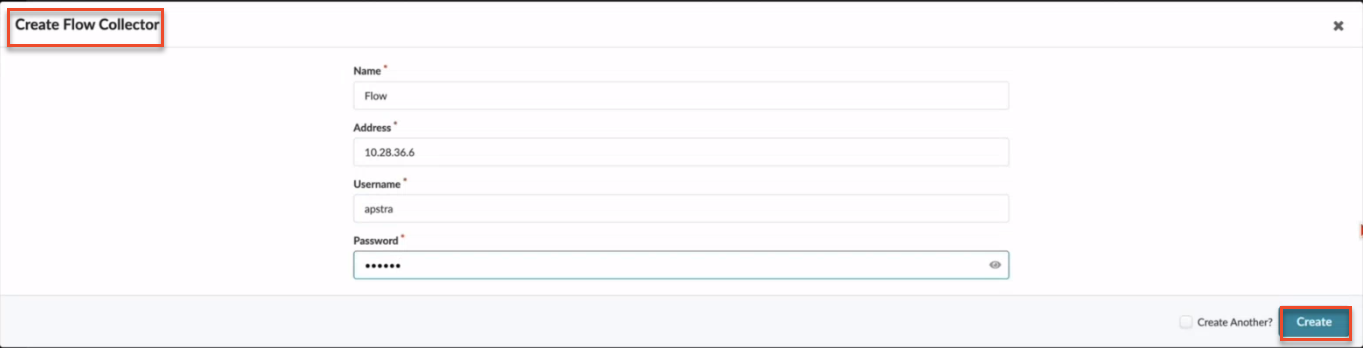
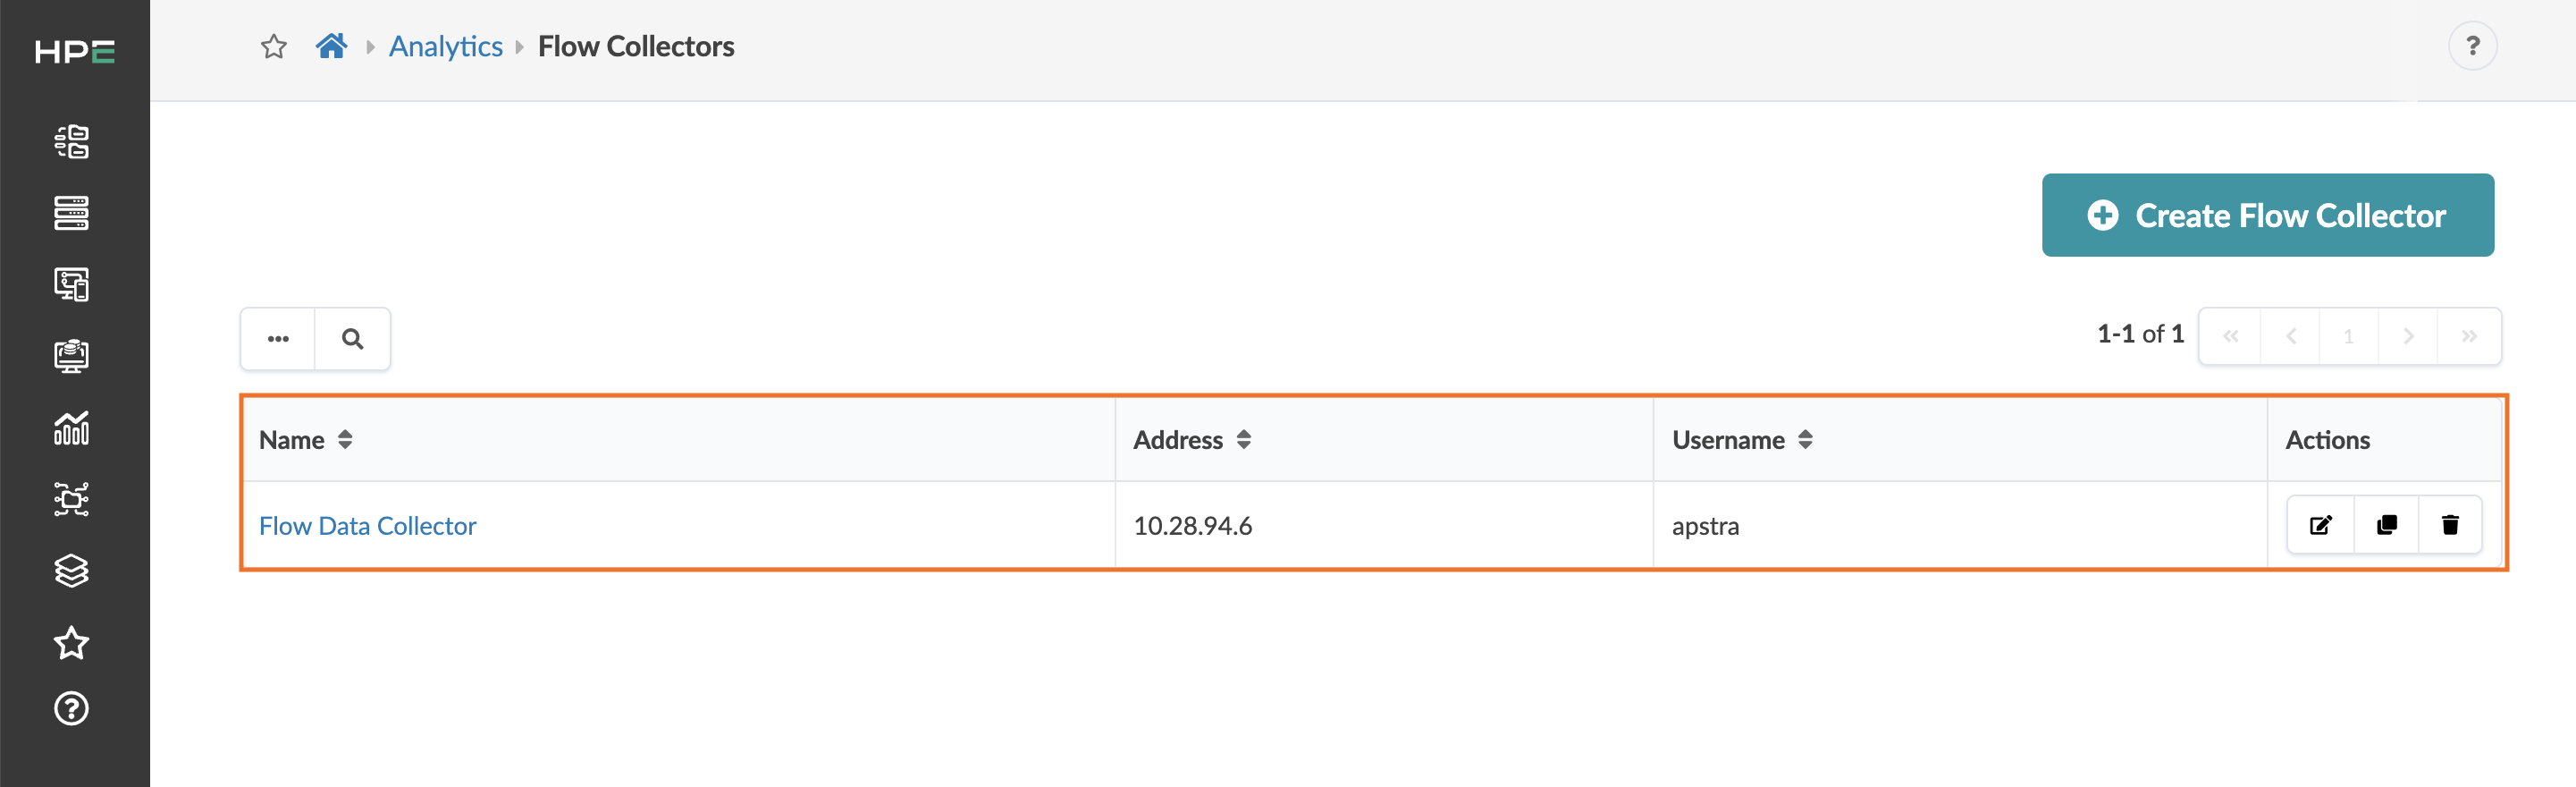
    User interface for creating a Flow Collector with fields for name, IP address, username, password, a Create button, and Create Another checkbox.Flow Collectors section in HPE analytics platform showing a flow data collector with name Flow Data Collector, address 10.28.94.6, username apstra, and options to edit, copy, delete, or create a new flow collector.
  3. From your blueprint, navigate to Analytics > Flow Data. Click Link to dashboard to access the Apstra DC Director Flow dashboard.
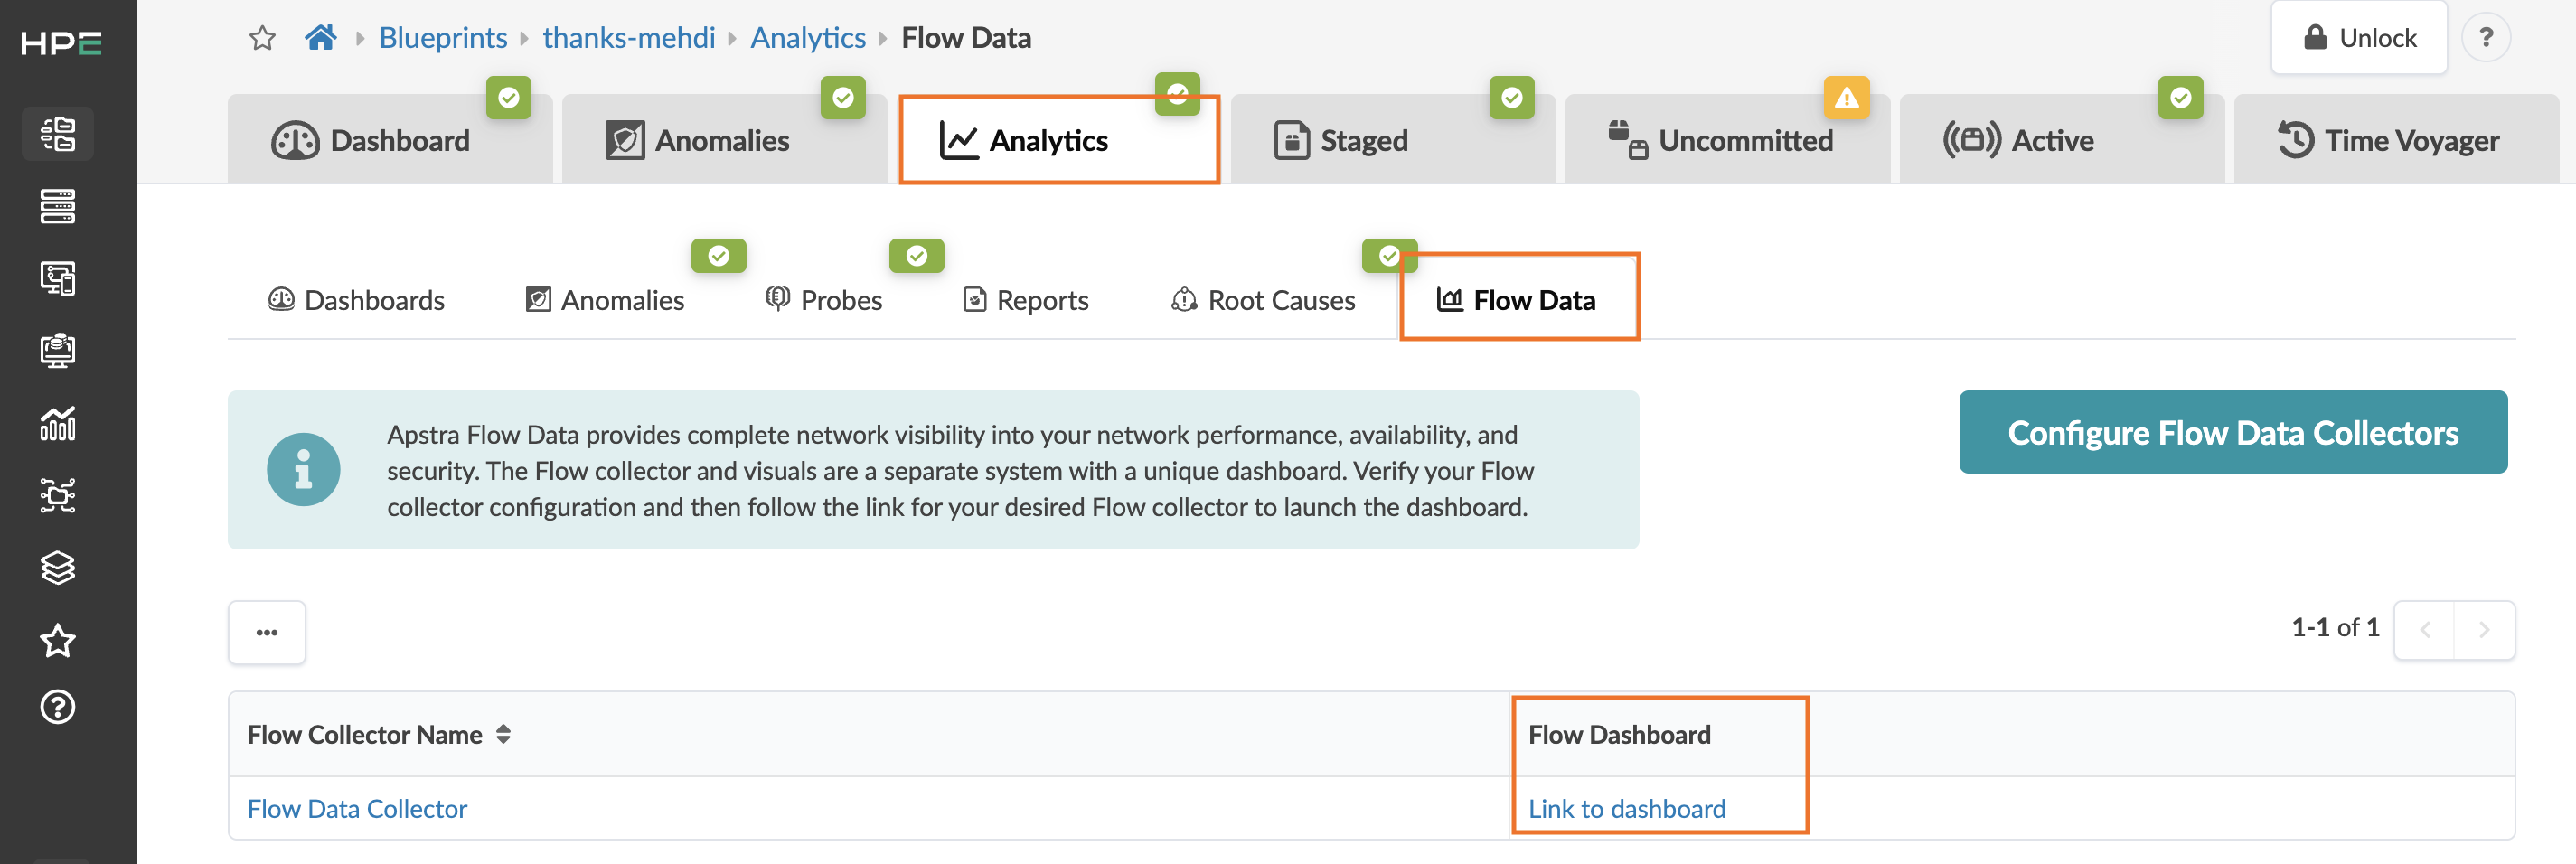
    Screenshot of Juniper Apstra user interface in Analytics section showing Flow Data tools for network monitoring with navigation sidebar.

Access the Apstra DC Director Flow Metrics Dashboard

After you launch the Apstra DC Director Flow dashboard, open the Metrics dashboard to view Apstra DC Director Flow host metrics. The system collects metrics every 15 minutes.

  1. To find the metrics dashboard, navigate from the dashboards list to Metrics: Overview.
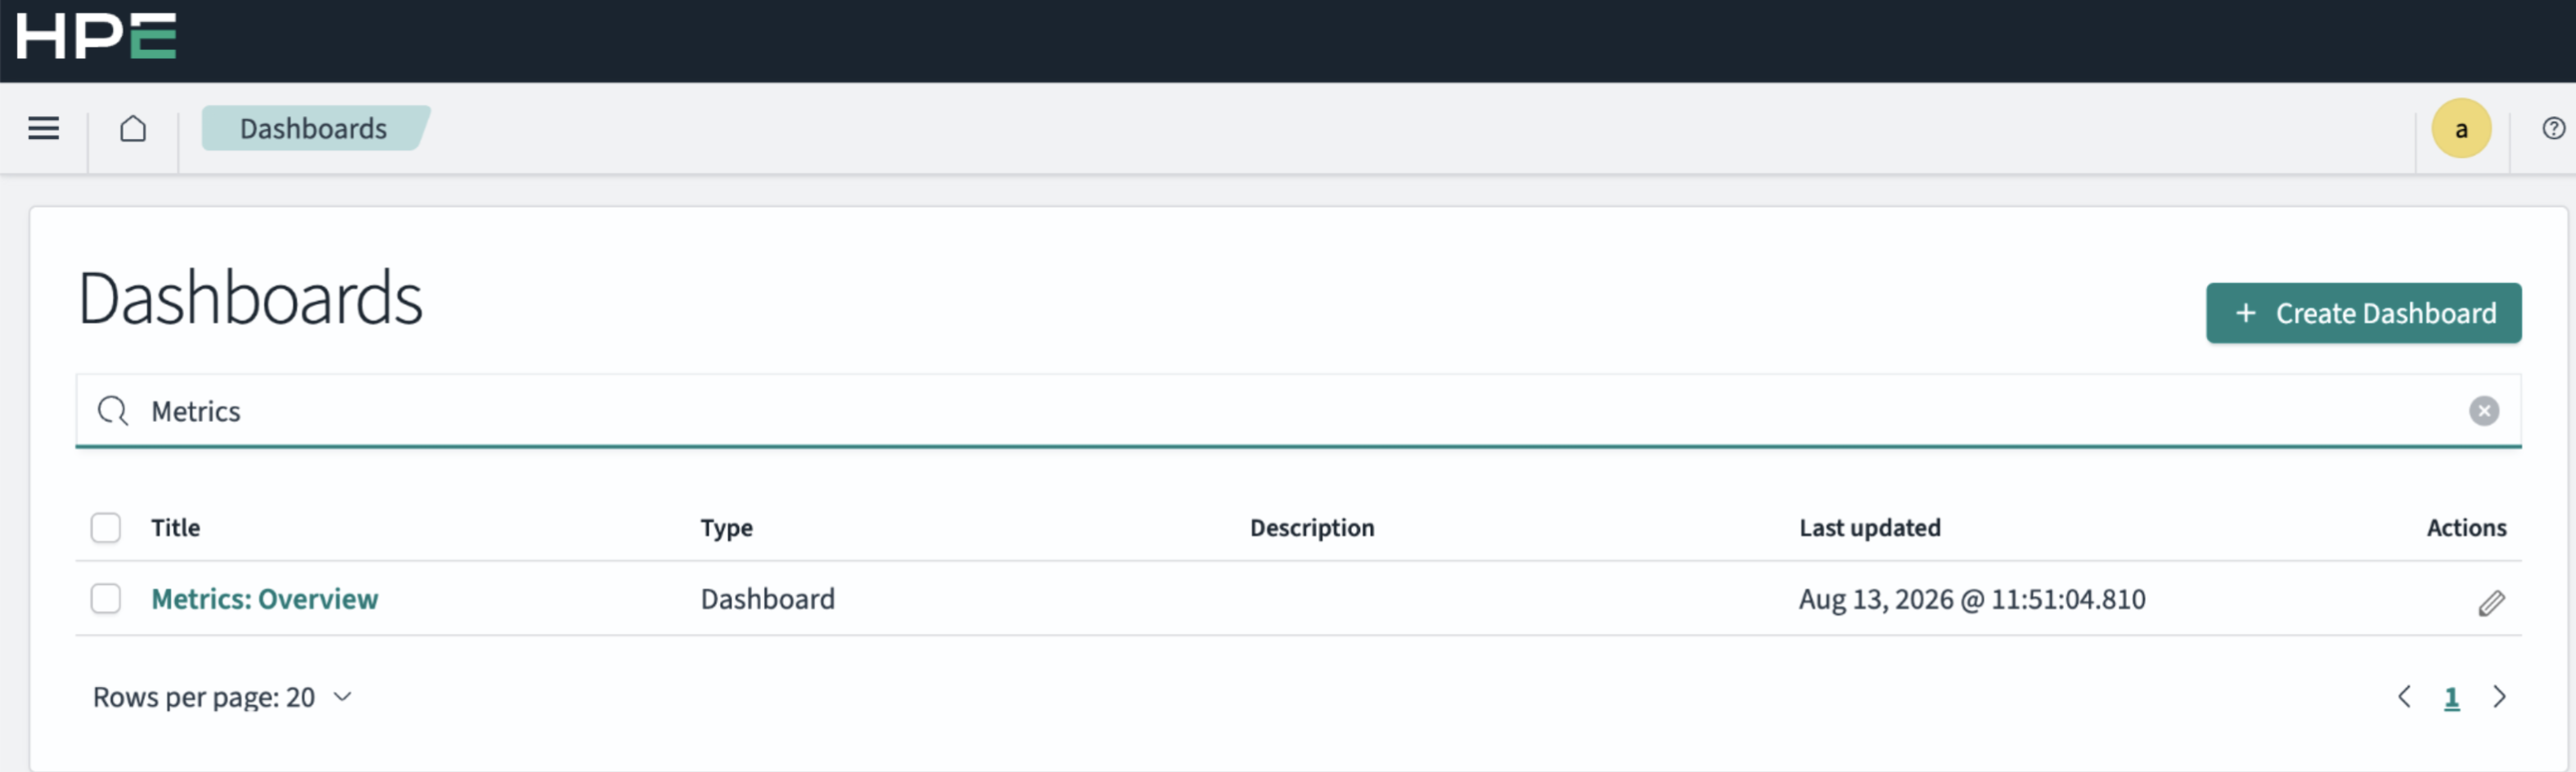
    Dashboard management interface by HPE with navigation menu, search bar, dashboard table, and Create Dashboard button for managing metrics.
  2. If you are viewing a different dashboard, you can click on the Collector Metrics link to view the metrics.
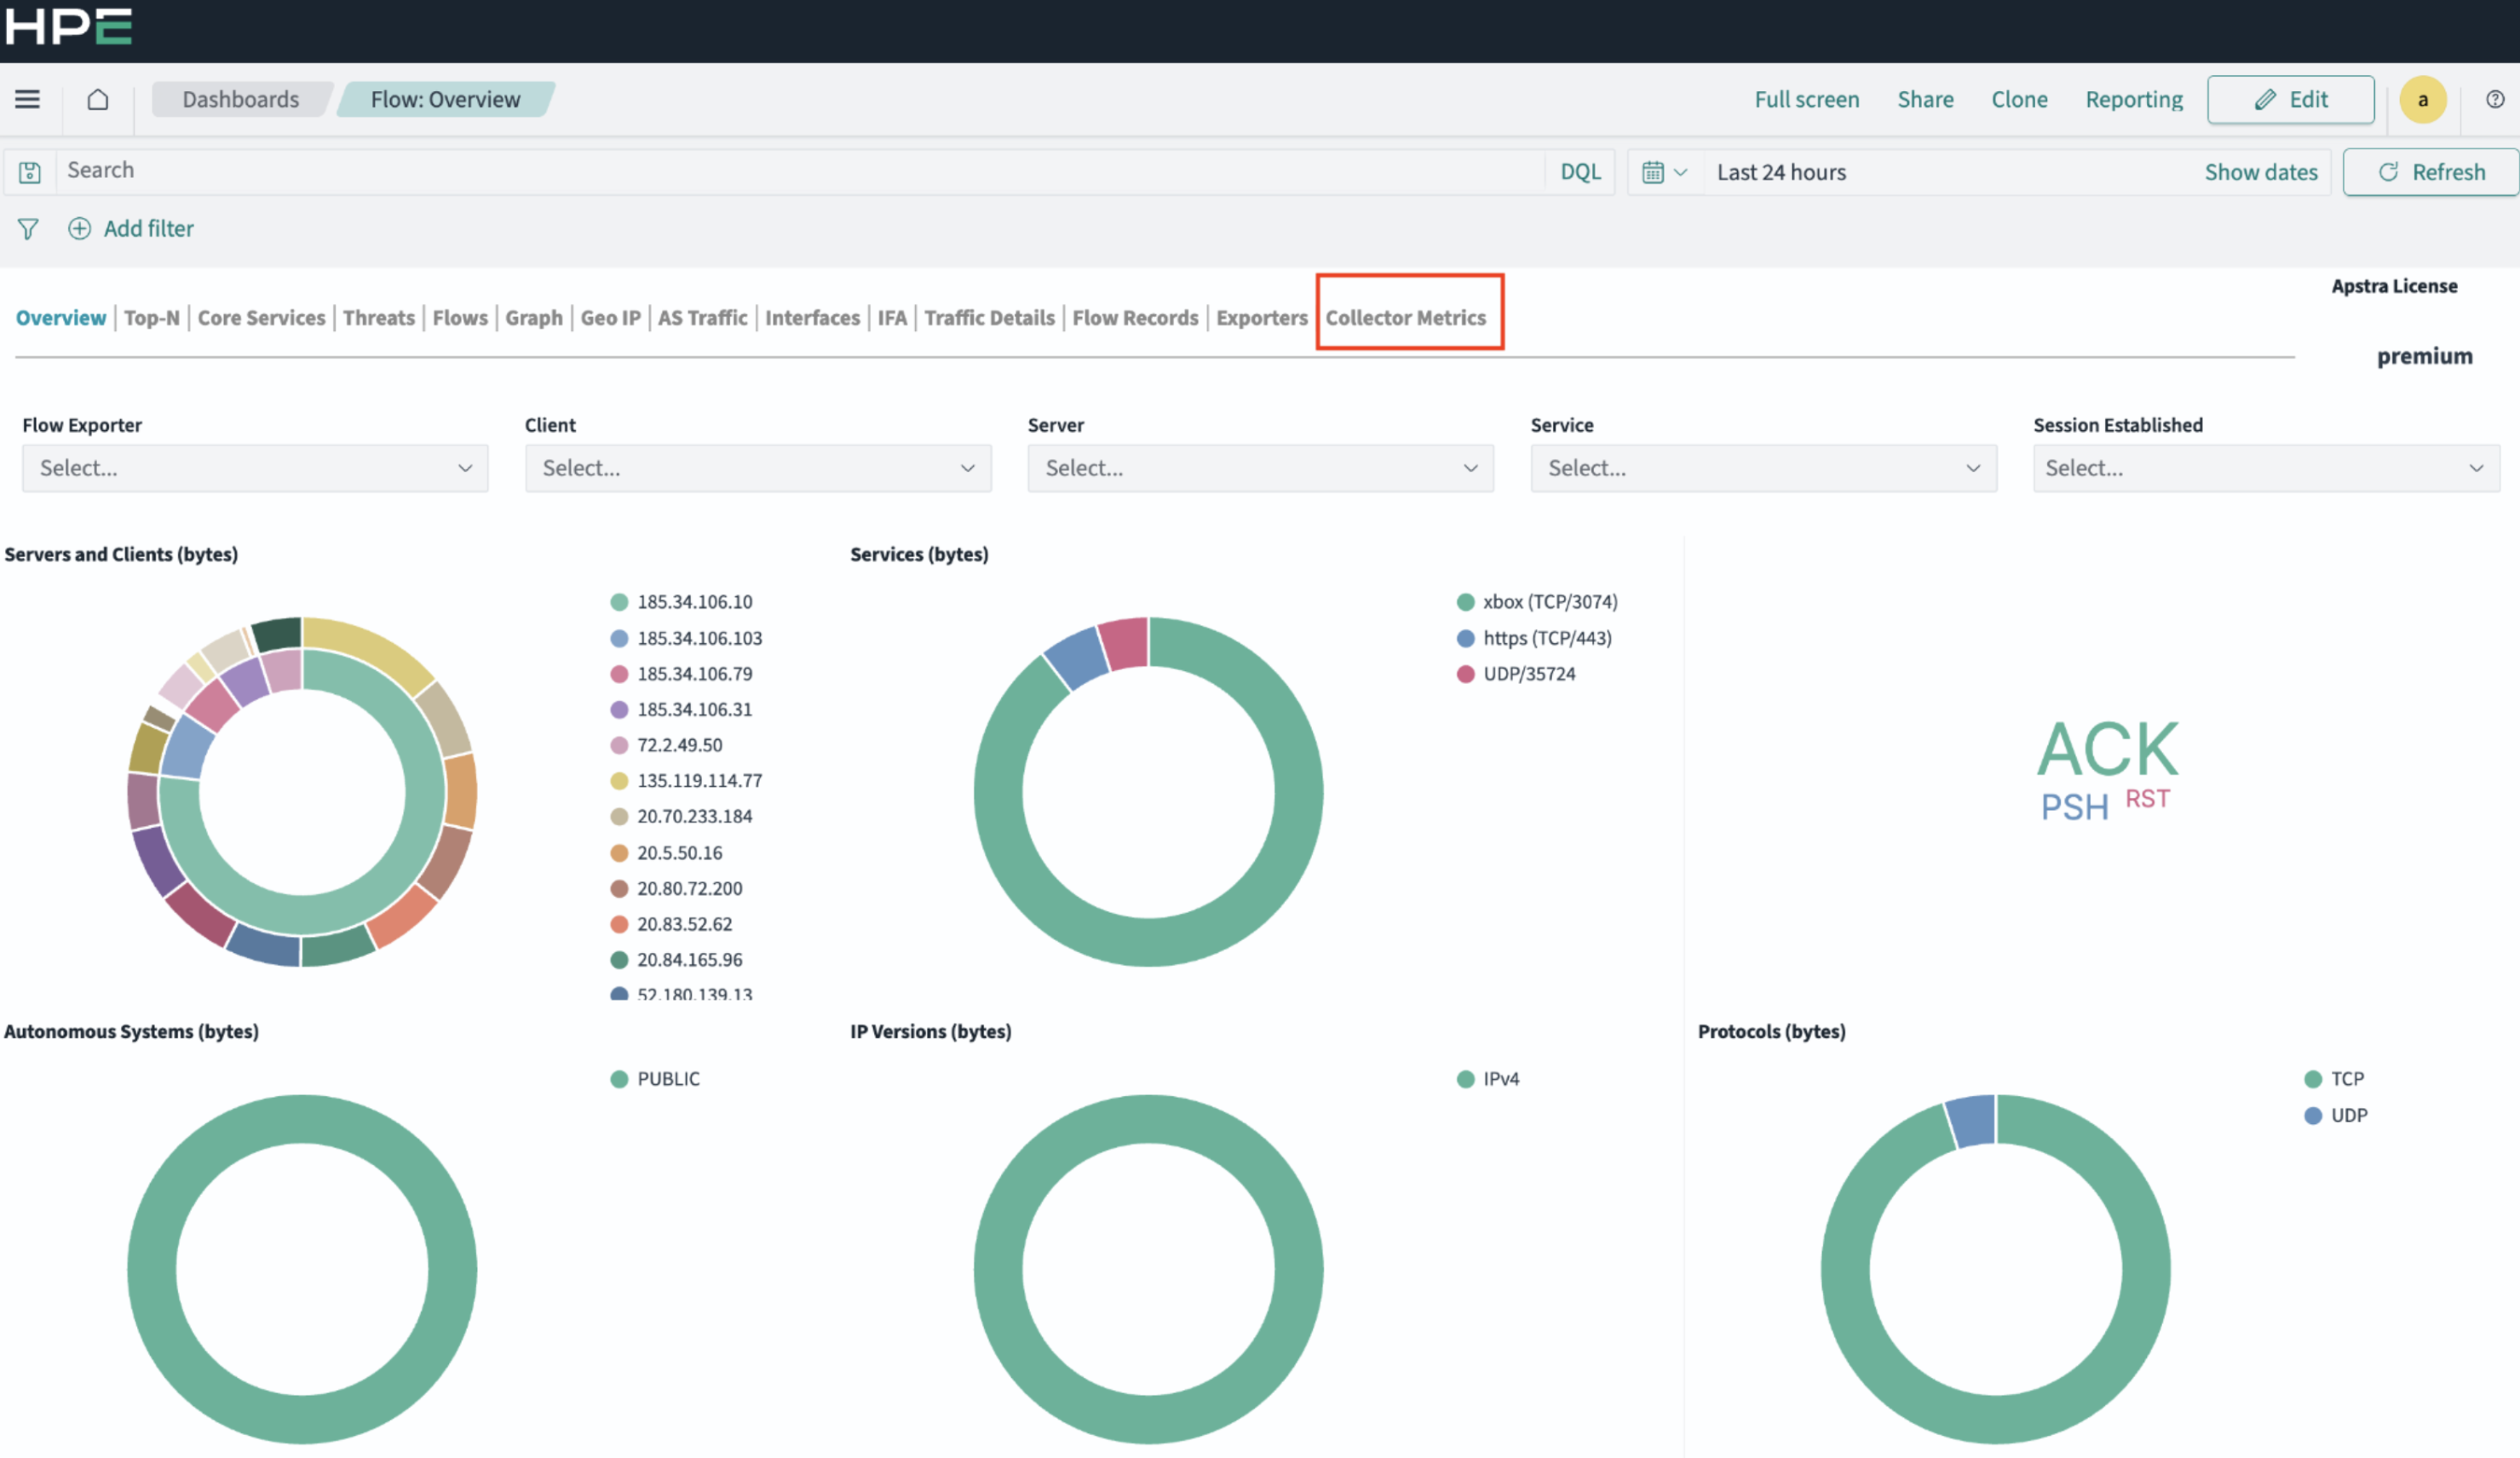
    Dashboard interface from HPE software showing Flow Overview with tabs, filters, donut charts for network traffic metrics, word cloud of TCP flags, and data refresh options.
  3. You can find resource usage and records processing infomration on the metrics dashboard.
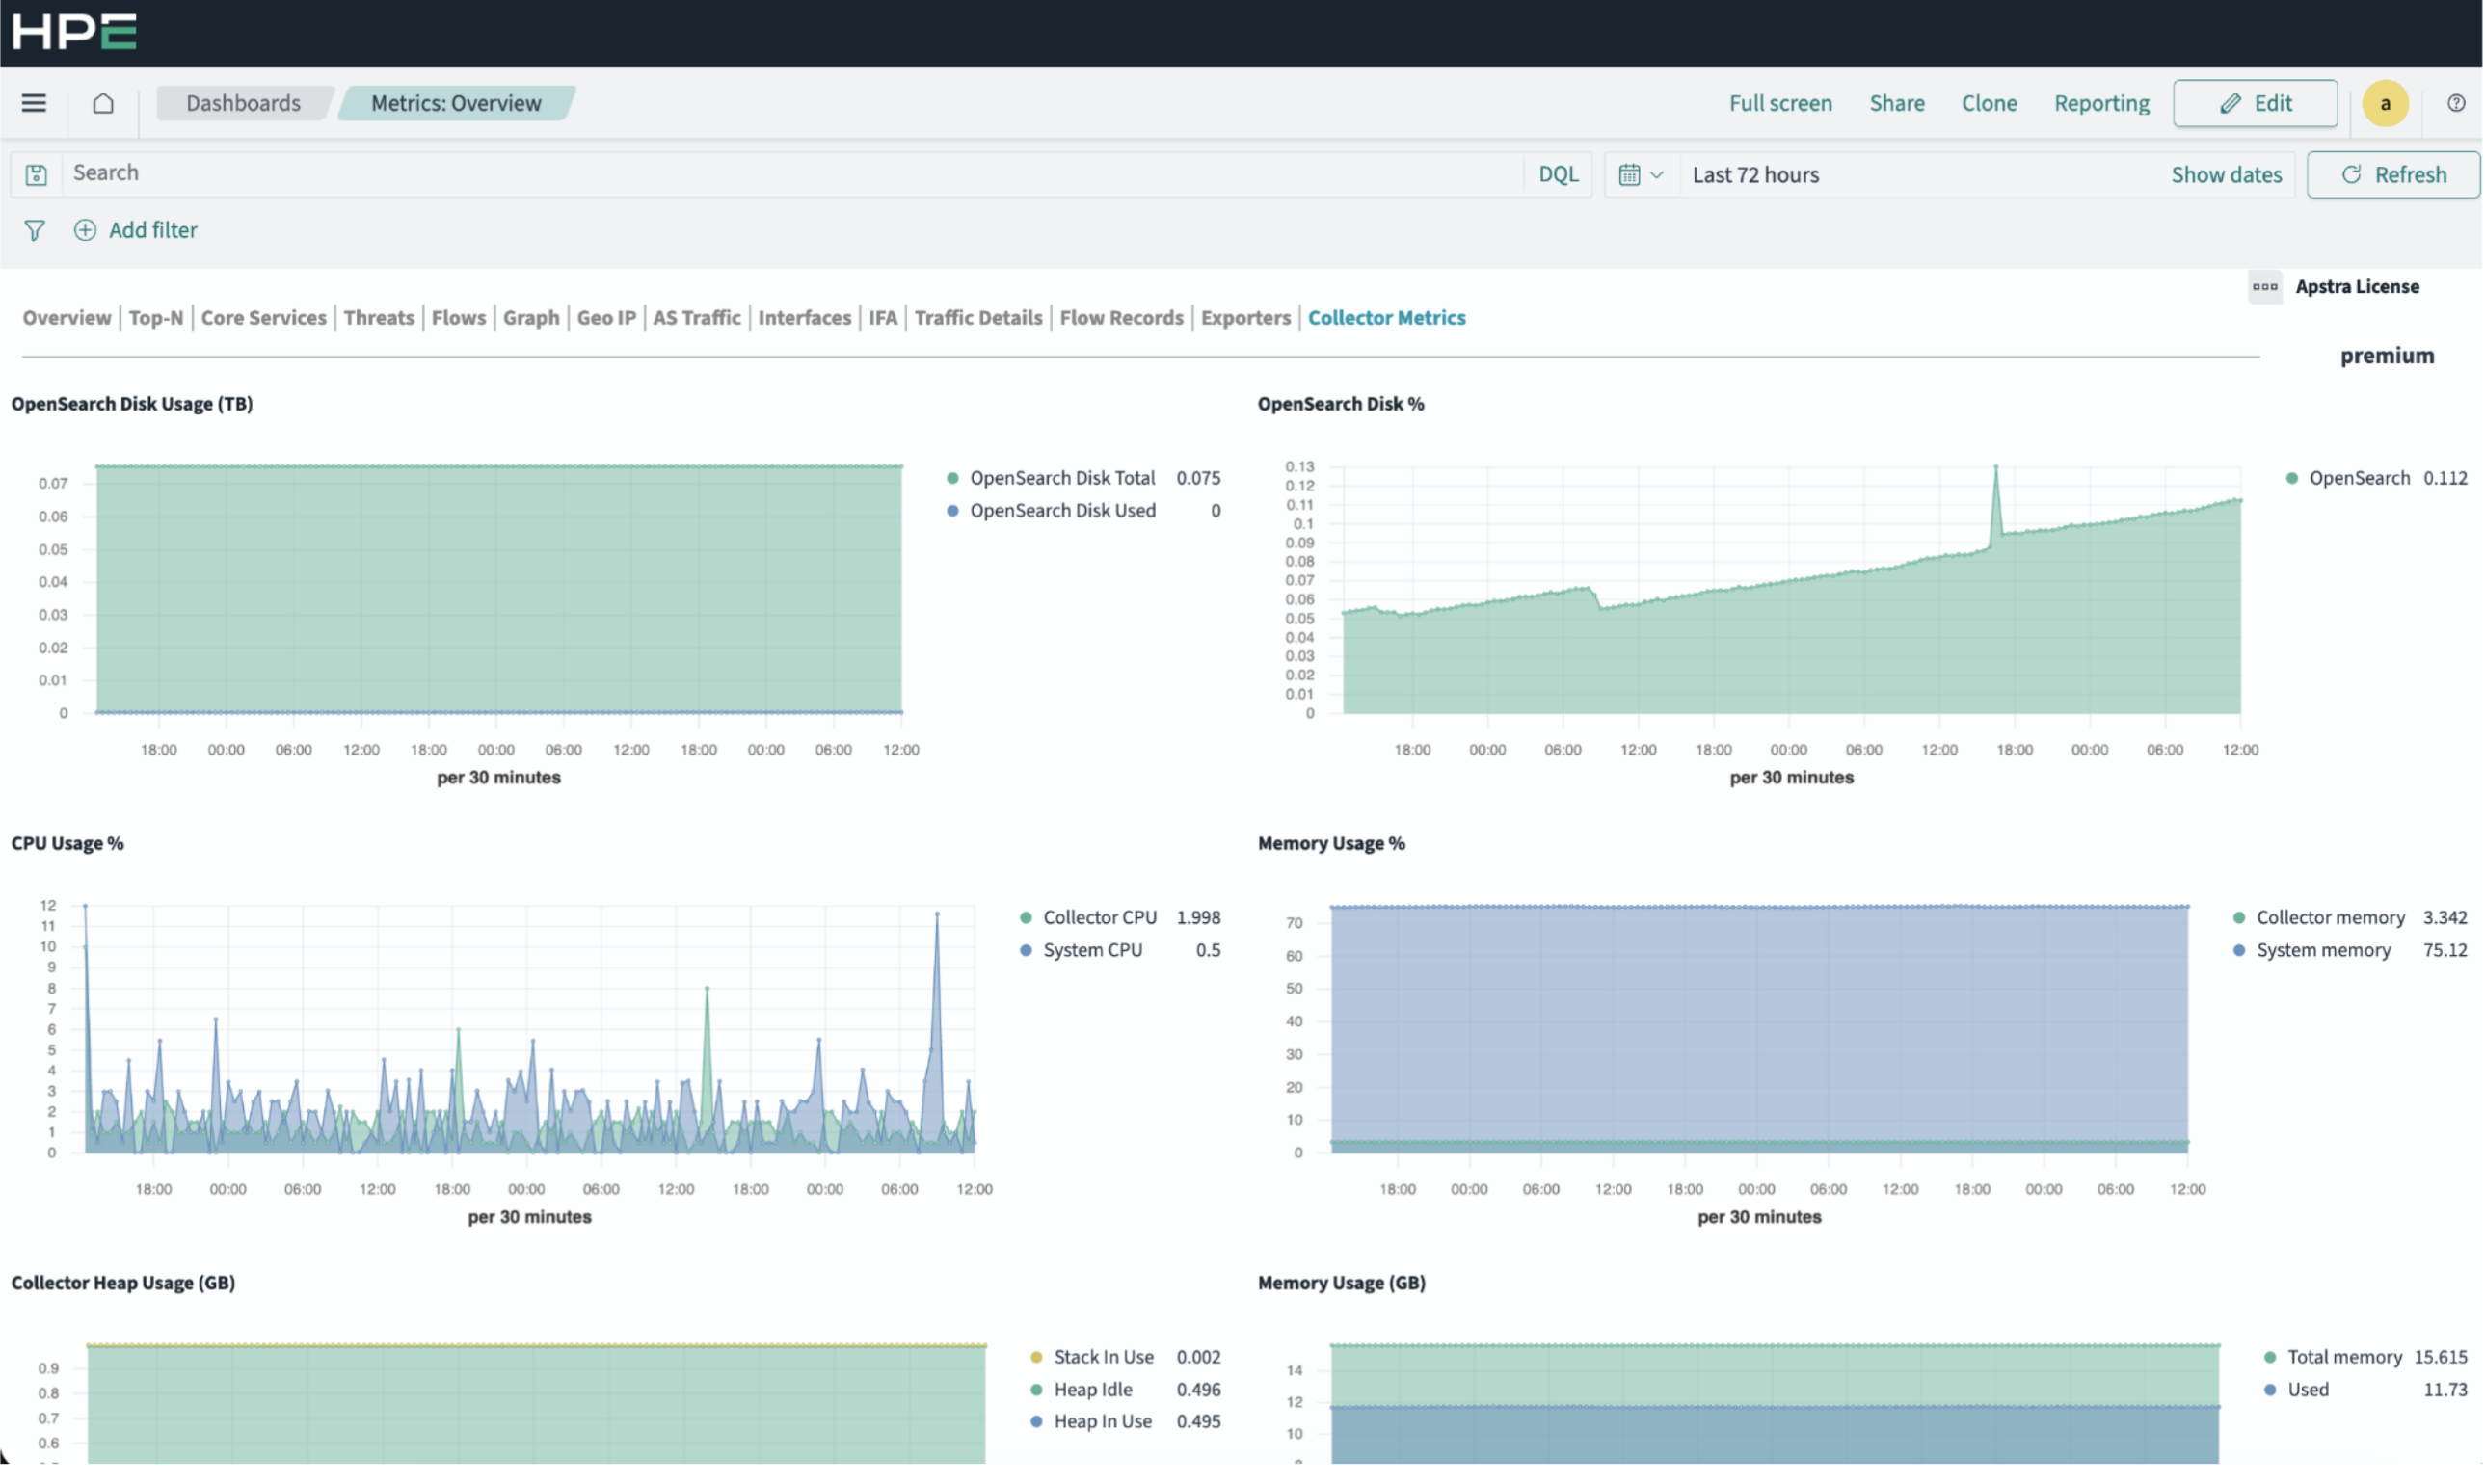
    HPE dashboard displaying system metrics including OpenSearch disk usage, CPU and memory usage, collector heap usage, and system performance trends over time.

Use Dashboards Powered by NetIntel

NetIntel enriches flow records with threat intelligence and application information based on flow data. The following dashboards use NetIntel enrichment:

  1. To view Top Applciations, navigate to Top-N in the navigation bar and select Apps.
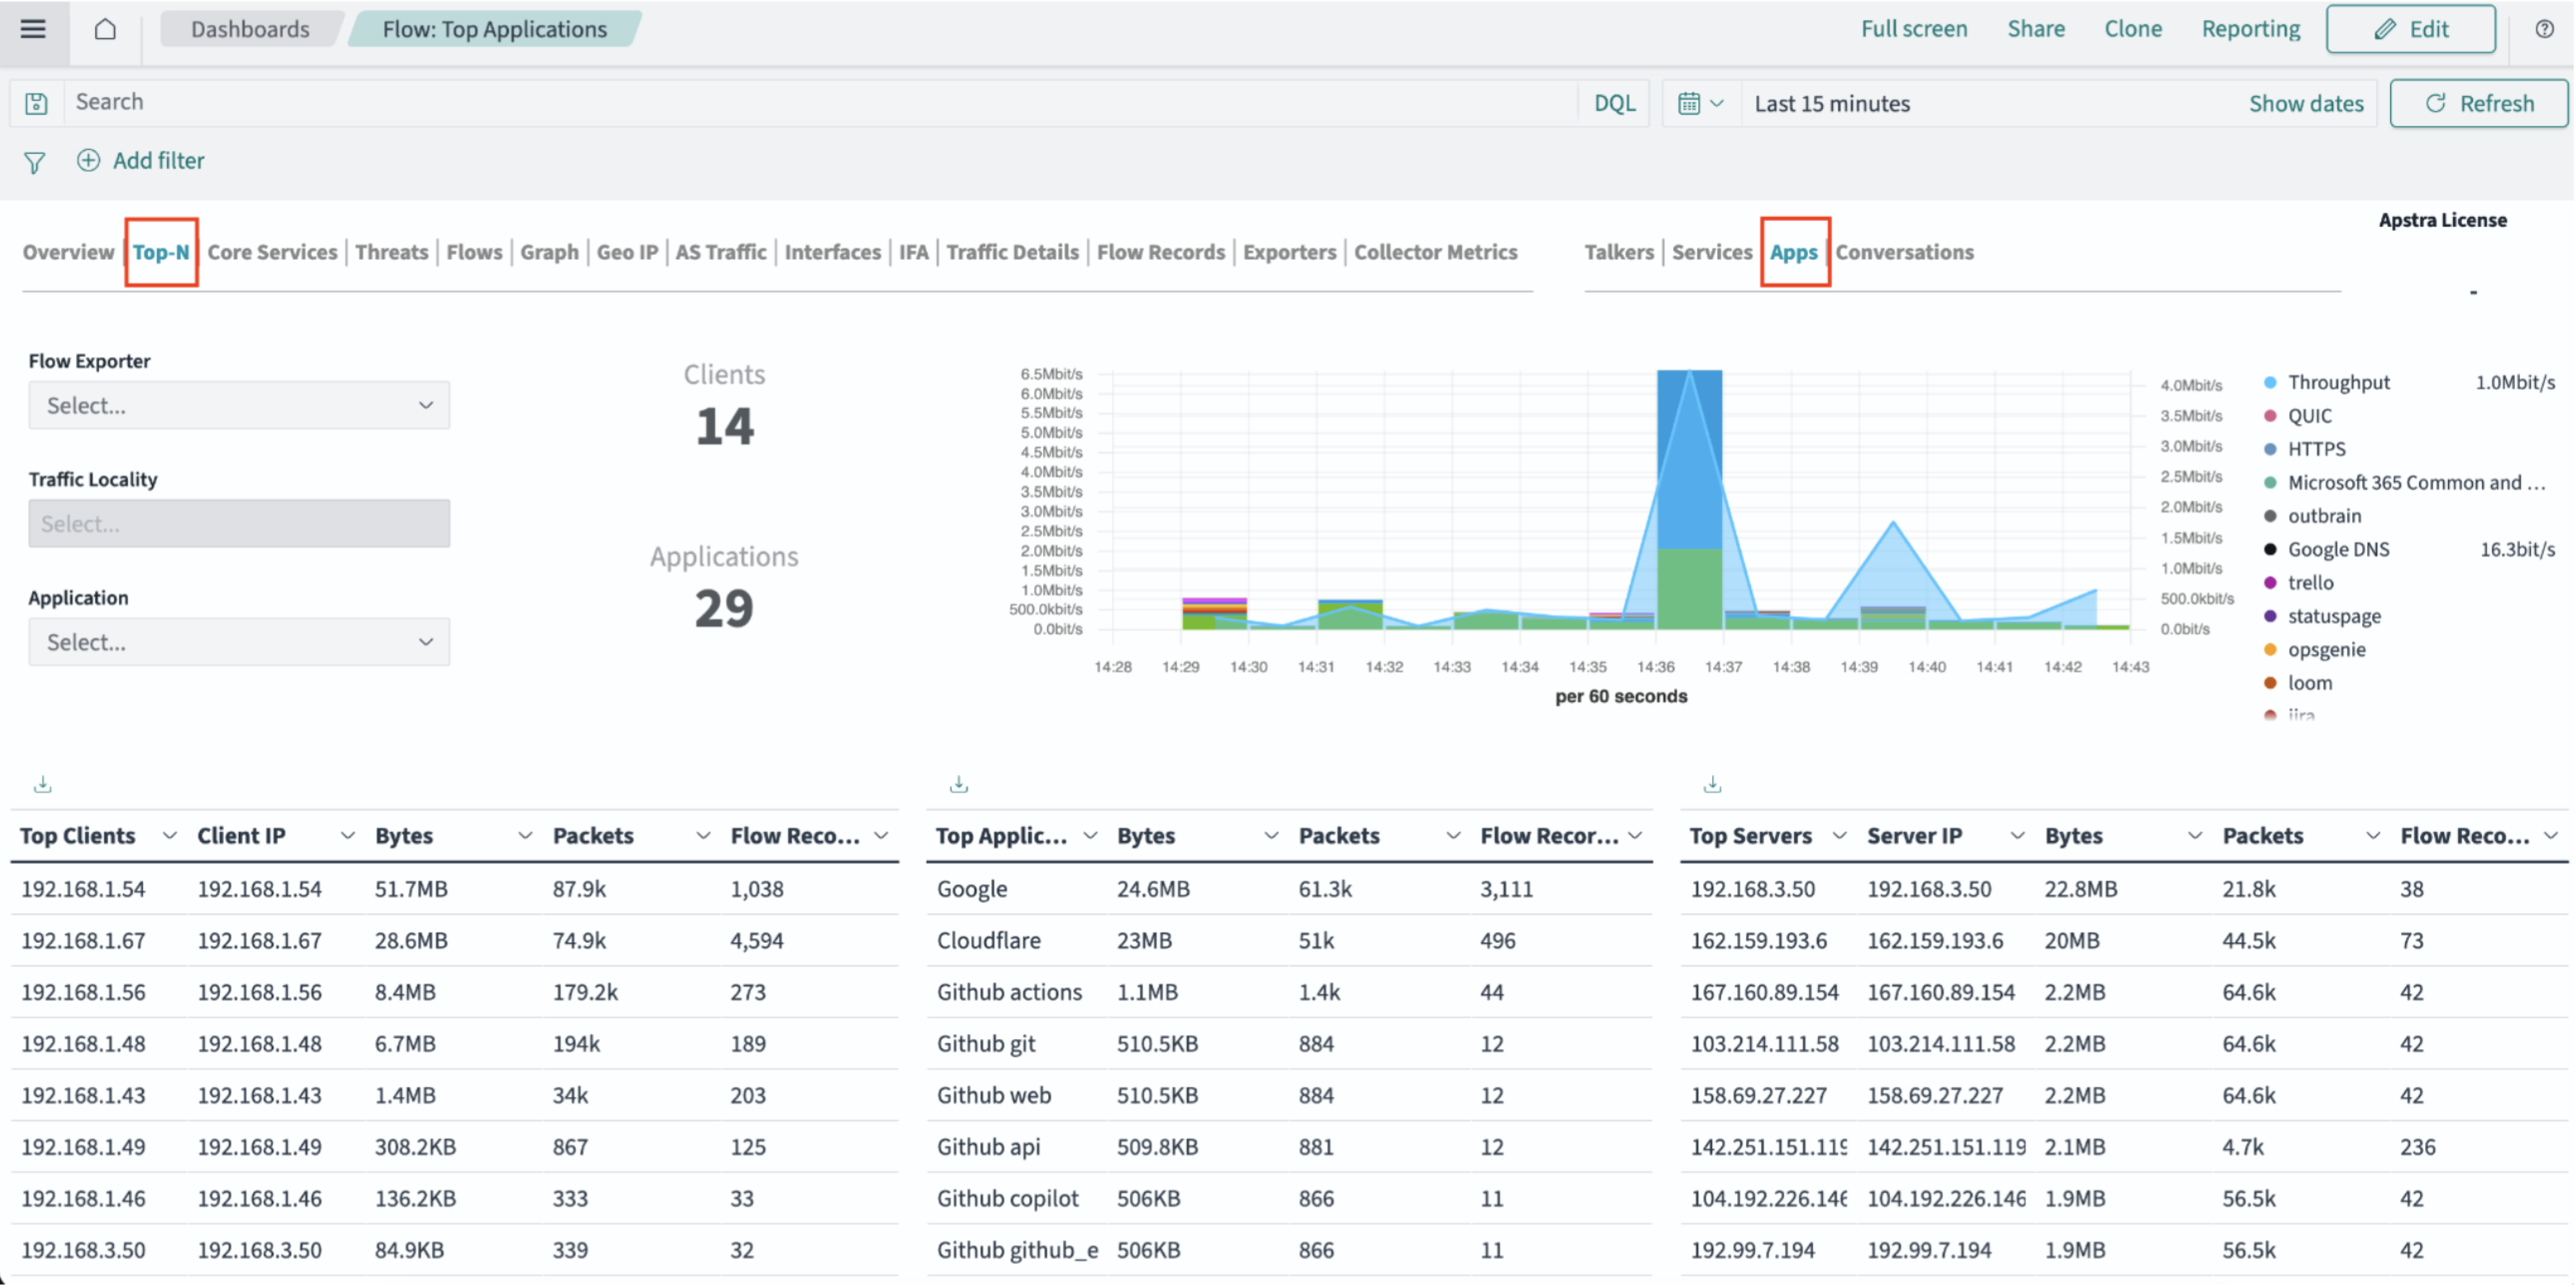
    Dashboard interface for network traffic monitoring showing tabs, filters, summary metrics for clients and applications, time-series graph of traffic, tables of top clients, applications, servers, and color-coded legend for protocols.
  2. To view Threats IP Reputation, navigate to Threats in the navigation bar and select IP Reputation.
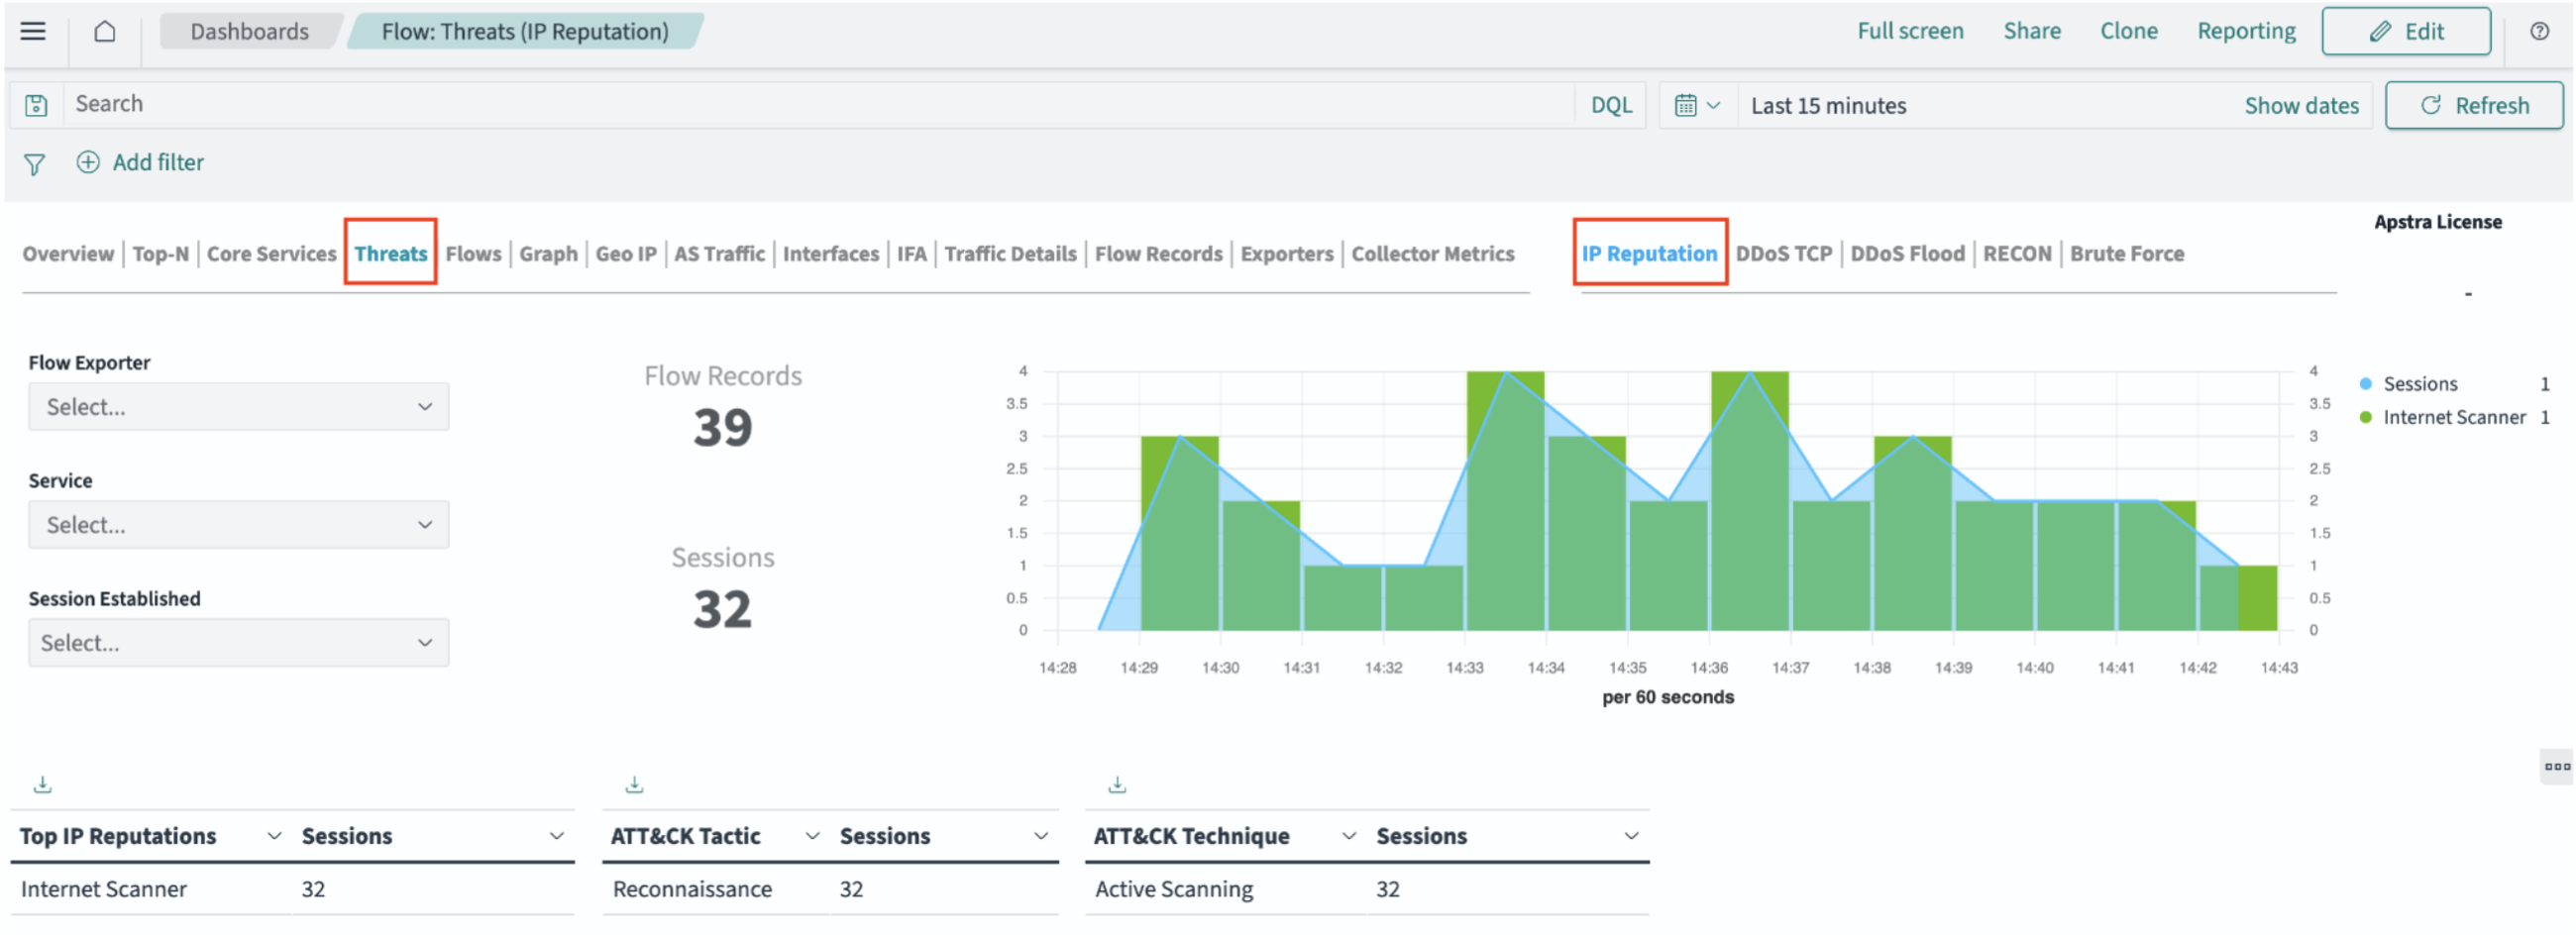
    Dashboard interface for monitoring network threats and IP reputation with tabs, filters, metrics, graphs, tables, and export options for data analysis.
For more details about Apstra DC Director Flow, see the Analytics chapter in the Juniper Apstra User Guide.