Troubleshoot Specific Connectivity Issues by Using the Marvis Conversational Assistant

Understand how you can use the Marvis conversational assistant to troubleshoot specific connectivity issues.

We cover a few troubleshooting examples so that you get an idea about how you can use the Marvis conversational assistant to troubleshoot connectivity issues.

Troubleshoot Authorization Failures

Authorization failures can be due to various reasons such as a RADIUS server not responding and clients failing to complete the authorization process. This example shows how you can use the Marvis conversational assistant to troubleshoot authorization failures both for a site and a client.

To troubleshoot authorization failures at a site:

  1. In the Marvis conversational assistant window, enter troubleshoot followed by the site name. You can also specify a duration.

    In this example, you’ll see that Marvis identifies authorization issues in the wireless network.
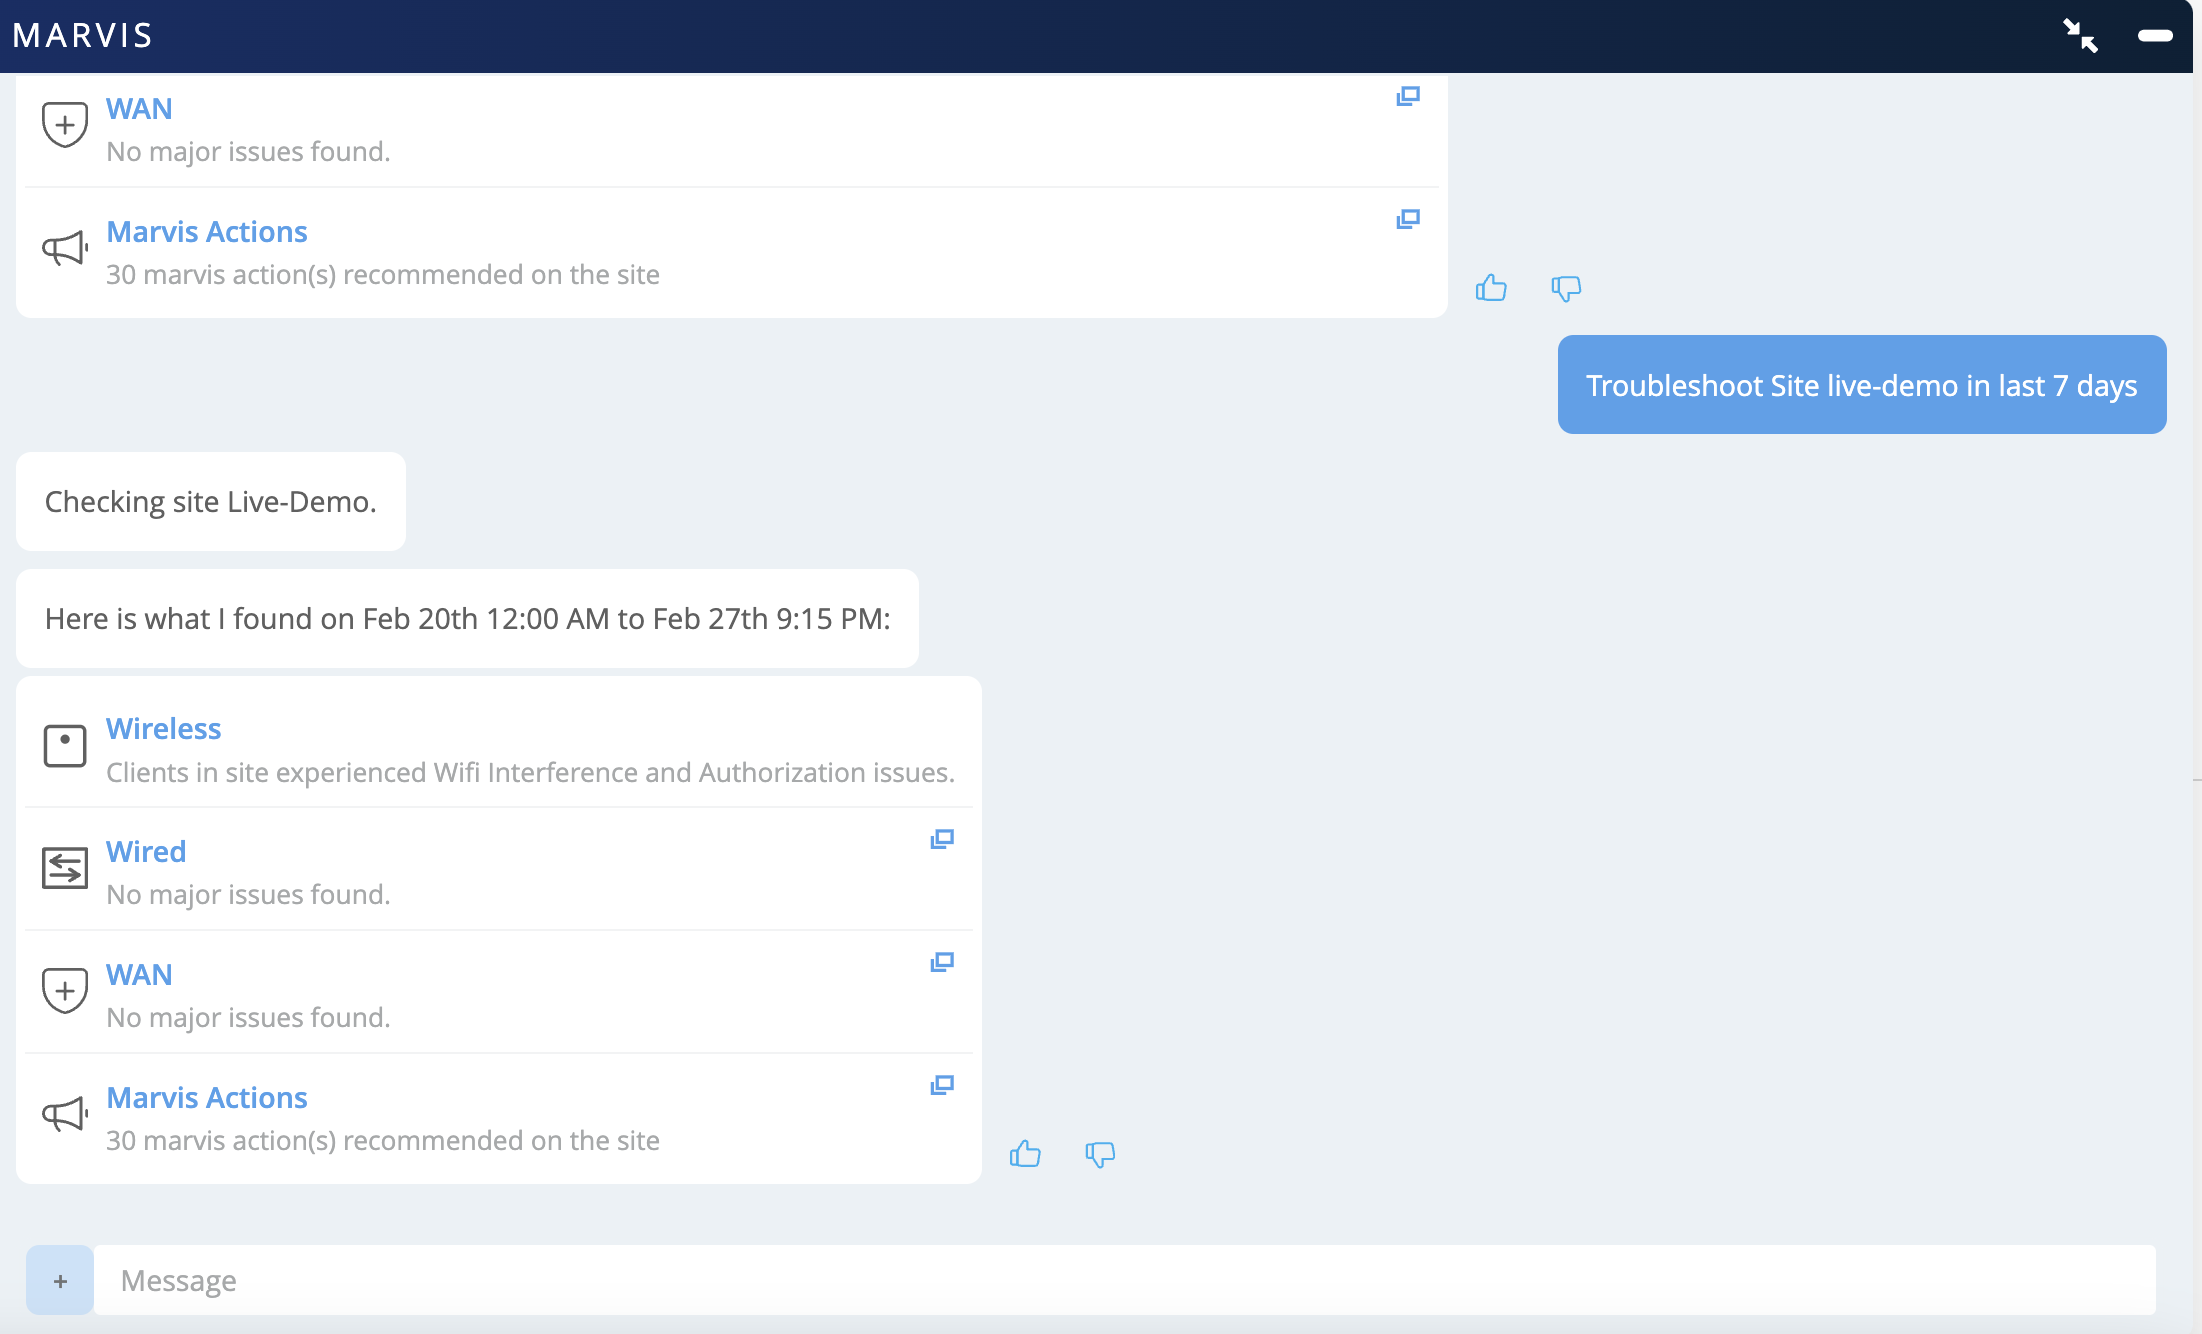
    Troubleshooting interface for MARVIS analyzing site Live-Demo from February 20th 12:00 AM to February 27th 9:15 PM. Wireless shows WiFi interference and authorization issues. Wired and WAN report no major issues. Marvis recommends 30 actions. Includes button to troubleshoot site and options for user feedback.

  2. Click the Wireless category to get some more details about the issue. In this example, you’ll see that Marvis reports that the clients at the site faced authorization failures 36% of the time.
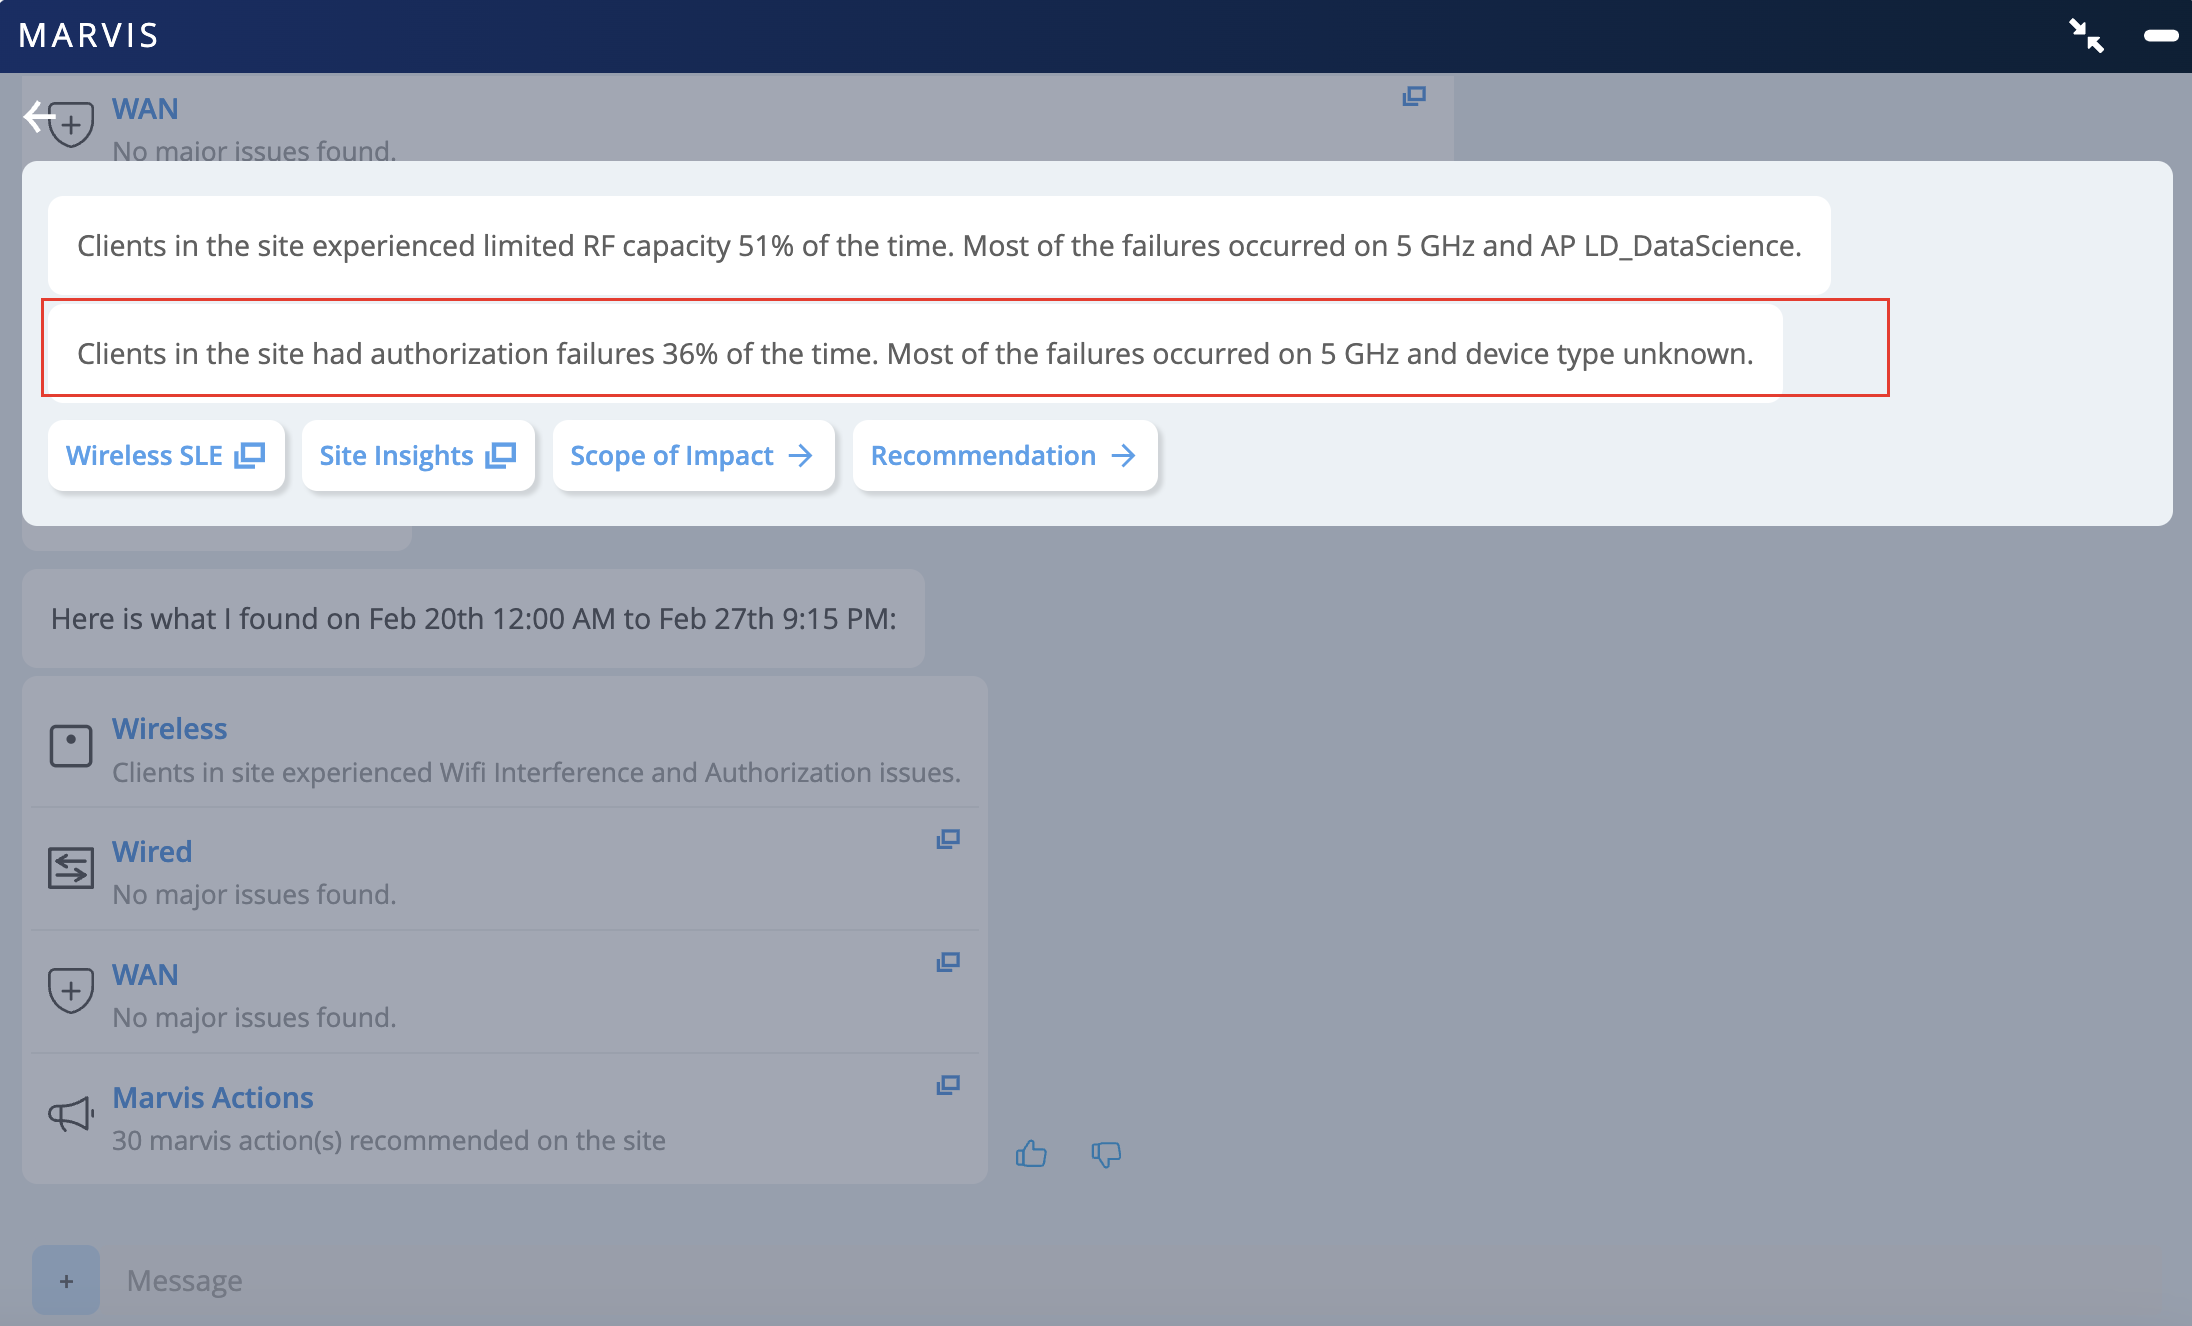
    Network monitoring tool screenshot summarizing wireless issues, wired and WAN status, and Marvis recommendations. Wireless issues include RF capacity failures 51 percent of the time and authorization failures 36 percent of the time, mostly on the 5 GHz band linked to AP LD_DataScience. Wired and WAN connections show no major issues. System suggests 30 actions to resolve site issues. Timestamped February 20th to February 27th.

You can investigate further by using the options displayed.

Scope of Impact

Scope of Impact provides a graphical representation of all the clients that experienced issues. You can also choose to view the information based on a wireless LAN (WLAN), access point (AP), or radio band by using the drop-down list on the right.
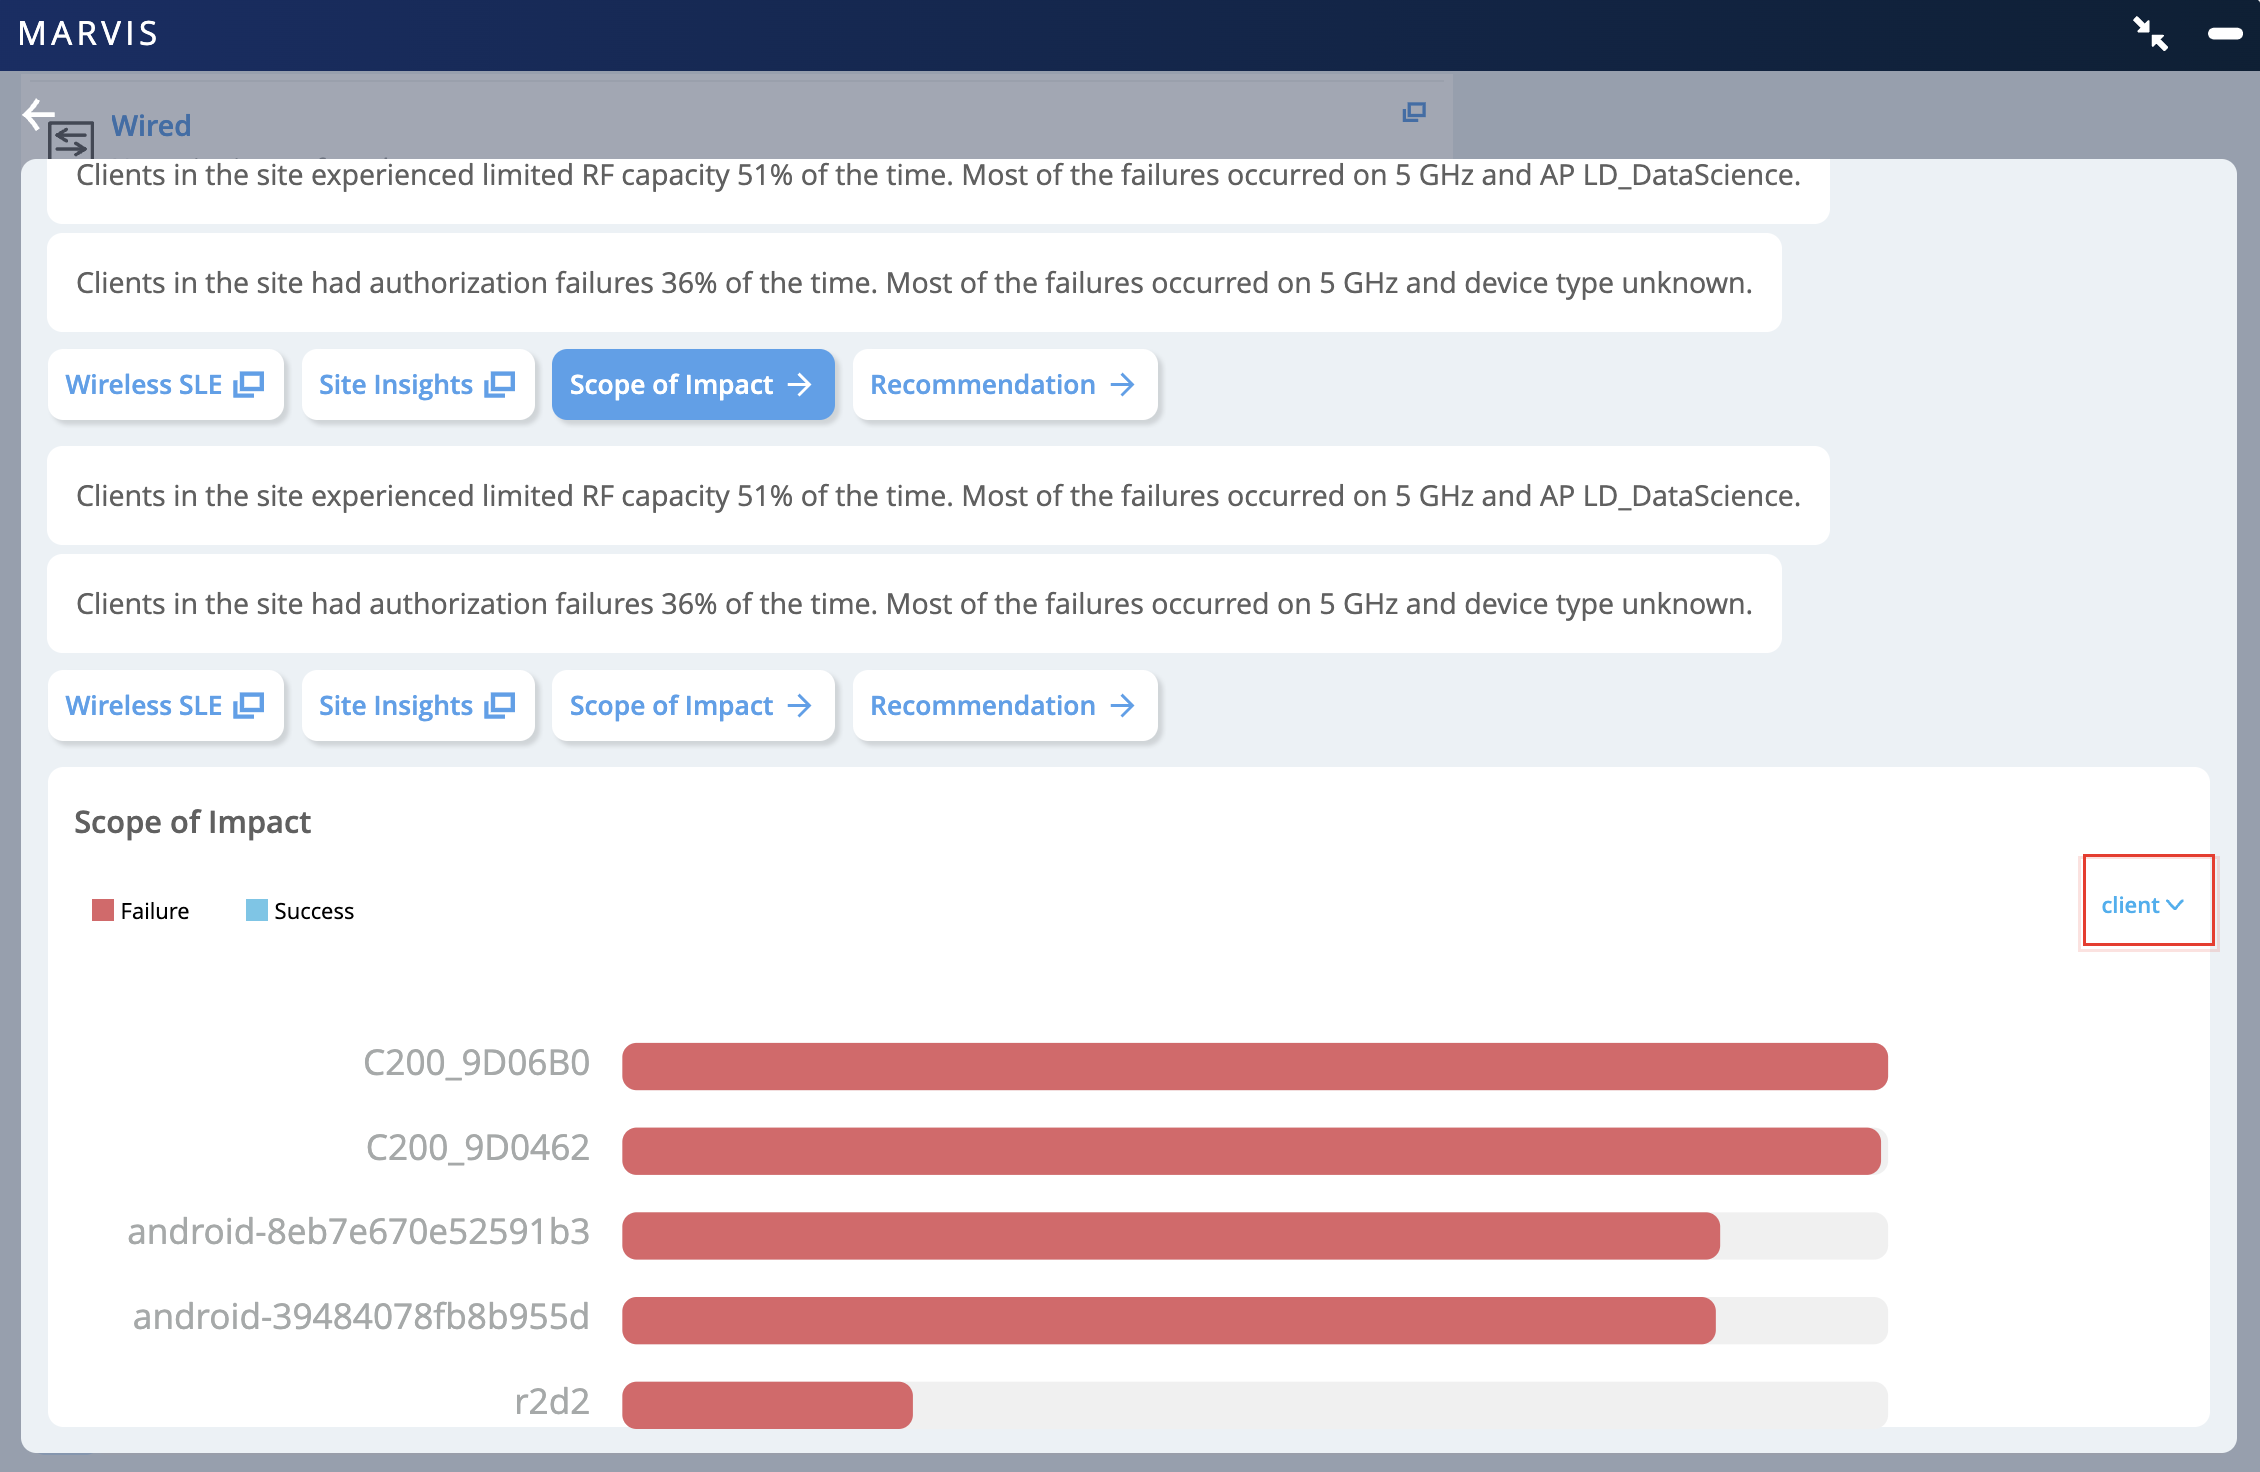
Network monitoring dashboard from Marvis showing wireless performance issues. Summary highlights RF capacity issues 51 percent of the time and authorization failures 36 percent of the time, mostly on 5 GHz band. Tabs include Wireless SLE, Site Insights, Scope of Impact, and Recommendation. Bar chart displays client impact with red bars for failures and blue bars for successes. Dropdown menu allows filtering by client.

Wireless SLE

The Wireless SLEs dashboard provides site-level insights and SLE classifiers. In this example, you’ll see that the Successful Connect service-level expectation (SLE) shows that 64 percent of the connects were successful.
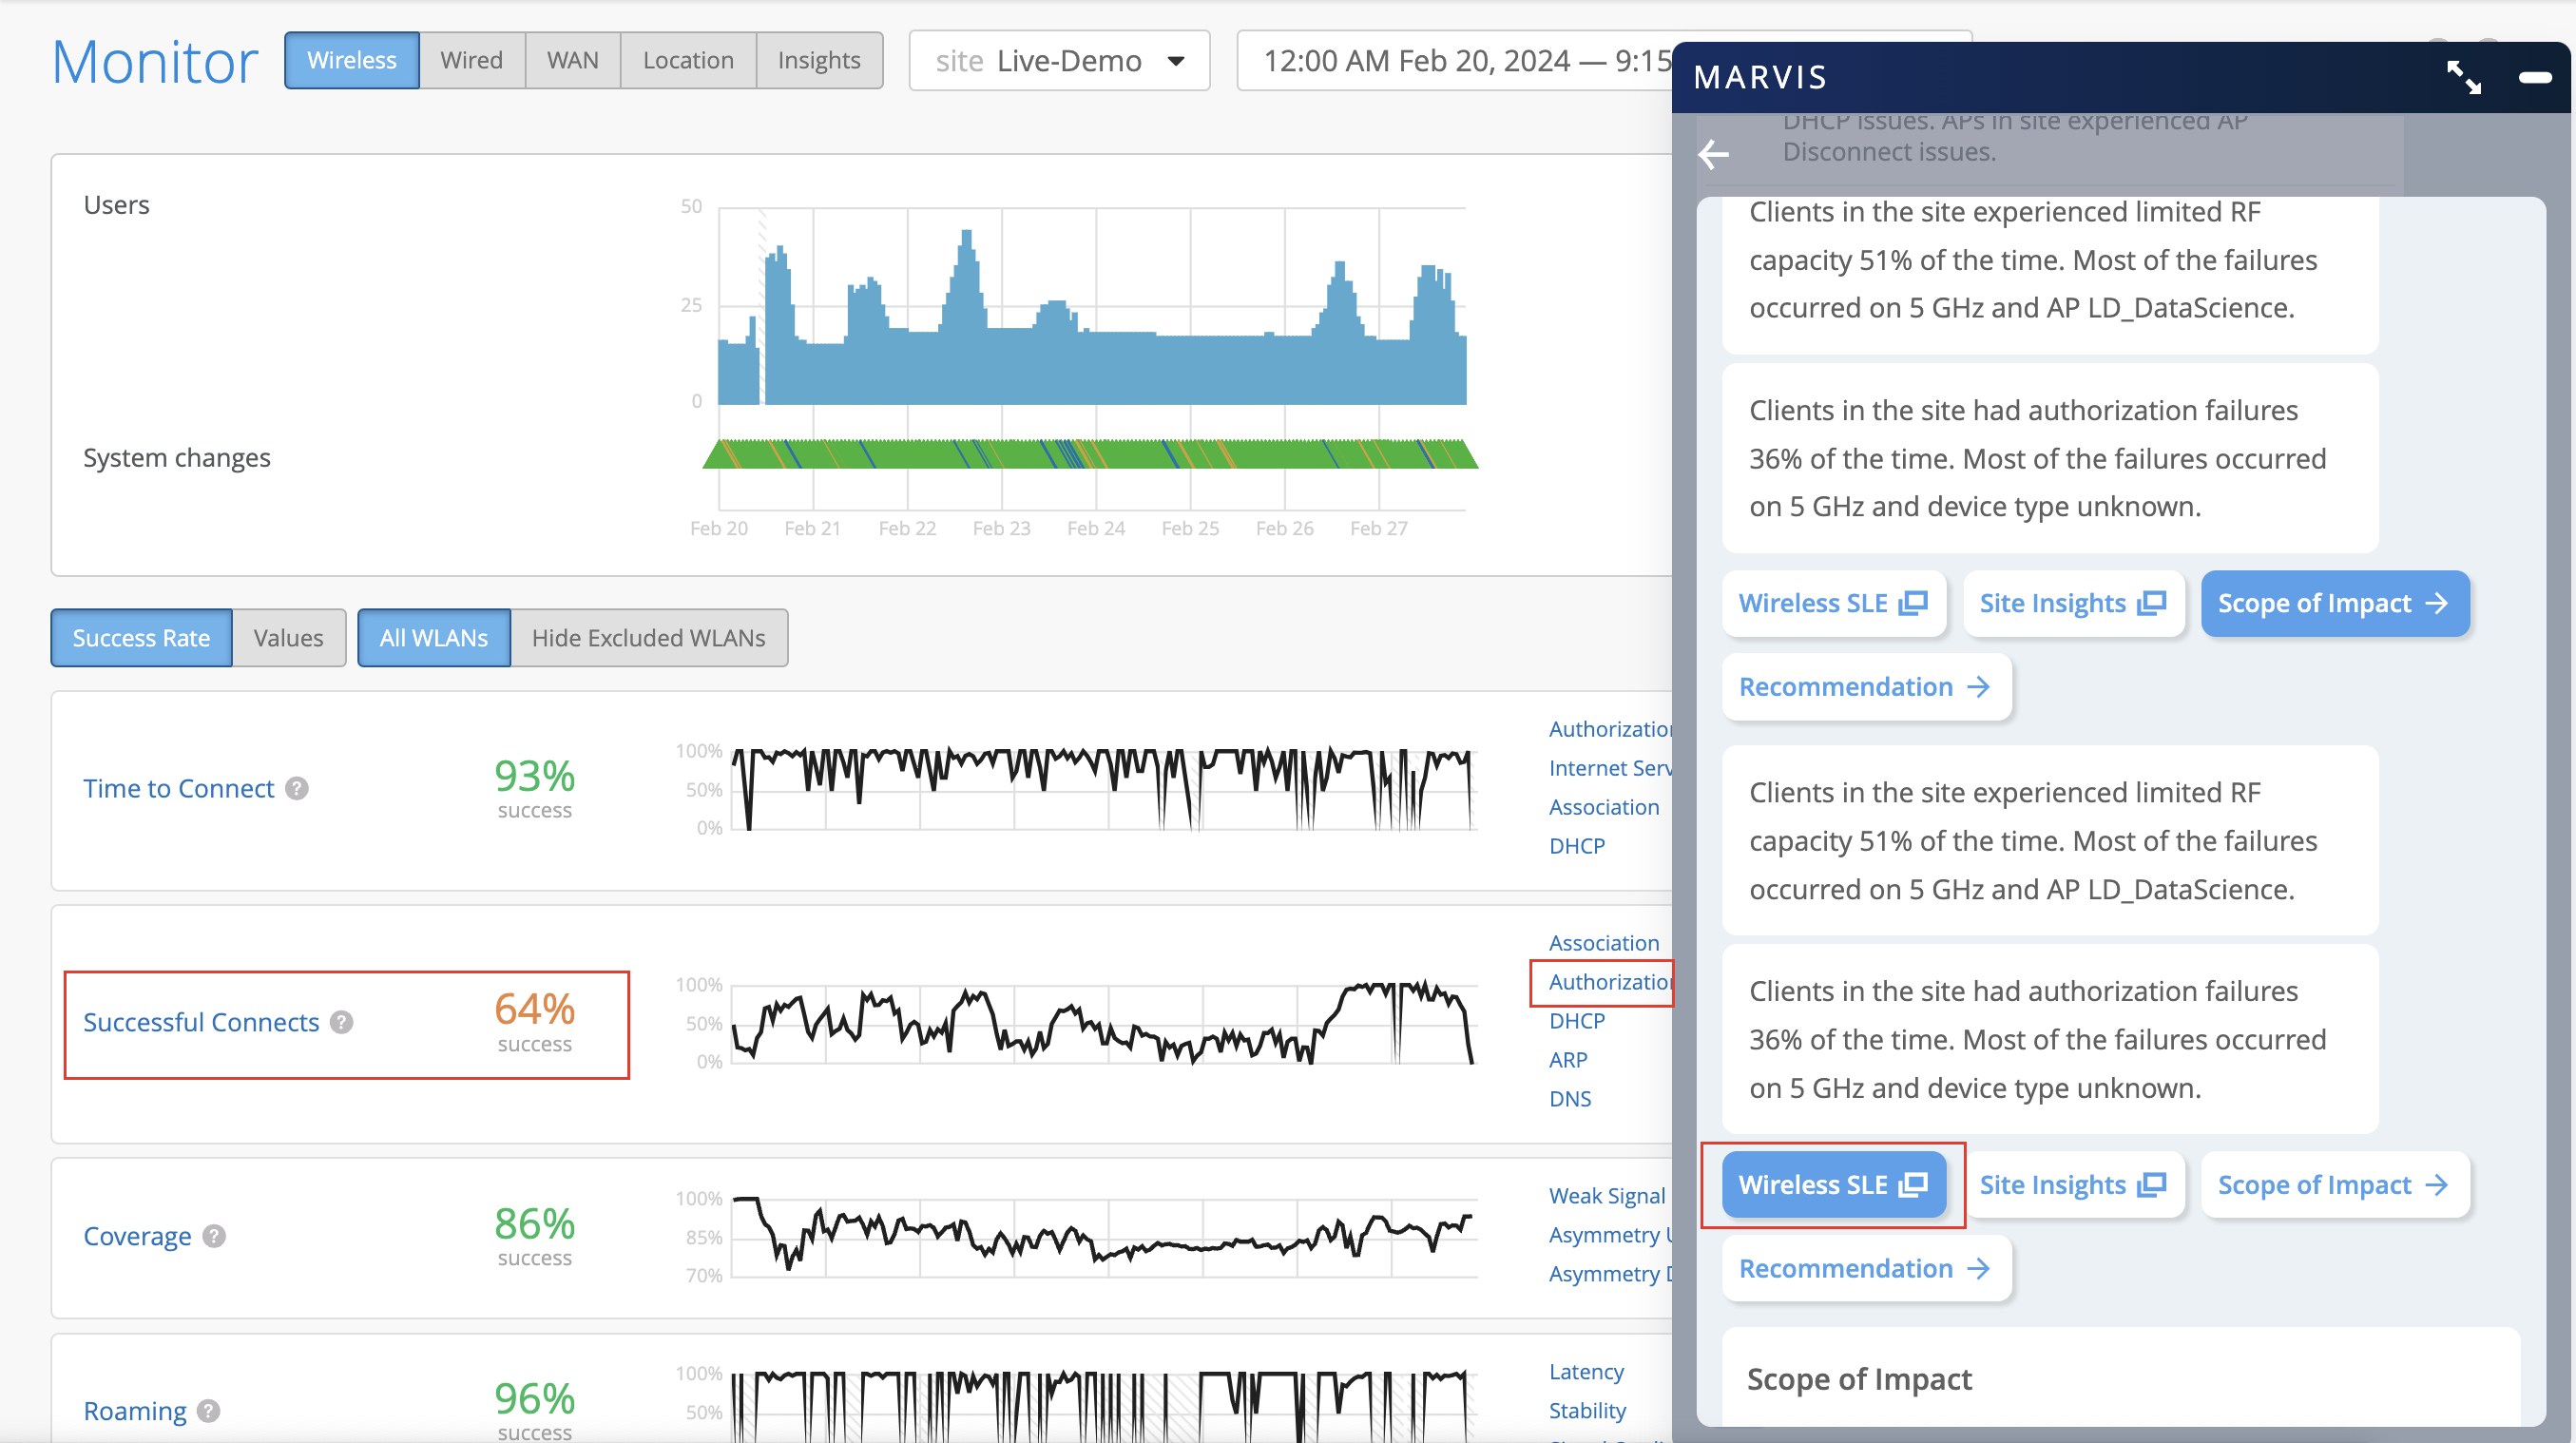
Network monitoring dashboard showing wireless performance metrics and issues. Key data includes 64 percent successful connects, highlighted in red. MARVIS panel lists issues like limited RF capacity and authorization failures on 5 GHz, with recommendations for resolution.

Click the Authorization classifier on the right to view the Root Cause Analysis page. This page provides detailed information. You can look through each of the tabs on the page. For example, you can use the Distribution tab to determine if the issue is being observed across:

  • All APs or specific APs

  • All users or specific users

  • All WLANs or specific WLANs

  • All device types or specific device types
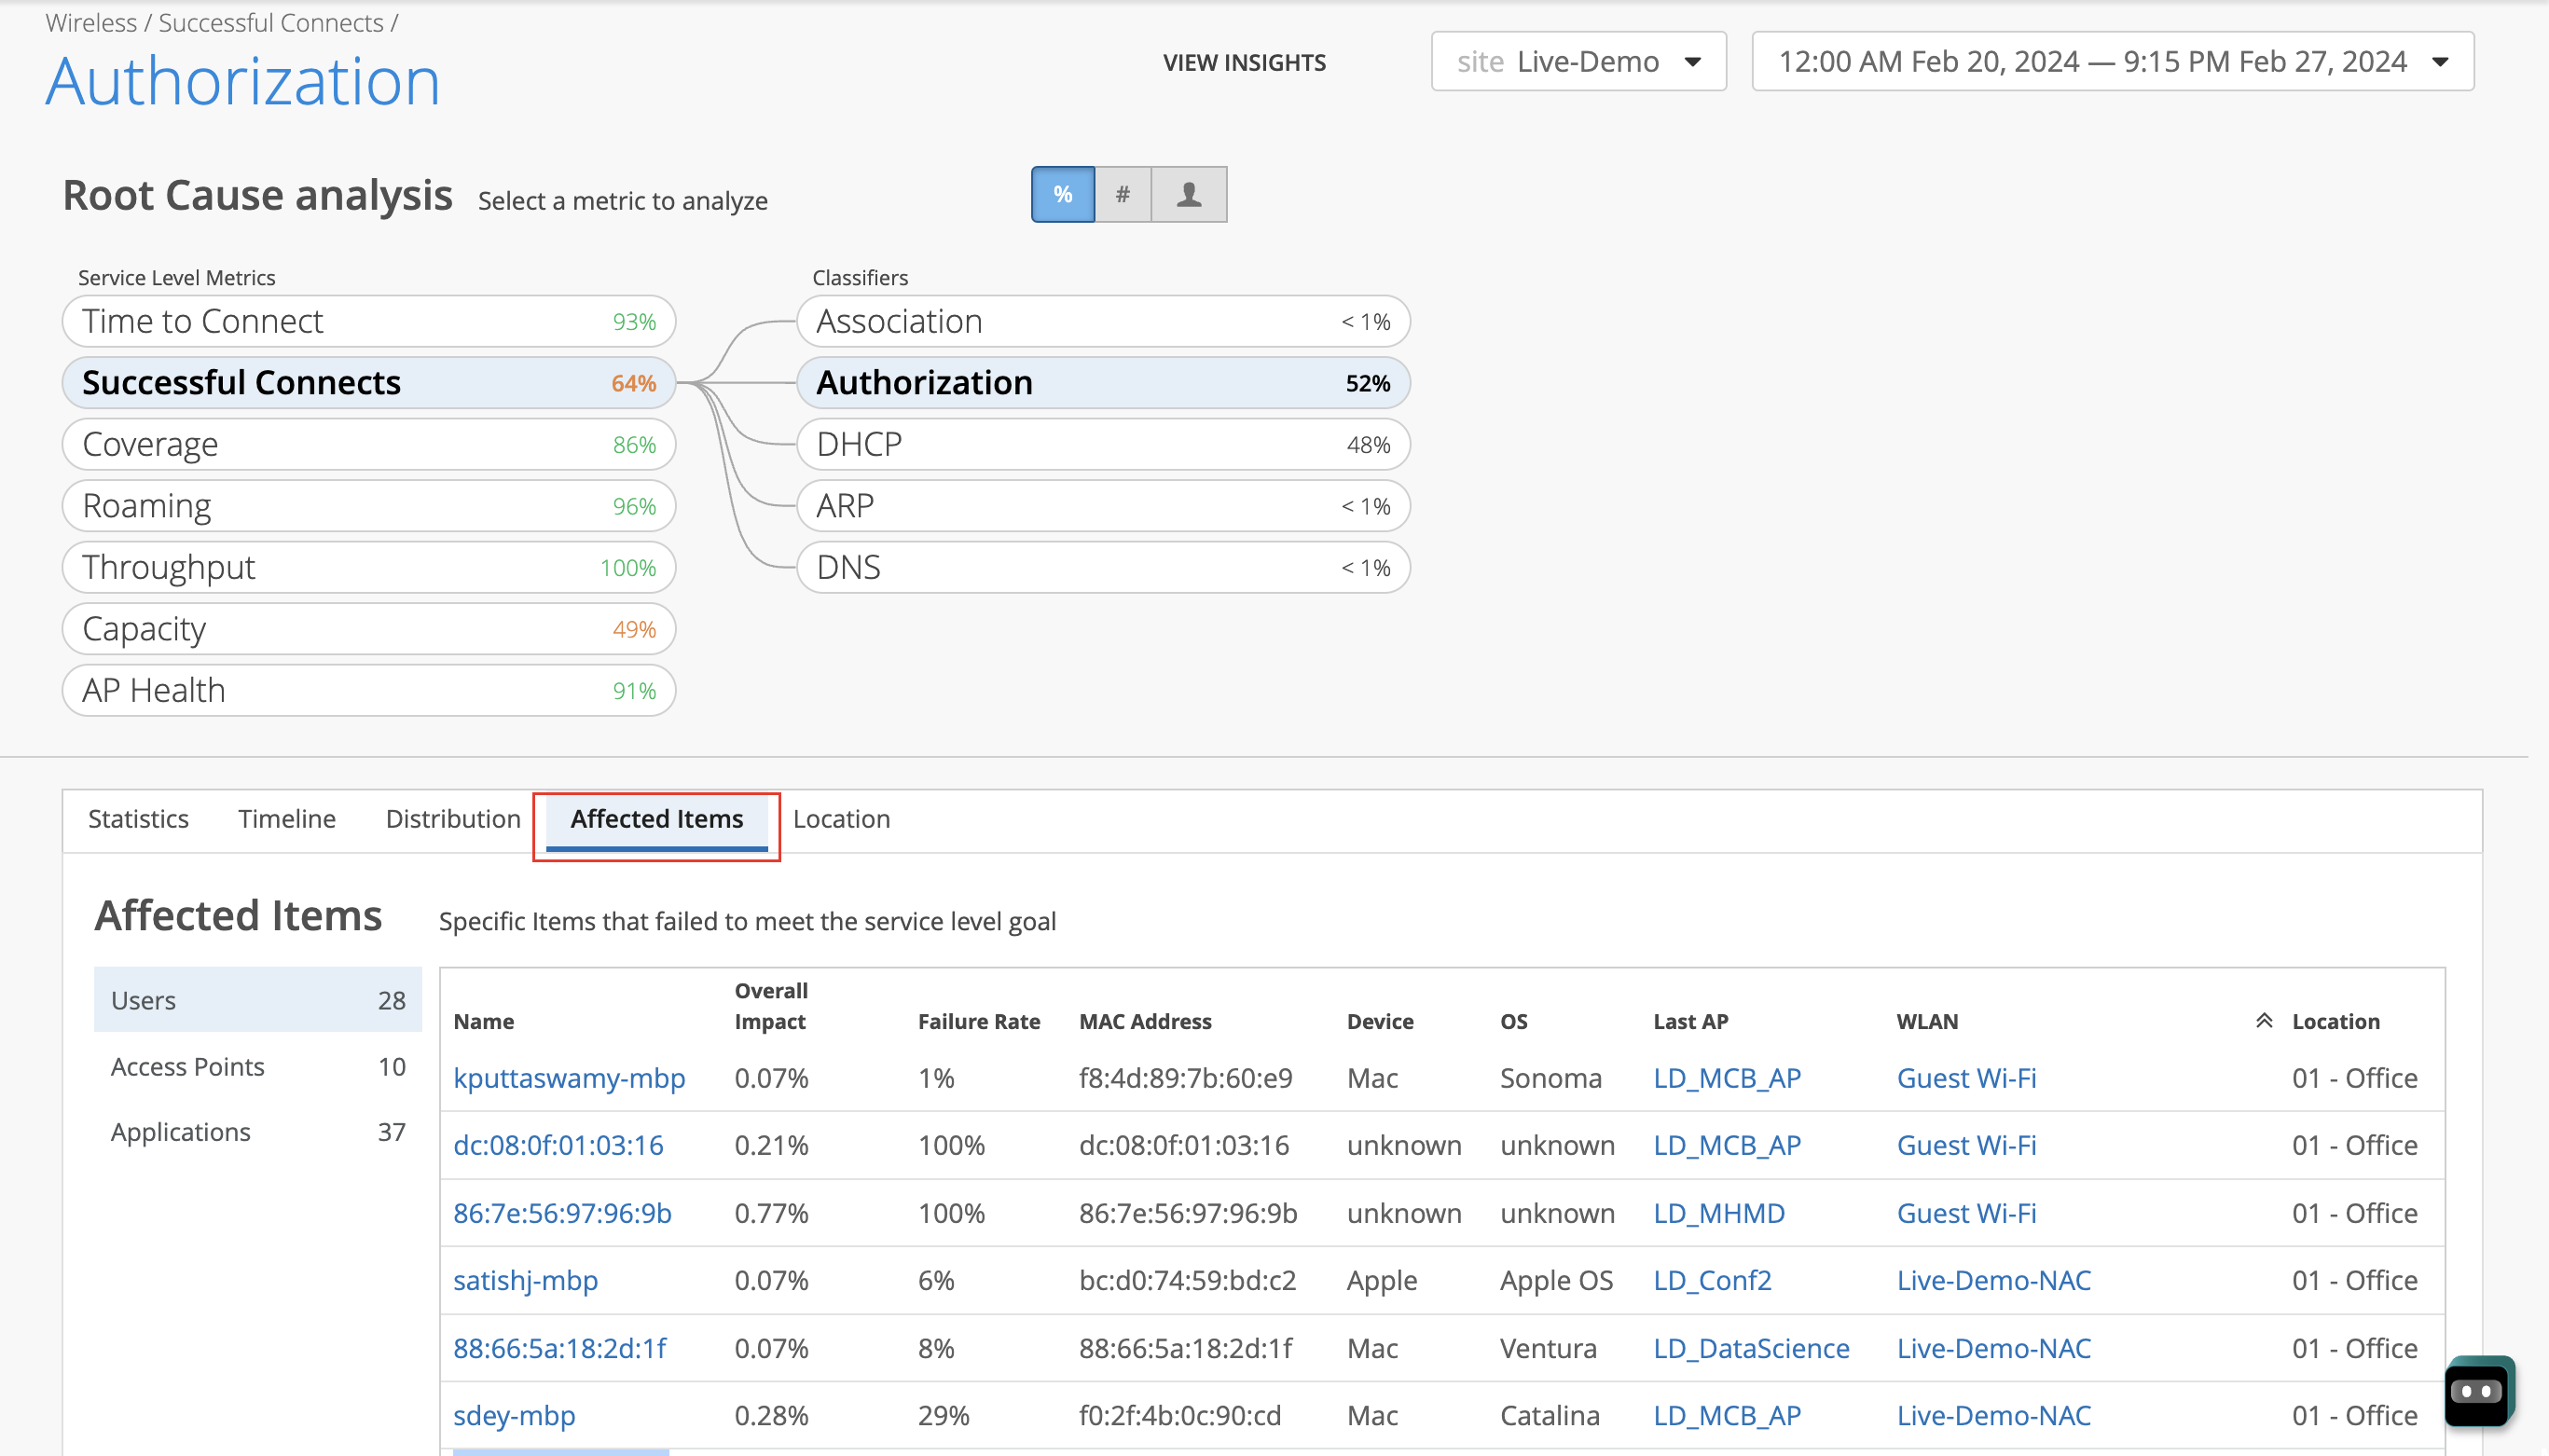
Dashboard analyzing wireless network performance, highlighting Successful Connects with a 64 percent success rate and Authorization as a major classifier with 52 percent impact. Includes root cause analysis metrics, affected items with failure details, and filters set to Live-Demo from February 20, 2024, to February 27, 2024.

The Affected Items tab displays the impacted users, APs, and applications. You can drill down further by clicking a user. The Failure Rate column indicates whether the user always fails to connect. Users experiencing a 100-percent failure rate over a long period of time are listed under the Persistently Failing Clients category in Marvis Actions as shown in the following example:
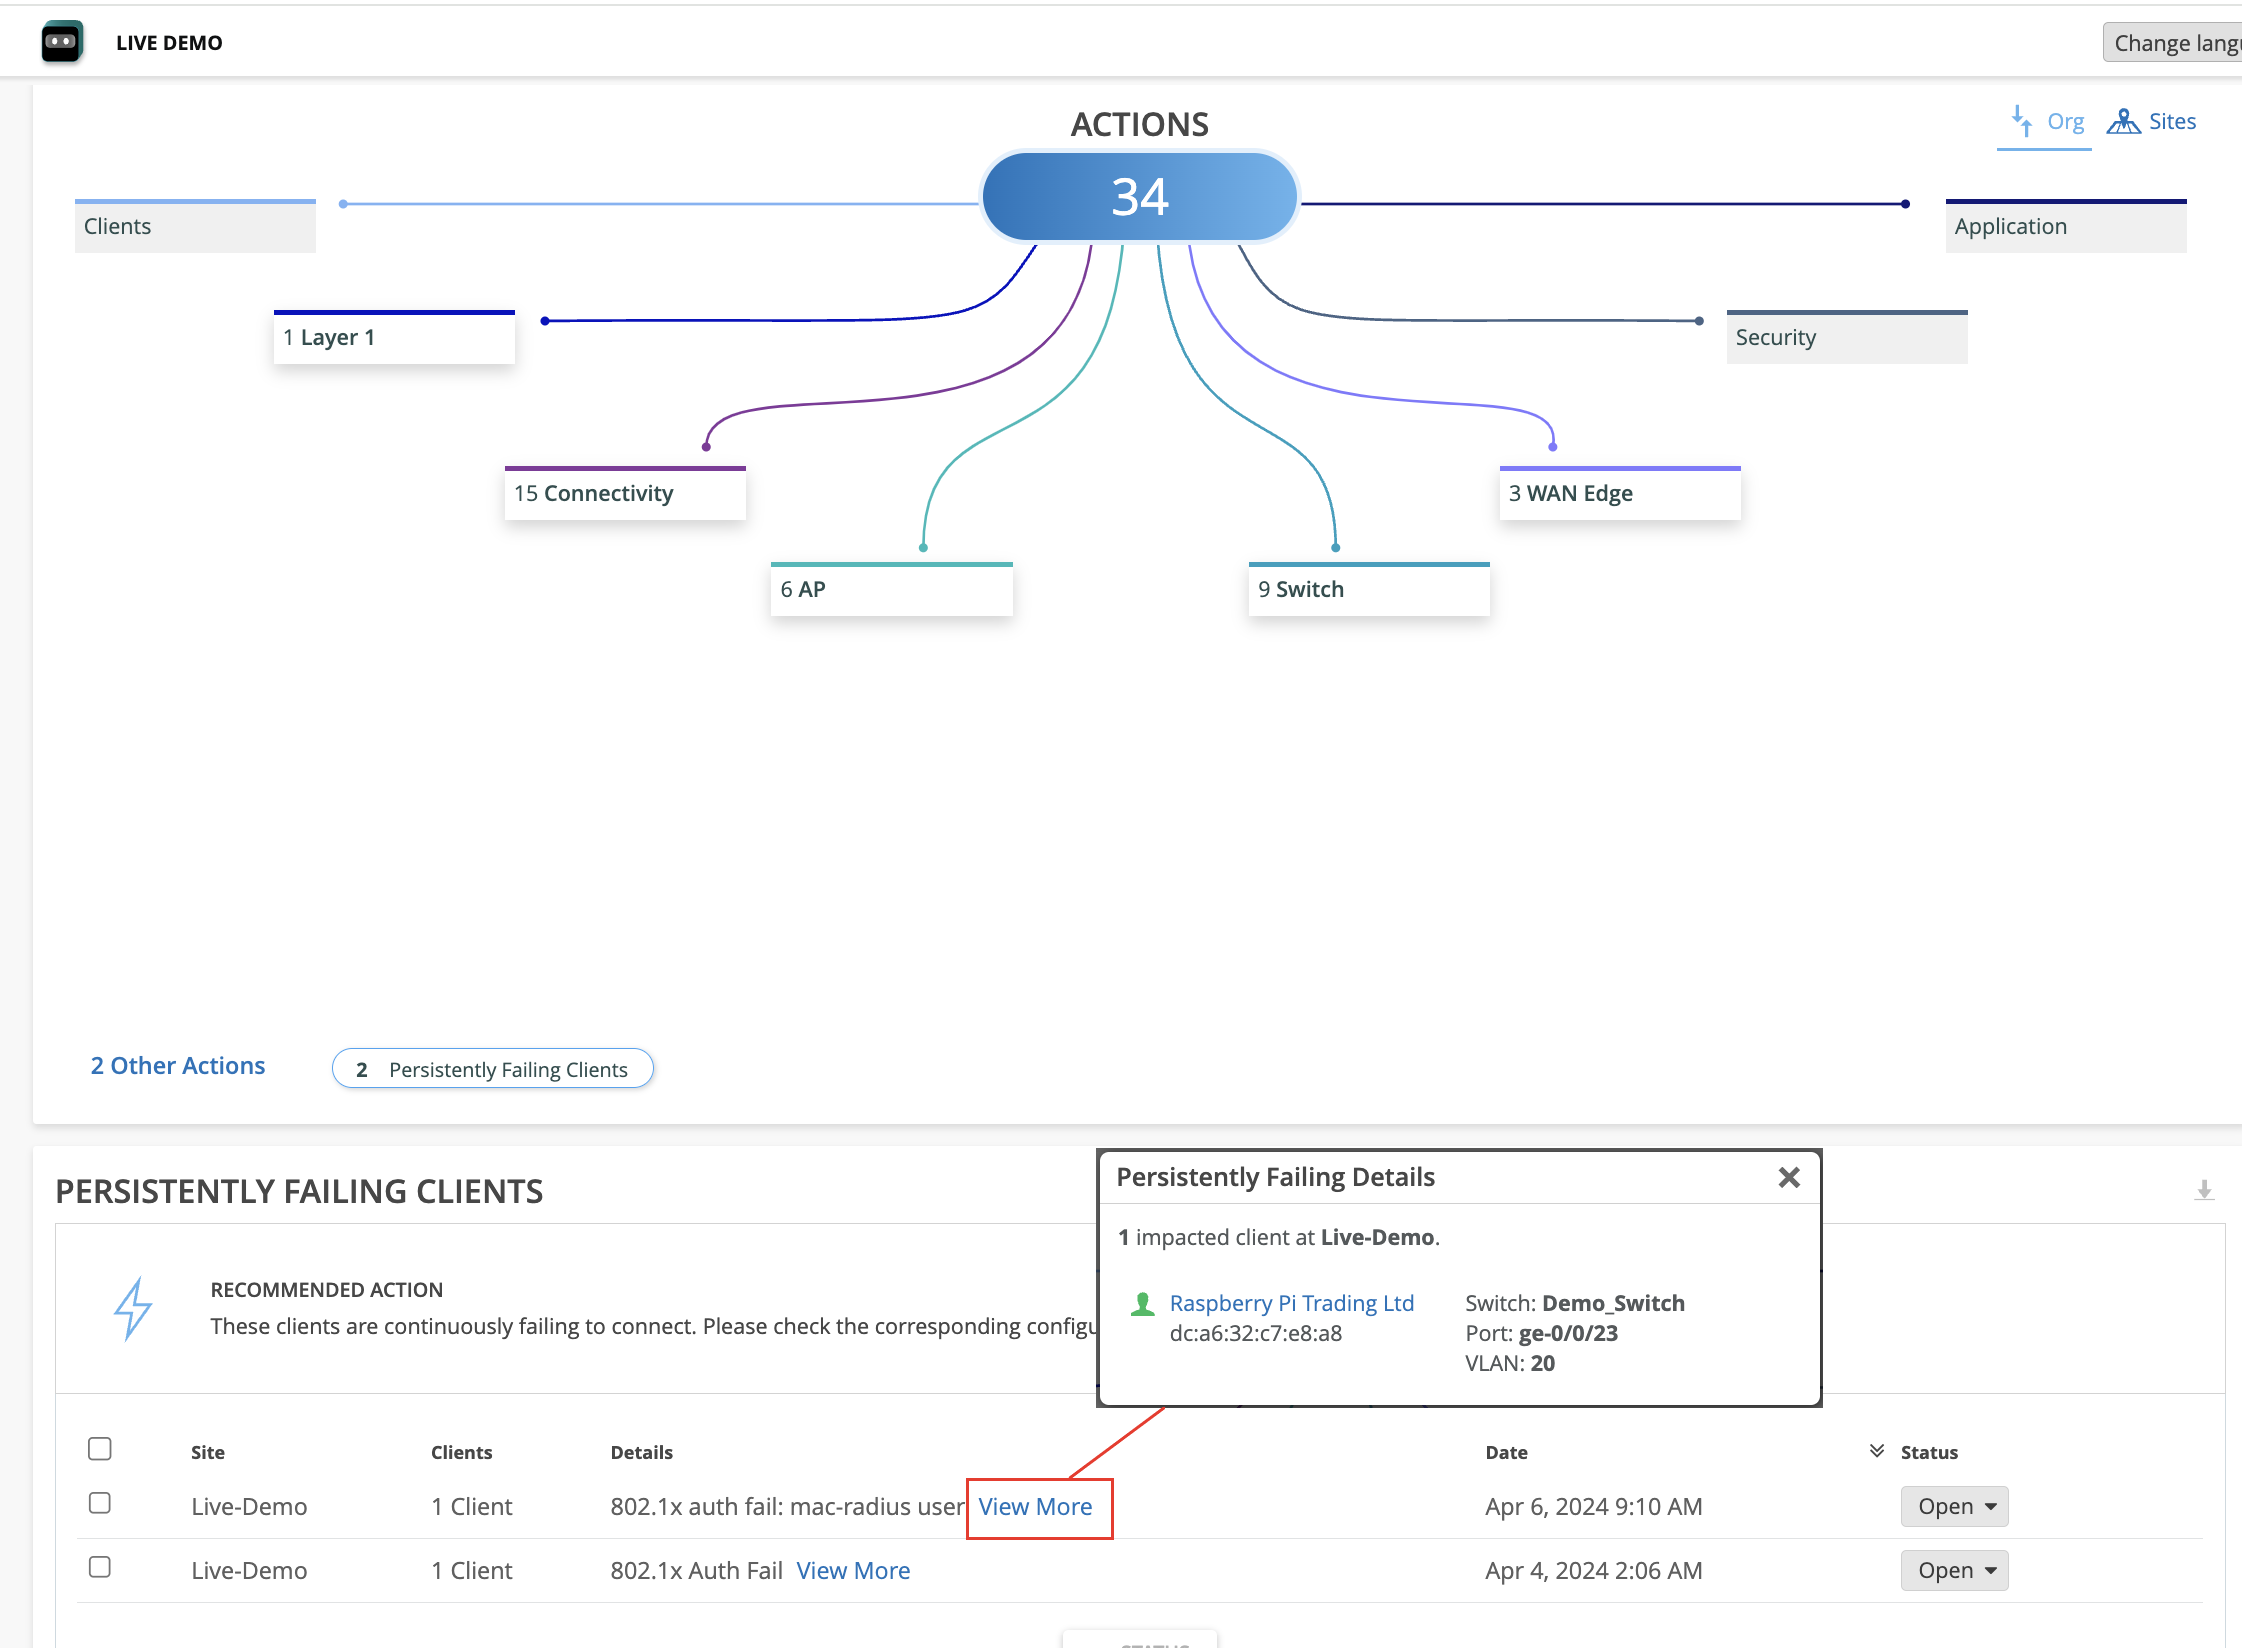
Dashboard showing network issues: 34 actions categorized into Clients, Connectivity, AP, Switch, WAN Edge, Application, and Security. Bottom section lists persistently failing clients with site names, failure details, timestamps, and statuses. Detailed view includes client name, MAC address, switch name, port, and VLAN. Options for filtering by organization or site and changing language are available.

To troubleshoot authorization failures for a client:

  1. In the Marvis conversational assistant window, enter tshoot client followed by the MAC address or hostname of the client. In the following example, you’ll see that Marvis detects an authorization error for the client.
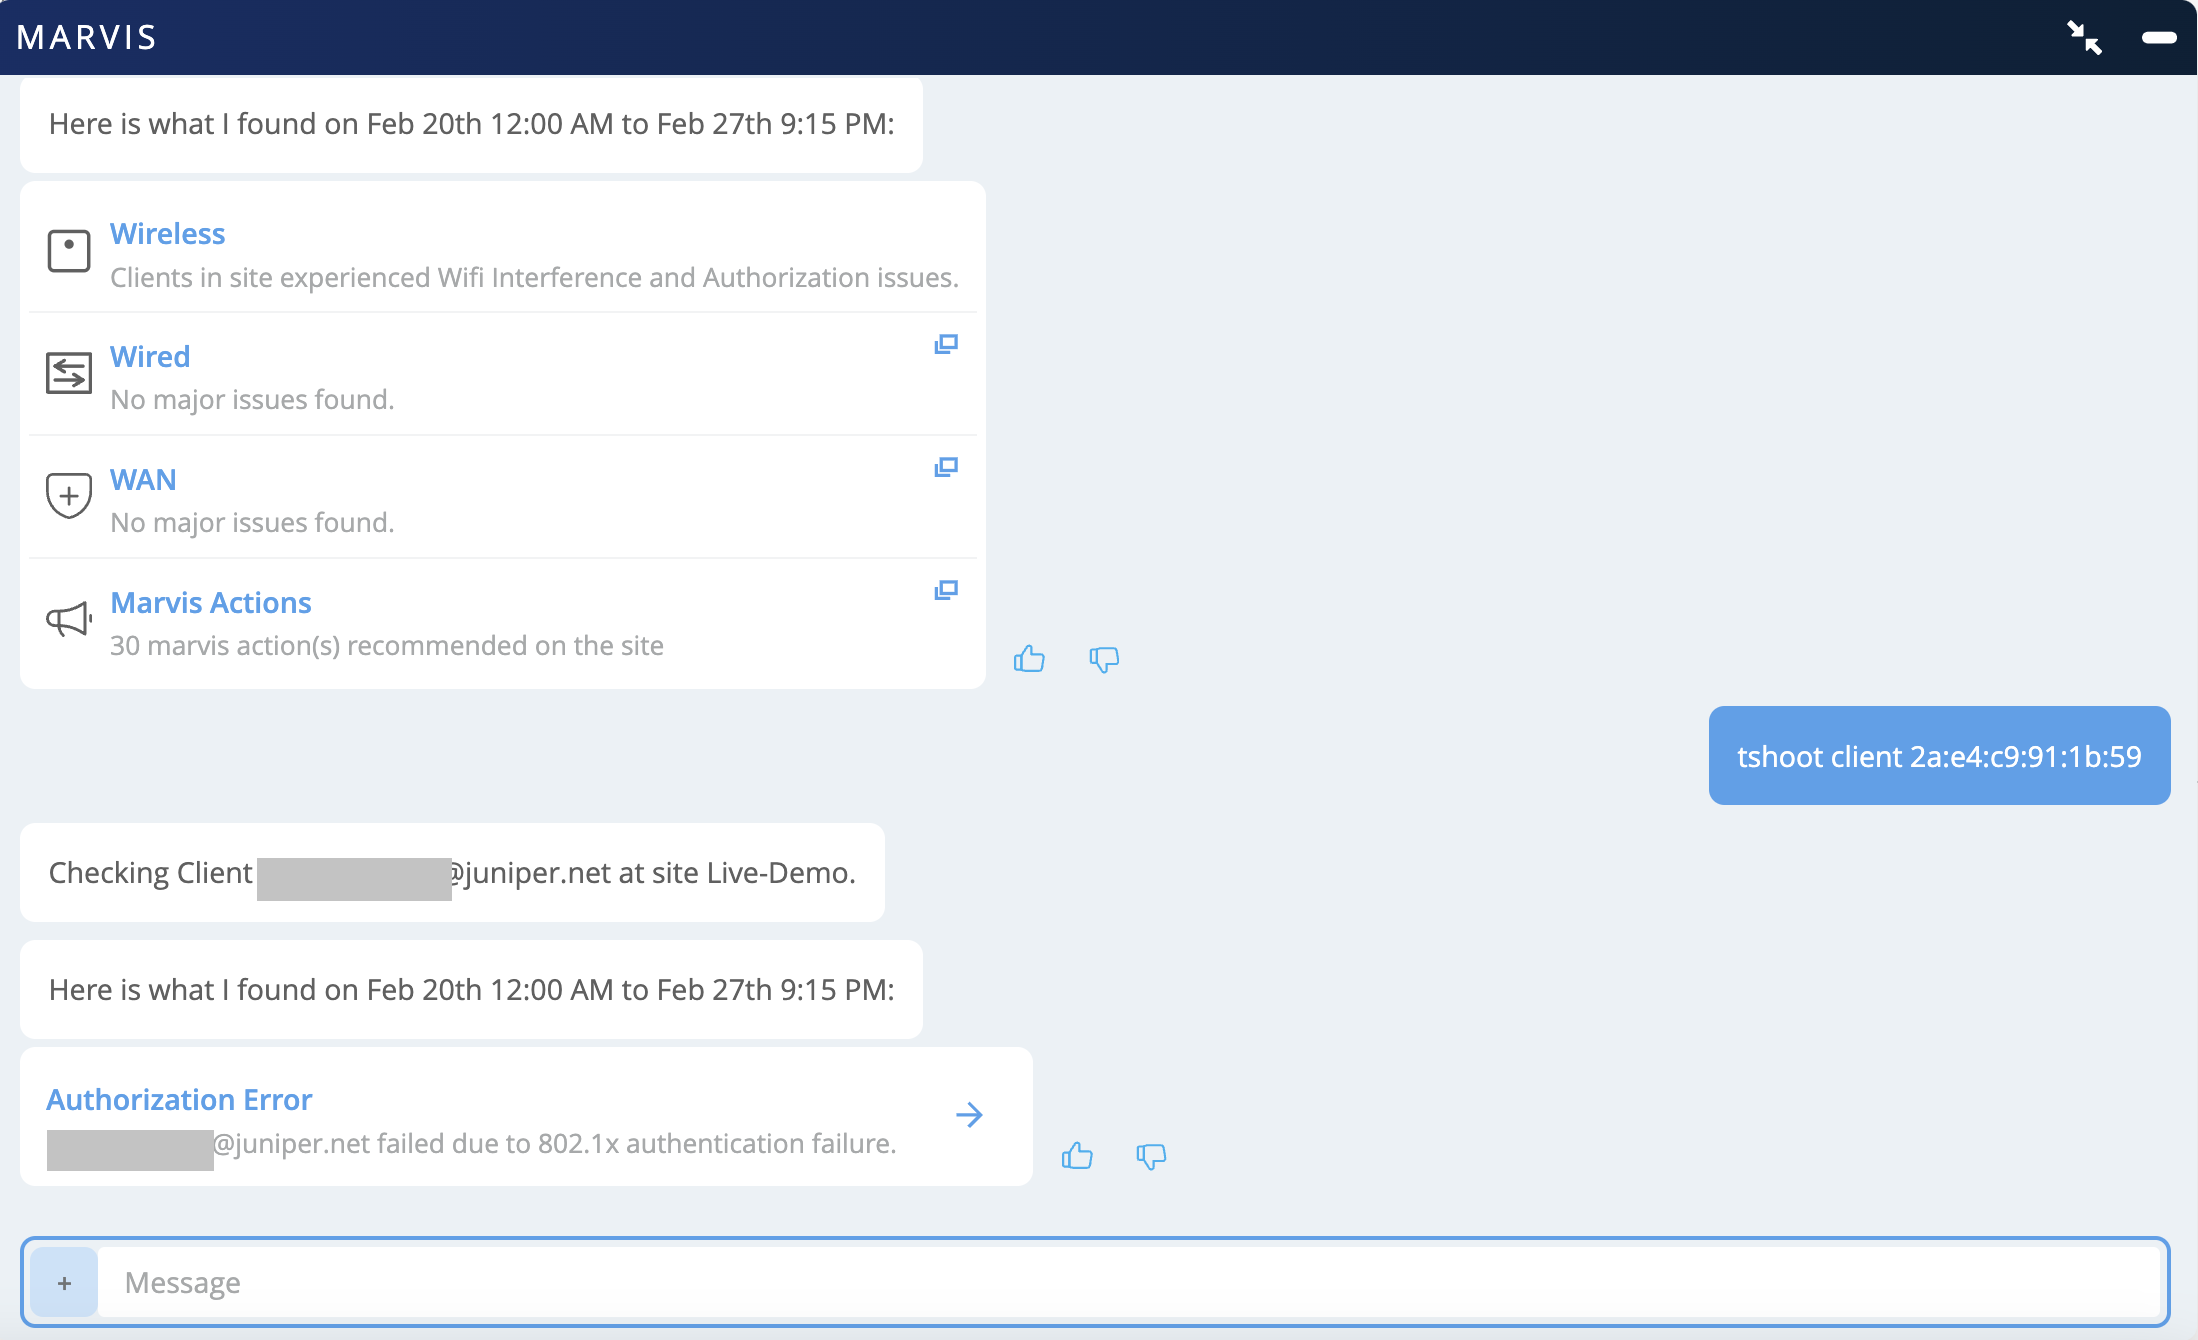
    Troubleshooting interface from Marvis showing network diagnostics. Summary includes WiFi interference and authorization issues, 30 recommended actions, and an 802.1x authentication failure for a specific client. Feedback options available.

  2. Click Authorization Error to view more details. In this example, you’ll see that Marvis reports that the client faced authorization failures 100 percent of the time.
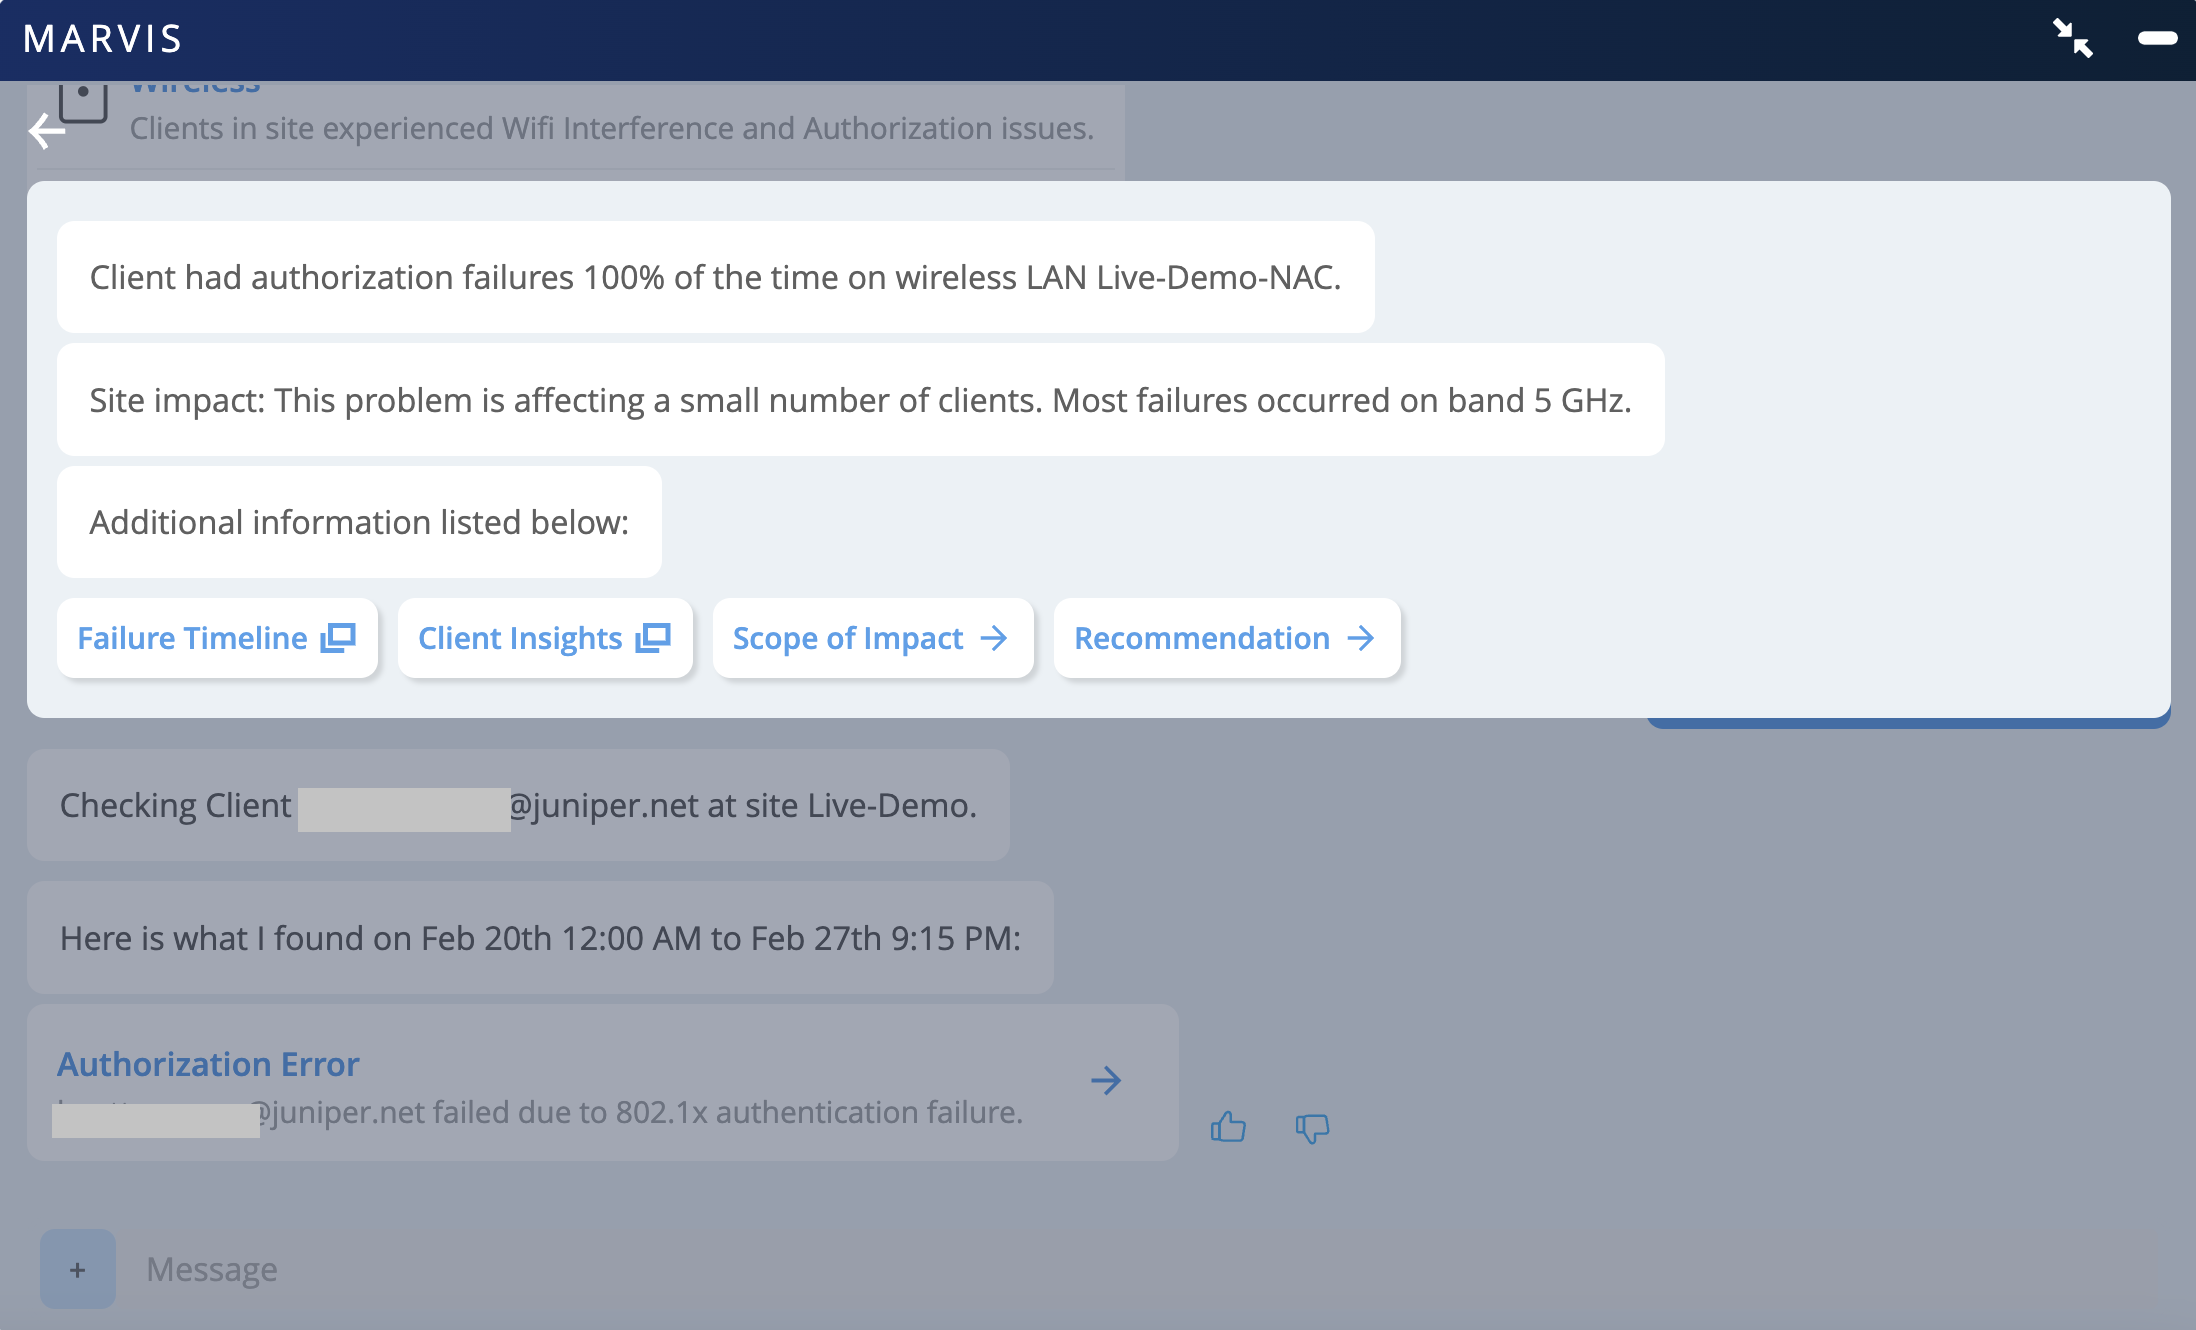
    Client experiencing 100 percent authorization failures on wireless LAN Live-Demo-NAC due to 802.1x authentication issues from Feb 20th to Feb 27th. Most failures occurred on the 5 GHz band. Options for further investigation include Failure Timeline, Client Insights, Scope of Impact, and Recommendation.

    Note that Marvis also reports this issue on the Marvis Actions page, under the Connectivity category.

As we are looking into a client-specific issue, you can click Client Insights. The Client Events section lists all the events associated with the clients. You can click the authorization failure event to see the reason for the failure.
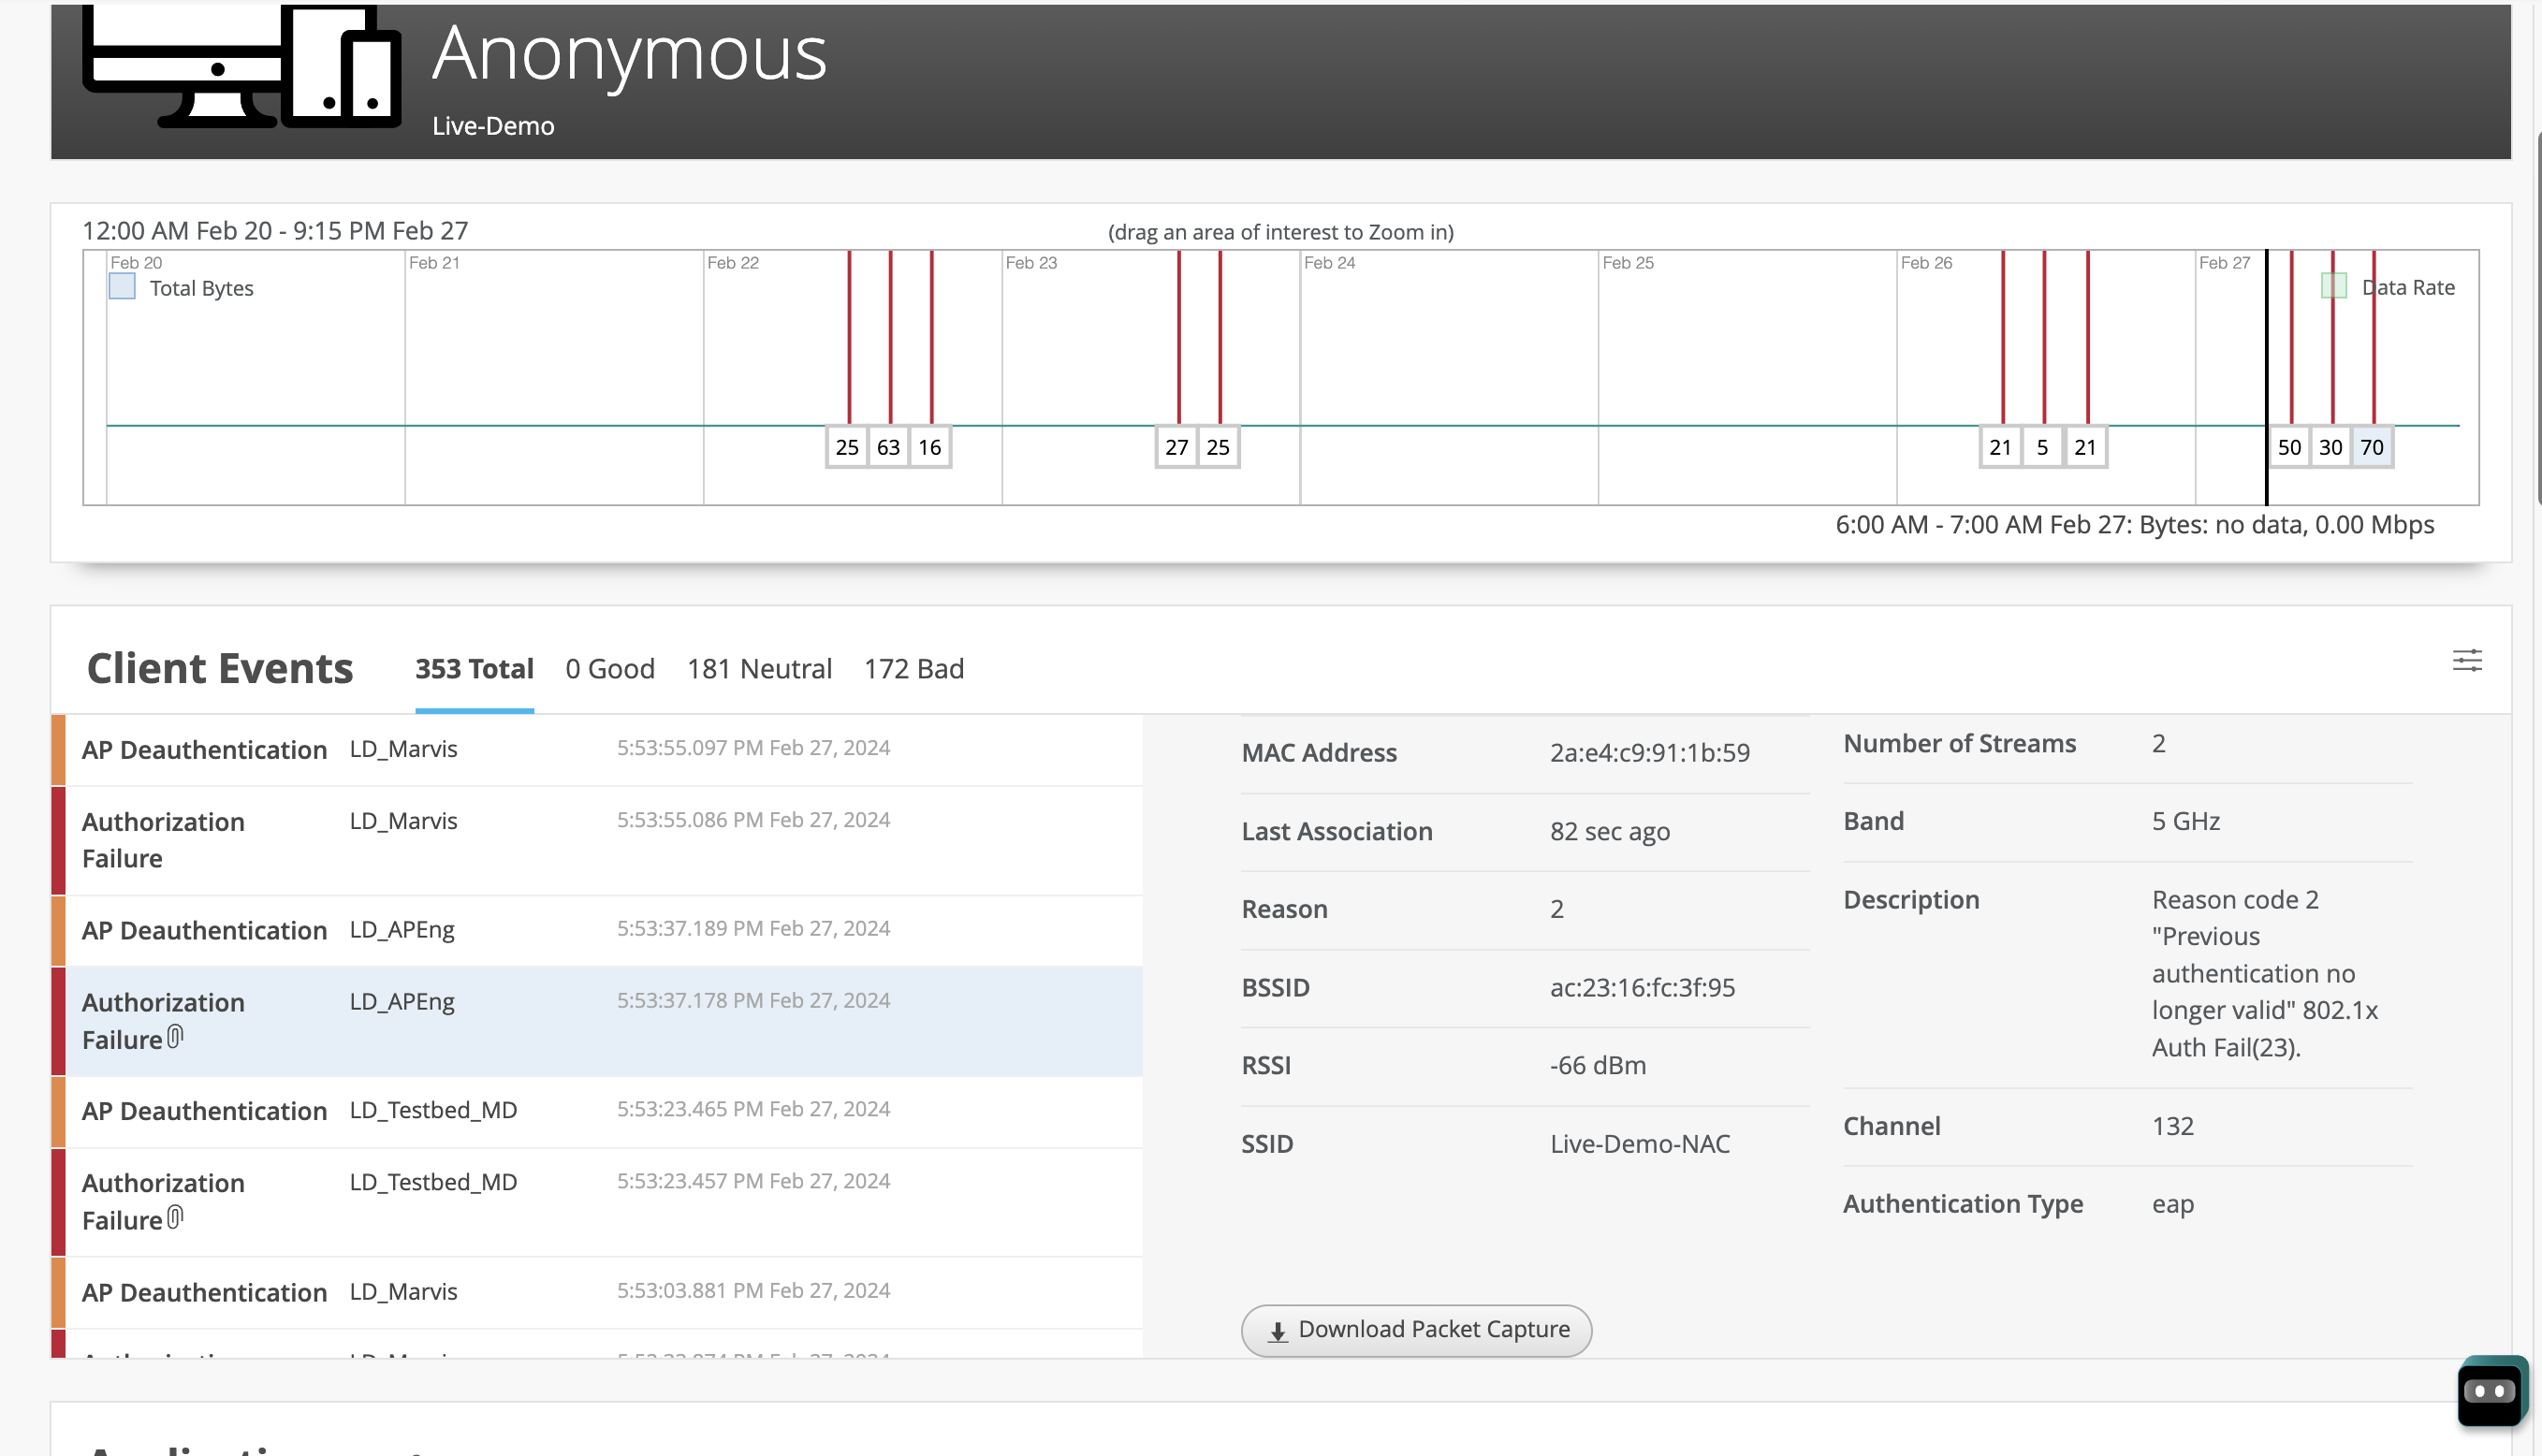
Network monitoring dashboard showing data usage graph from February 20 to 27, client events like AP Deauthentication, client details including MAC Address and RSSI, and a download packet capture button.

You can also download the packet capture for the authorization failure. Here is a sample packet capture. You can see that the client does not respond to identity requests and repeatedly tries to connect without providing a client identity response.
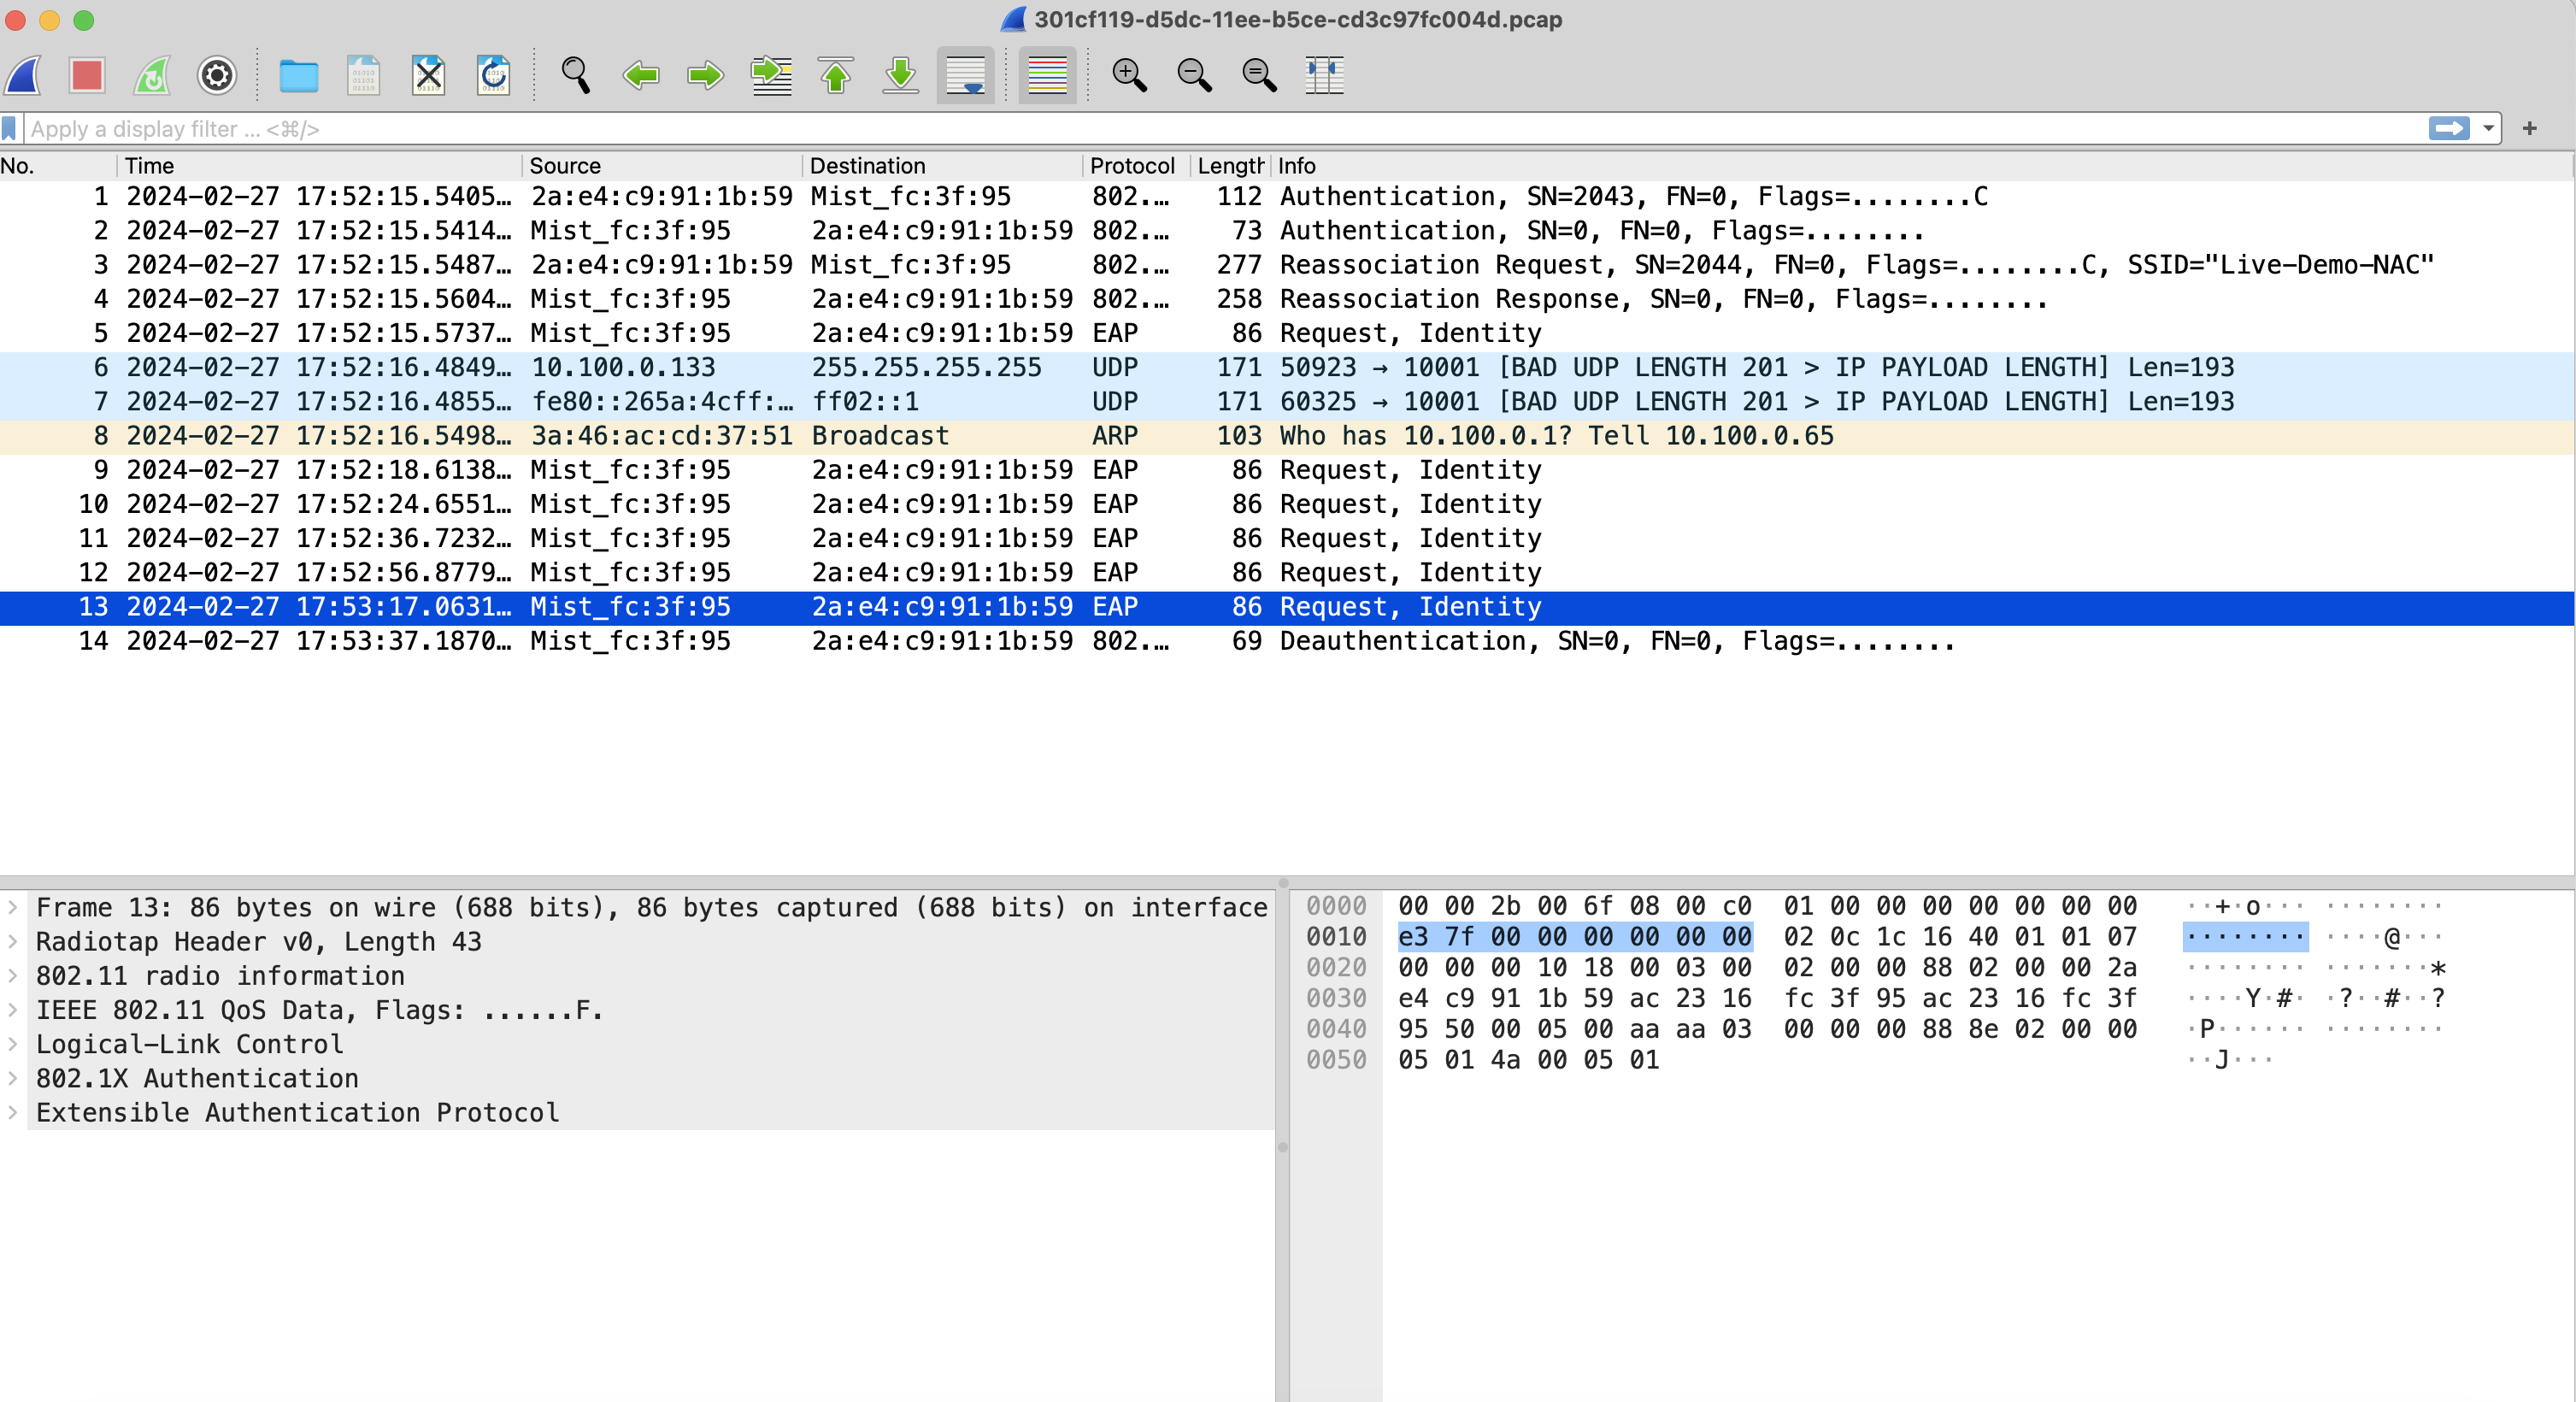
Wireshark interface analyzing network packet capture with highlighted EAP Request Identity message, showing packet list, details, and raw data bytes.

Troubleshoot DHCP Issues

Clients might face connectivity issues when they fail to obtain an IP address due to a lack of response from the Dynamic Host Configuration Protocol (DHCP) server.

To troubleshoot DHCP issues:

  1. In the Marvis conversational assistant window, enter tshoot client followed by the MAC address or hostname of the client. In the following example, you’ll see that Marvis detects DHCP issues in the network.
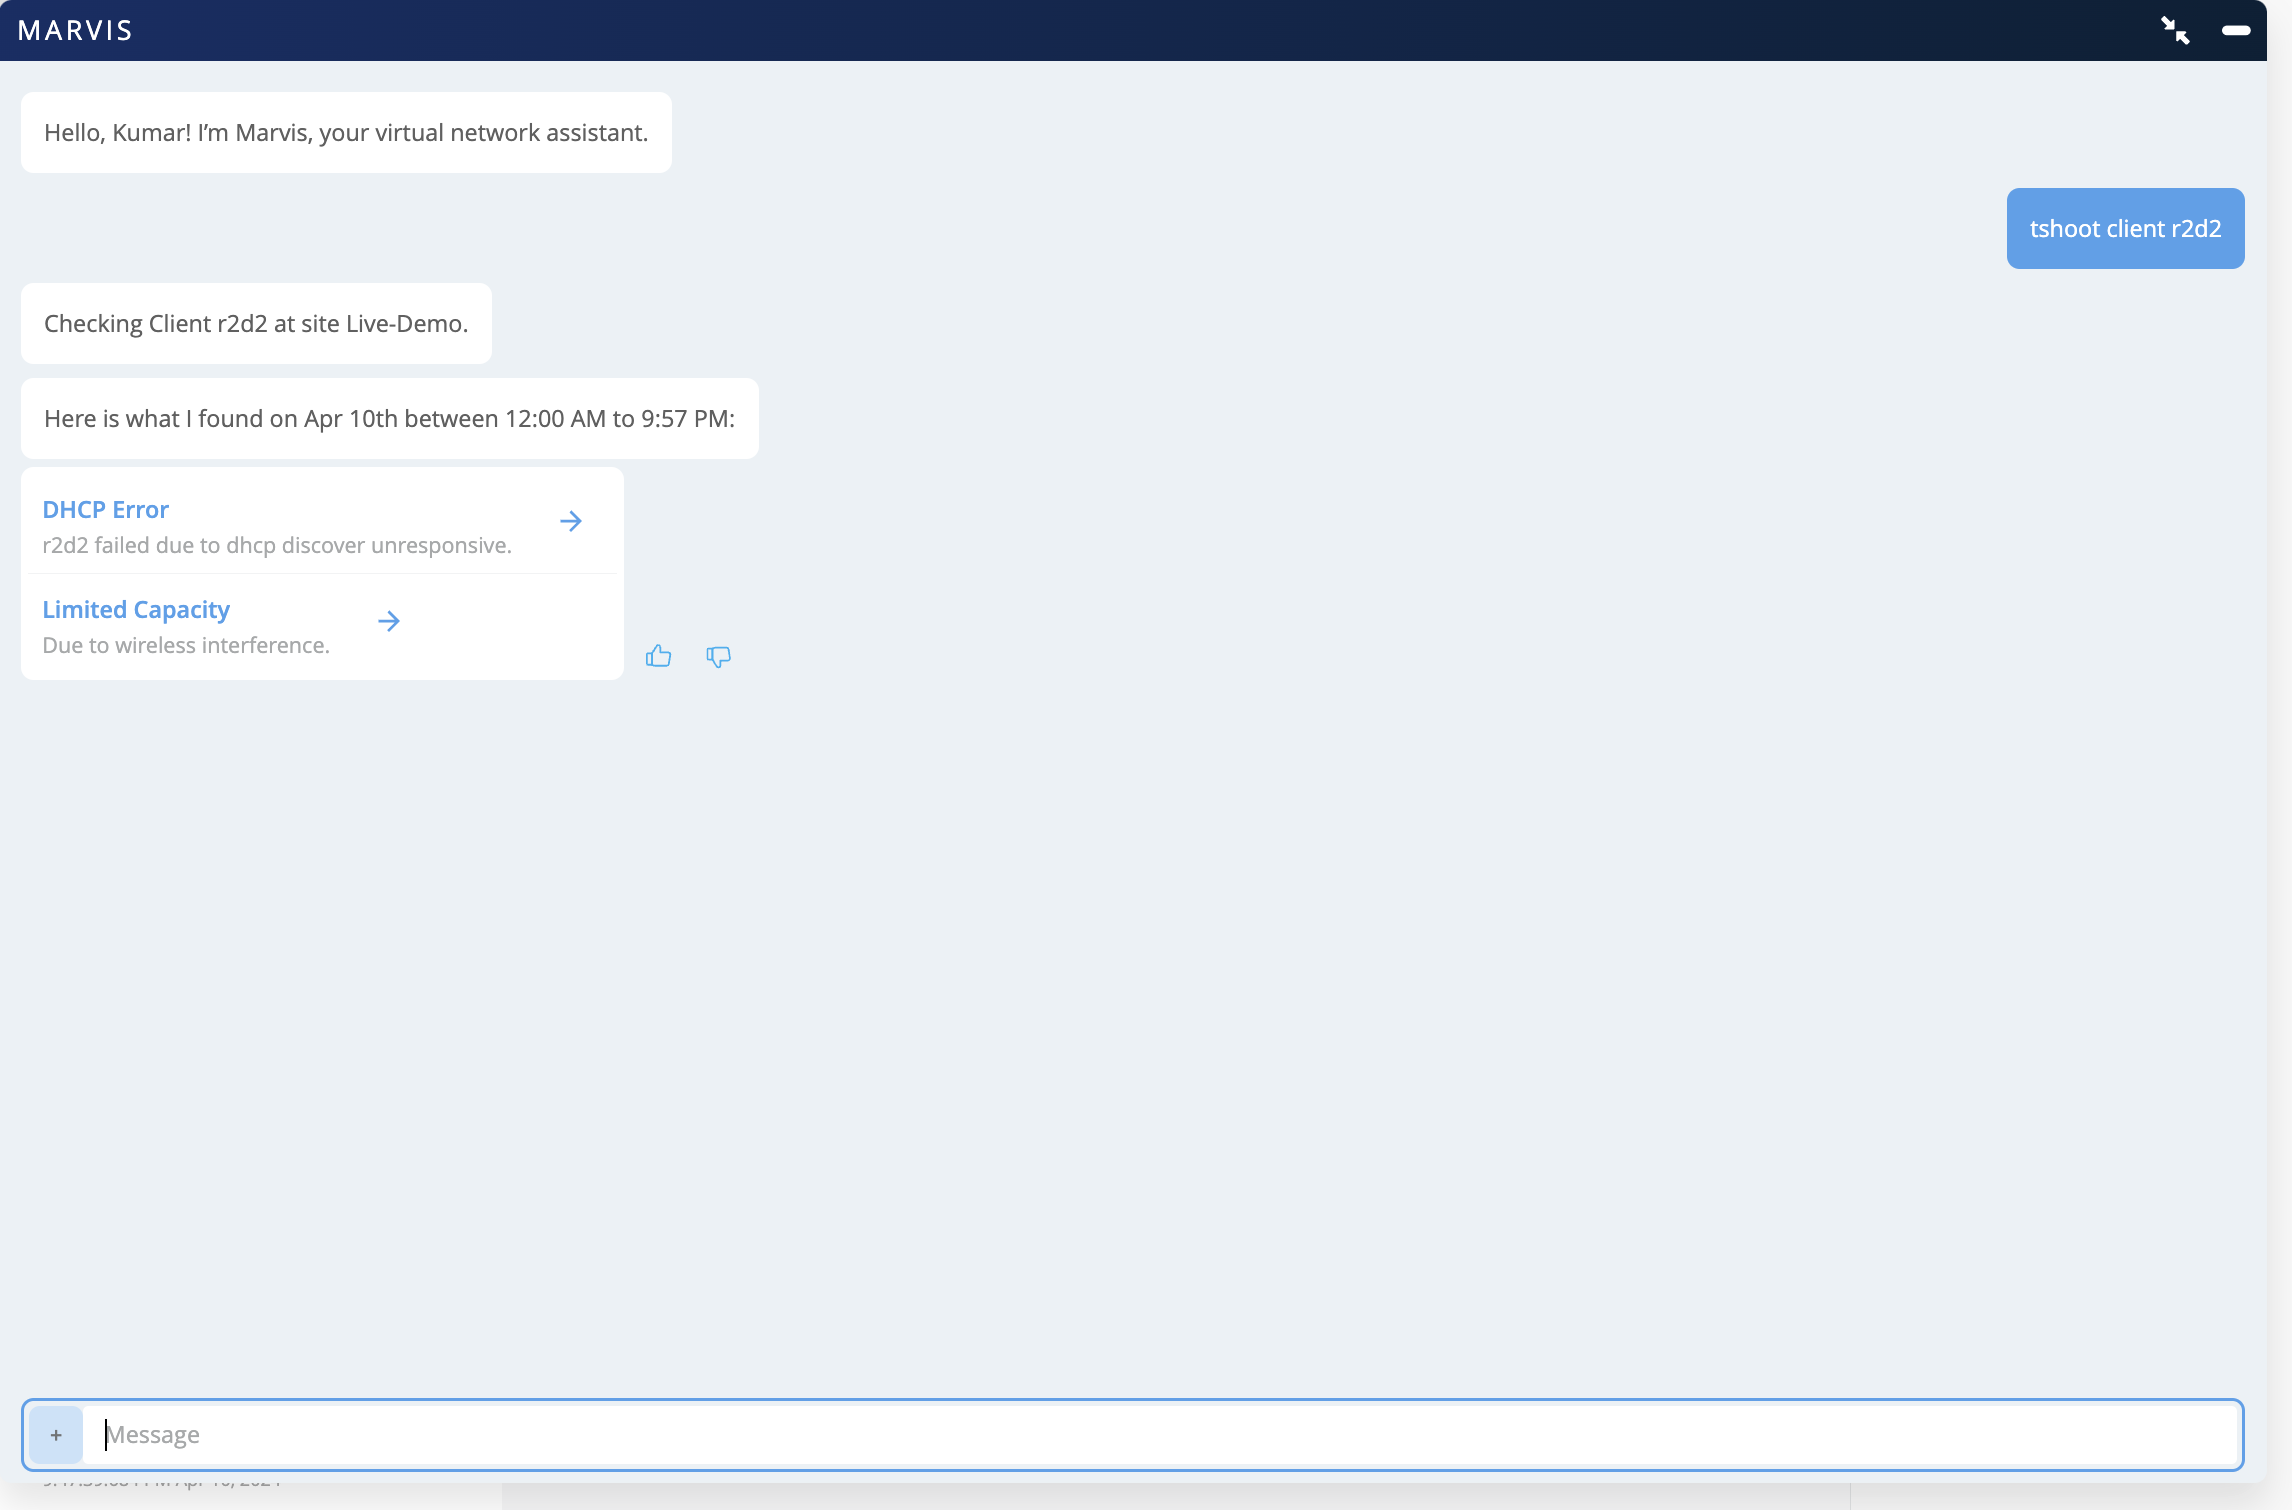
    Virtual network assistant Marvis troubleshooting client r2d2 for April 10th, highlighting DHCP discover unresponsive and wireless interference issues. Links for details and feedback options available.

  2. Click DHCP Error to view the details. In the following example, you’ll see that Marvis reports that a specific client is facing DHCP failures 100 percent of the time.
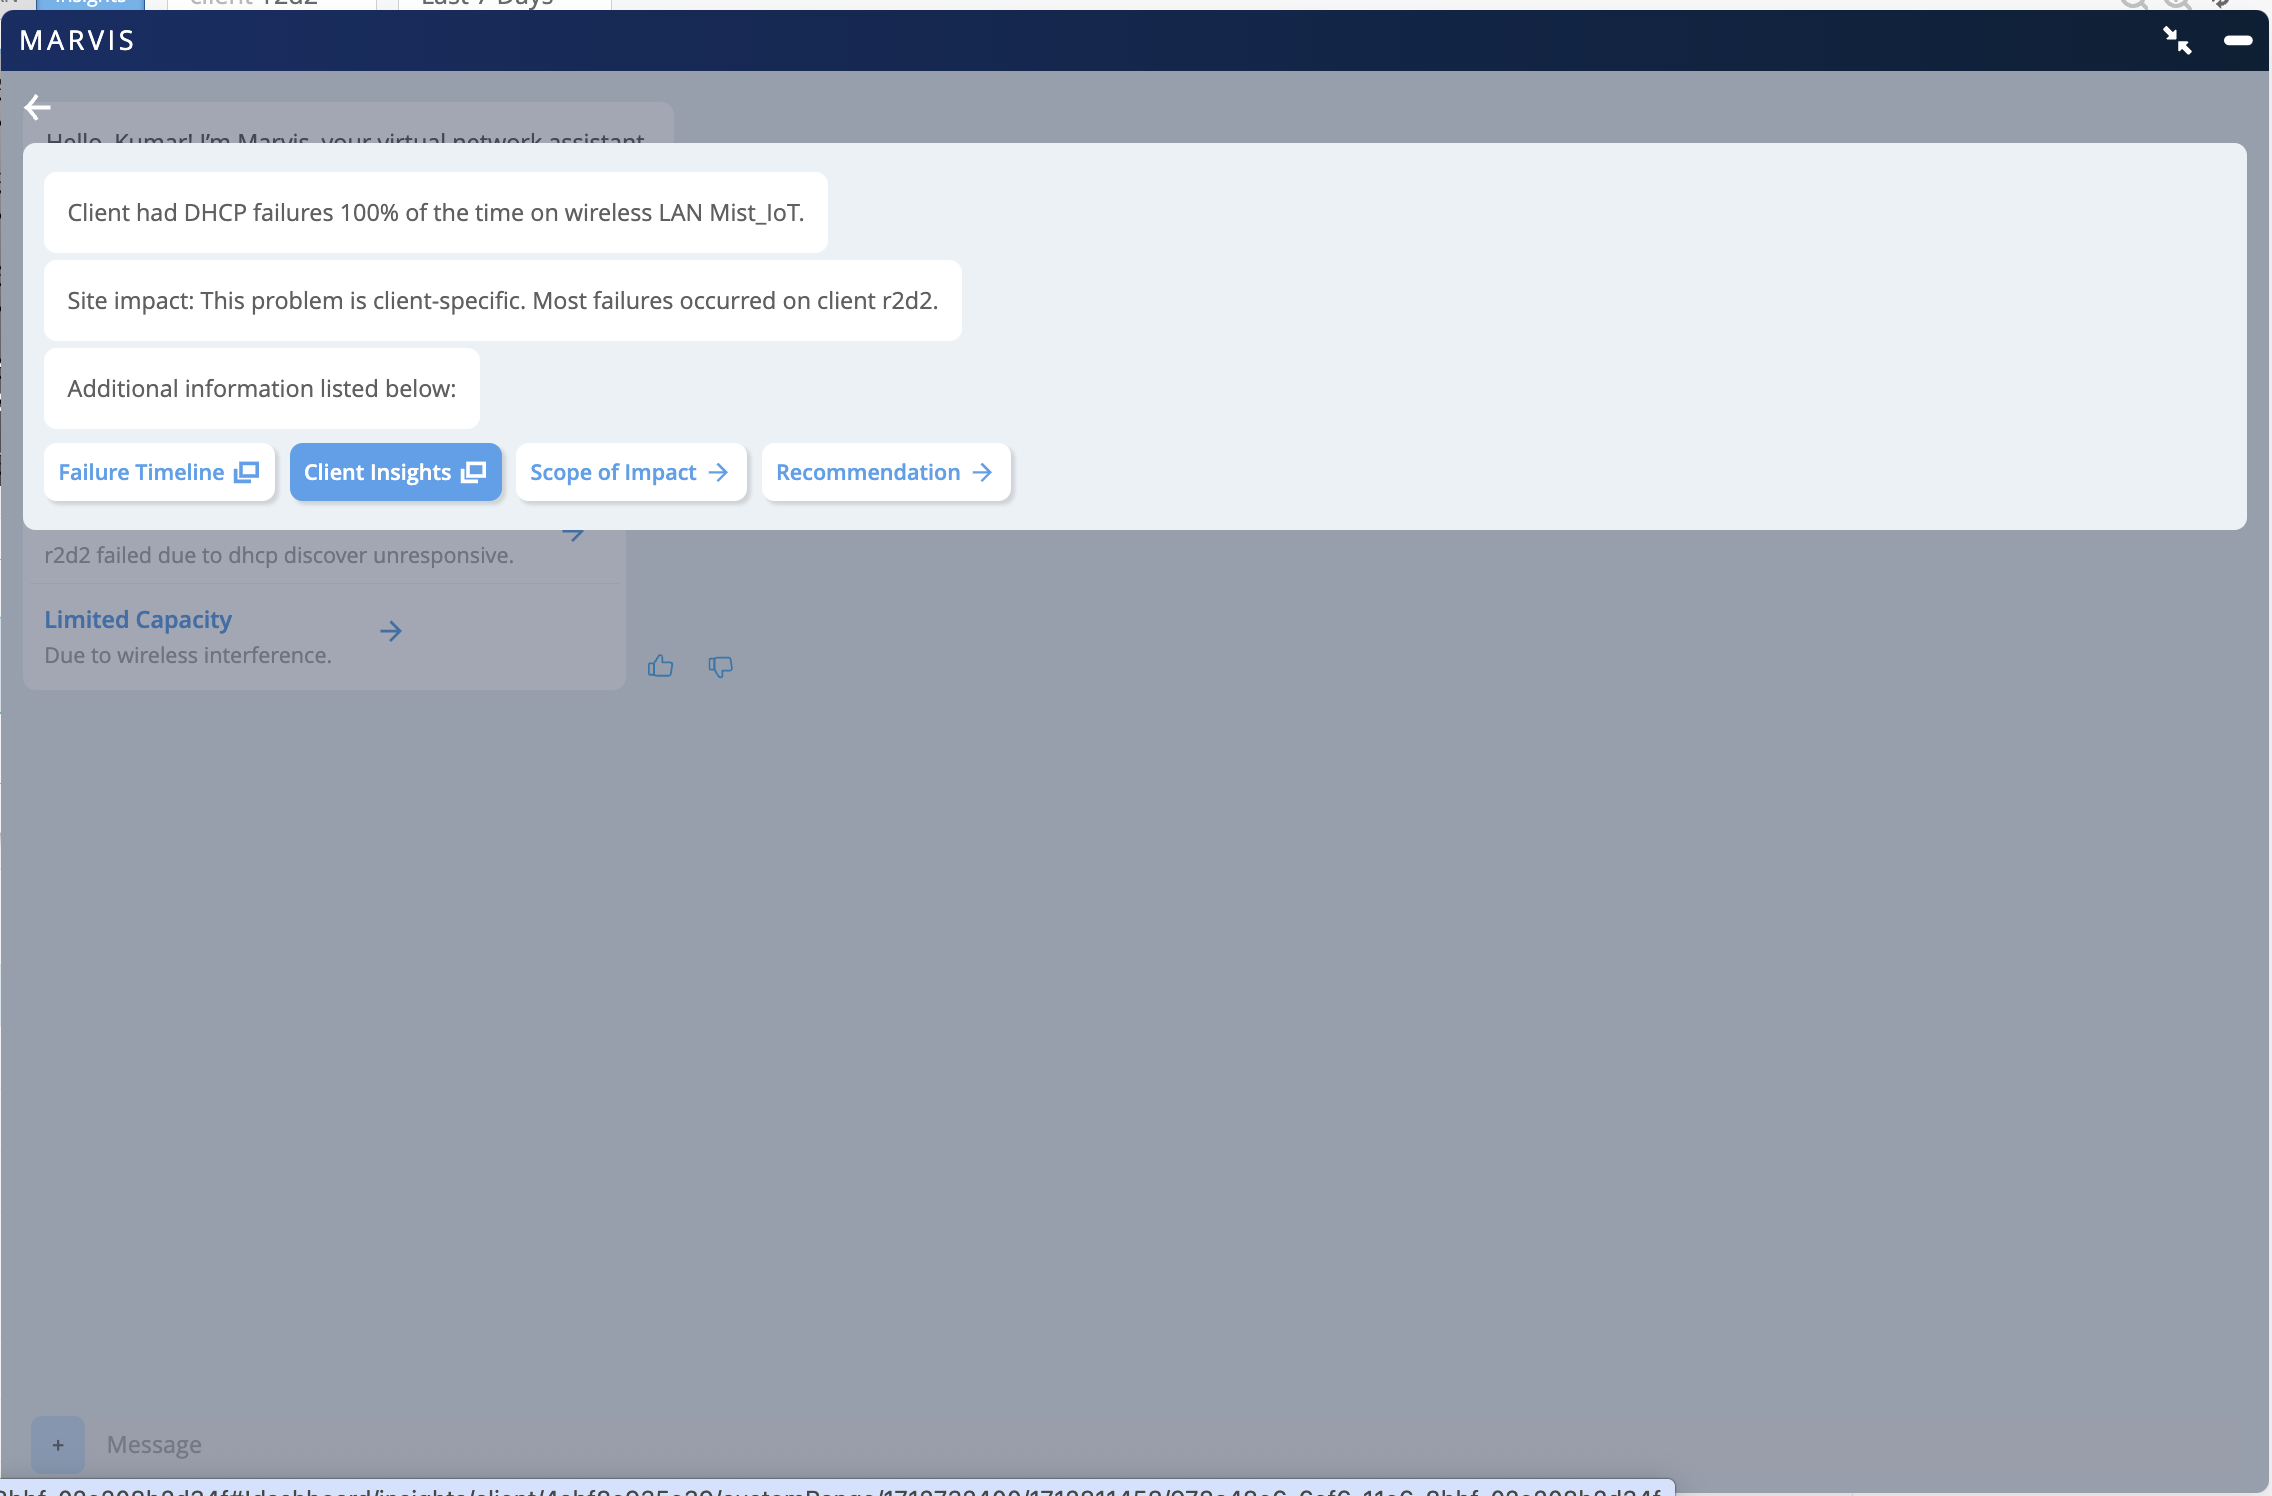
    Network troubleshooting interface from Marvis showing DHCP failures 100 percent on Mist_IoT wireless LAN for client r2d2. Options include Failure Timeline, Client Insights, Scope of Impact, and Recommendation.

You can investigate further by using the options displayed.

Scope of Impact

You can start by looking at the Scope of Impact that lists the successful and failed connection attempts. You can use the drop-down list on the right to check whether the client is failing on one WLAN/AP or multiple WLANs/APs.
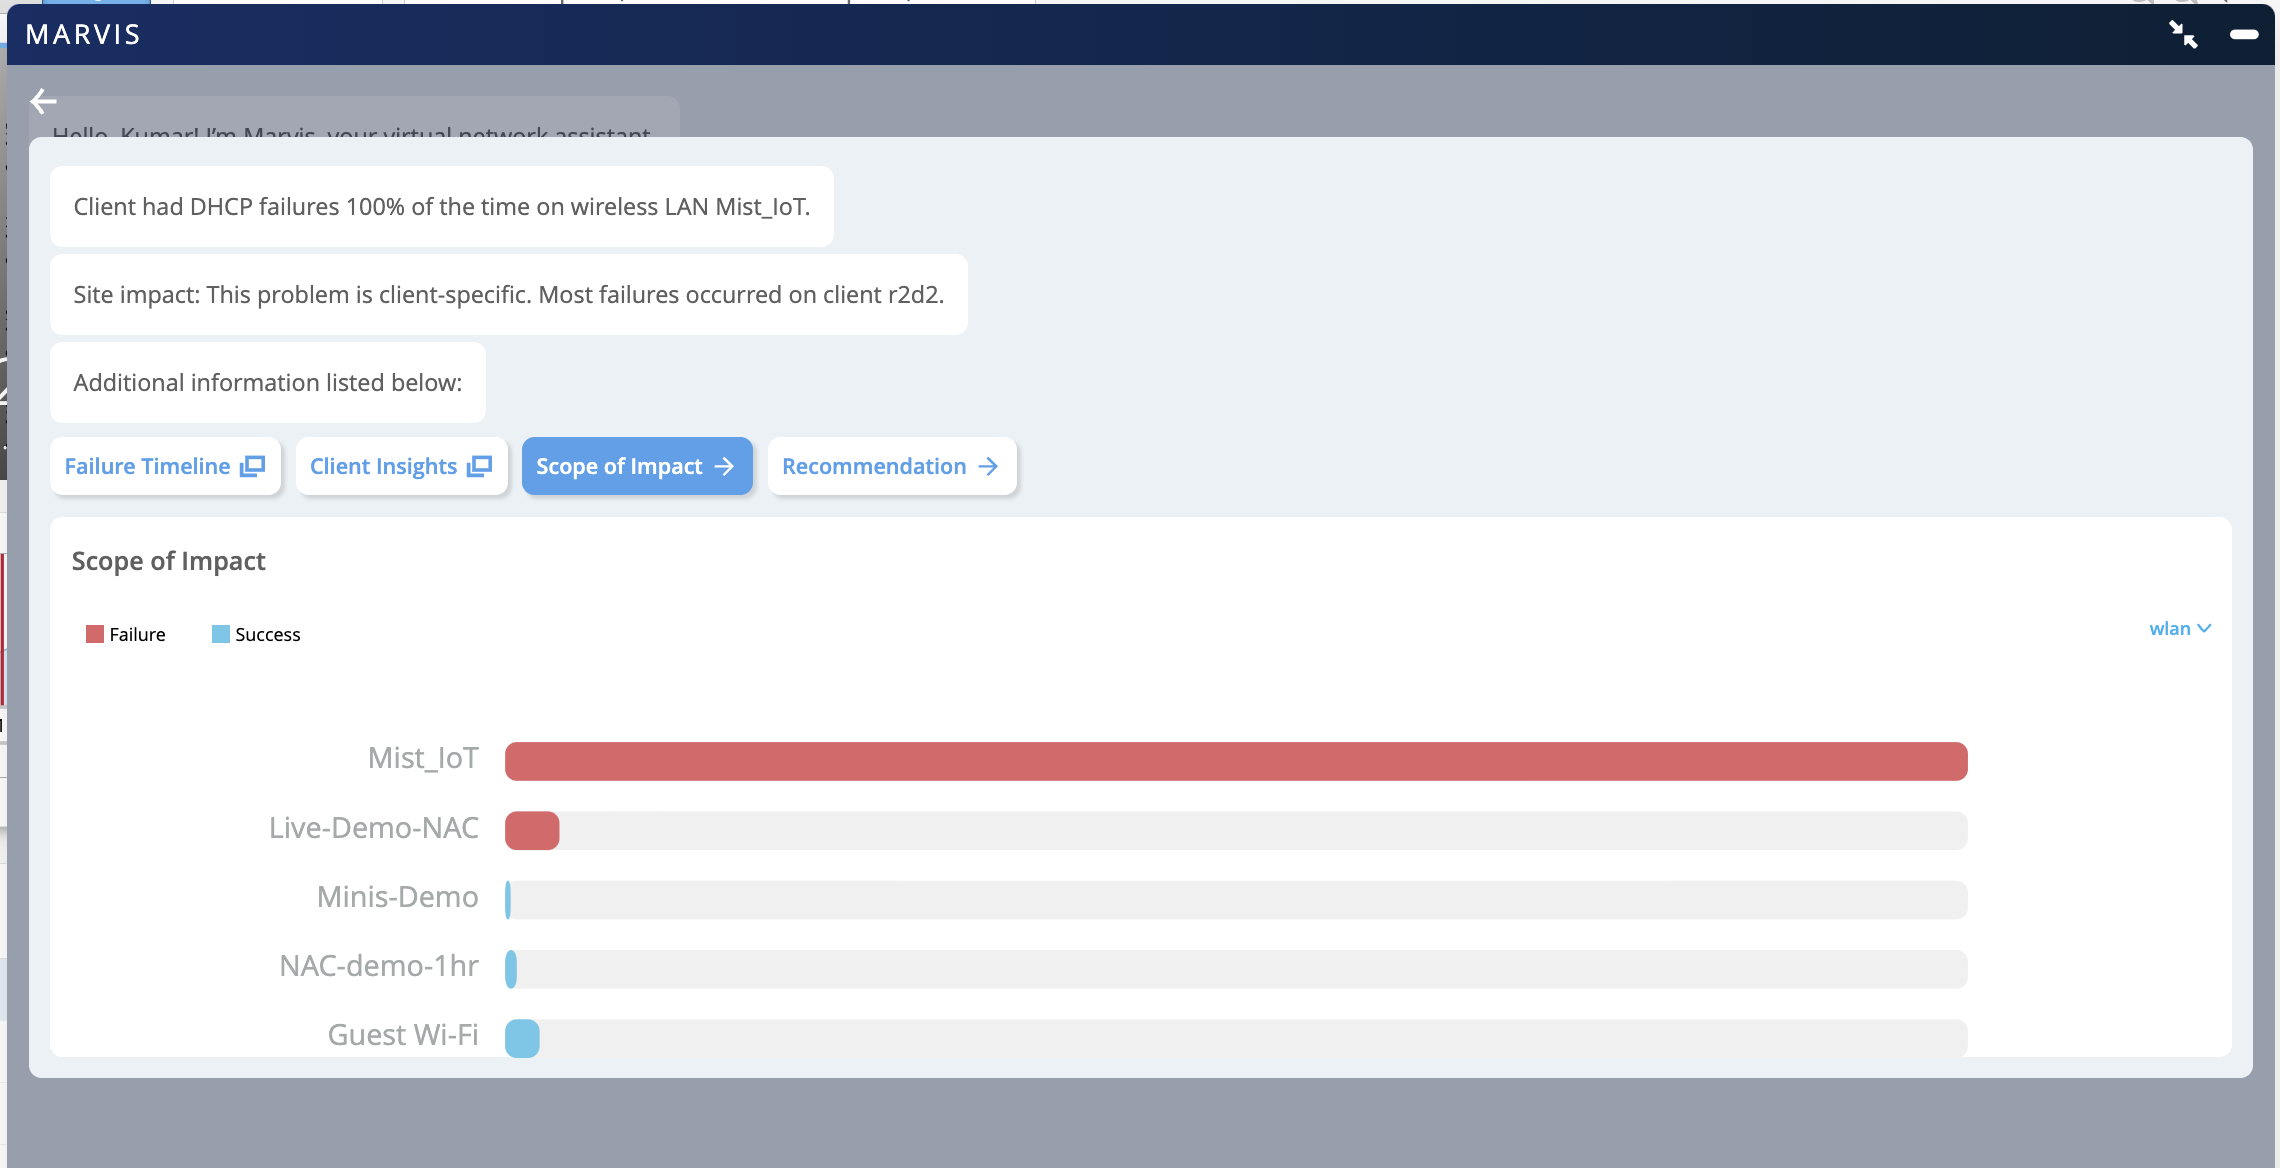
Network troubleshooting interface showing diagnostic details of DHCP failures on Mist_IoT wireless LAN. Tabs include Failure Timeline, Client Insights, Scope of Impact, and Recommendation. Scope of Impact bar chart highlights total failure on Mist_IoT network and partial successes on other networks like Live-Demo-NAC and Guest Wi-Fi.

Client Insights

You can also click Client Insights to view all the client-related events. You can click the DHCP Timed Out event to view the details of the DHCP server where the DHCP requests are failing.
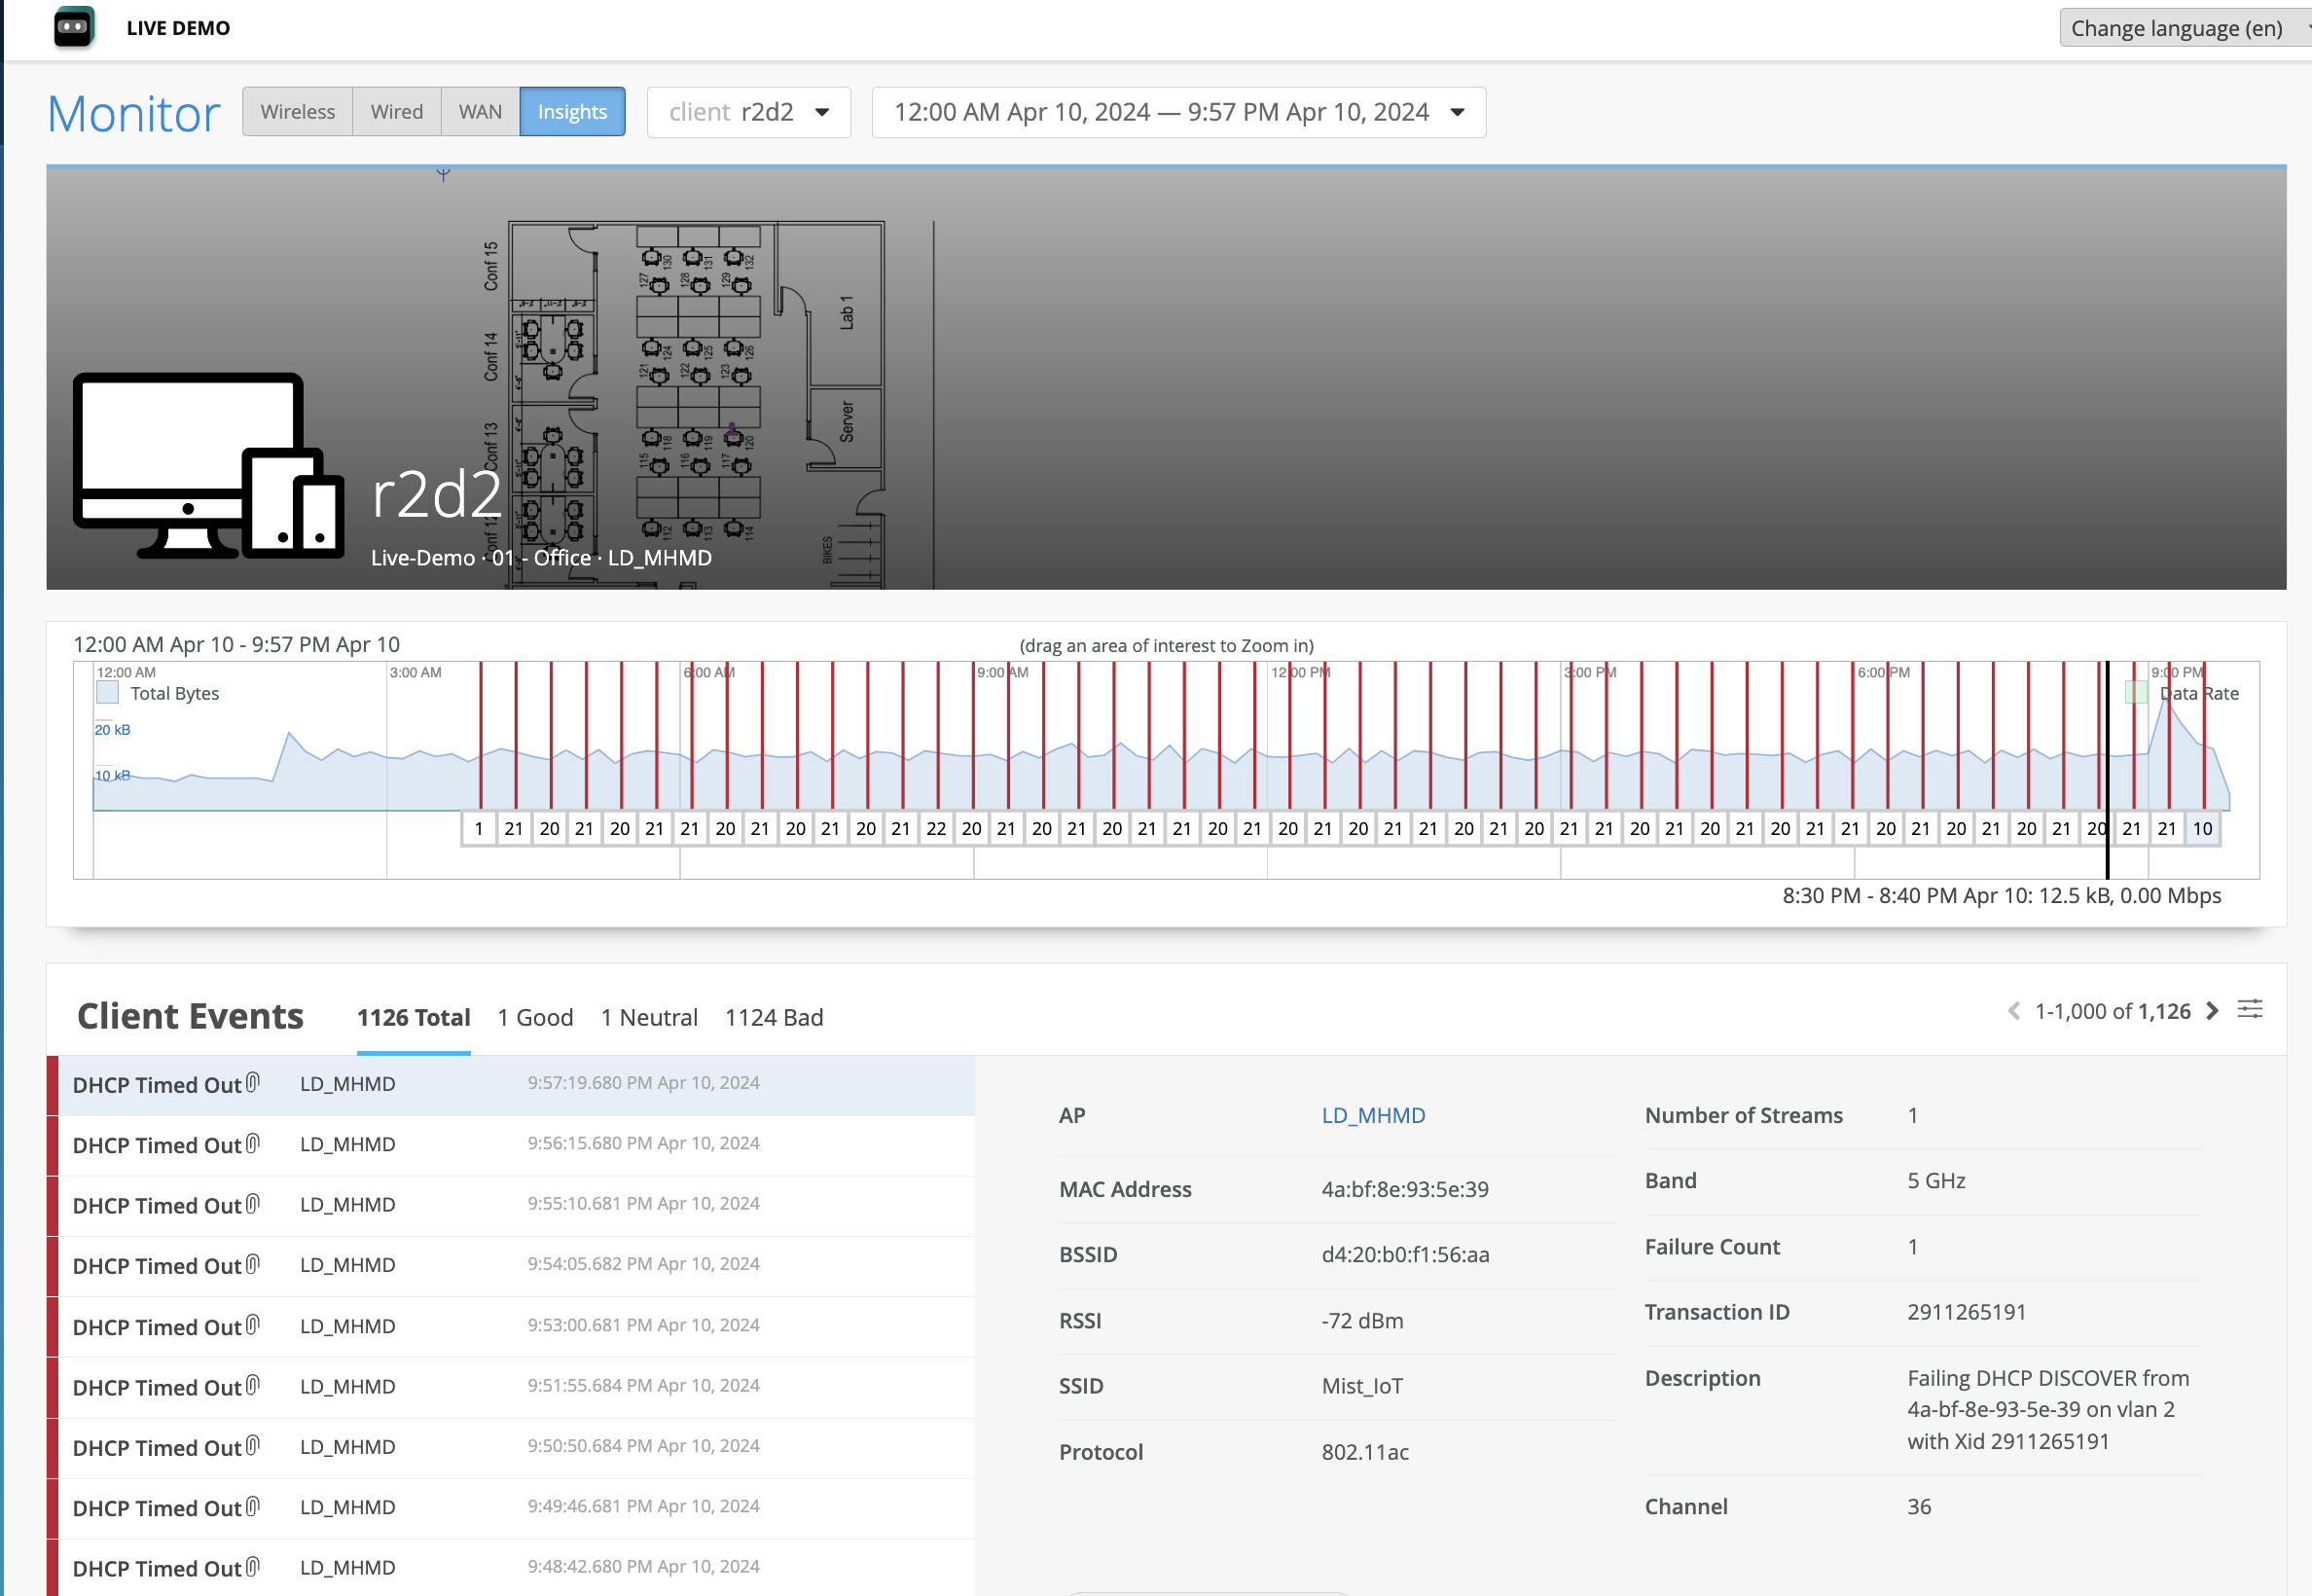
Network monitoring dashboard showing device r2d2 data usage graph, DHCP timed-out events, and technical details like MAC address, RSSI, and SSID.

You can download the dynamic packet capture for a specific event. Here's a sample packet capture for a client that experienced a DHCP Timed Out event.
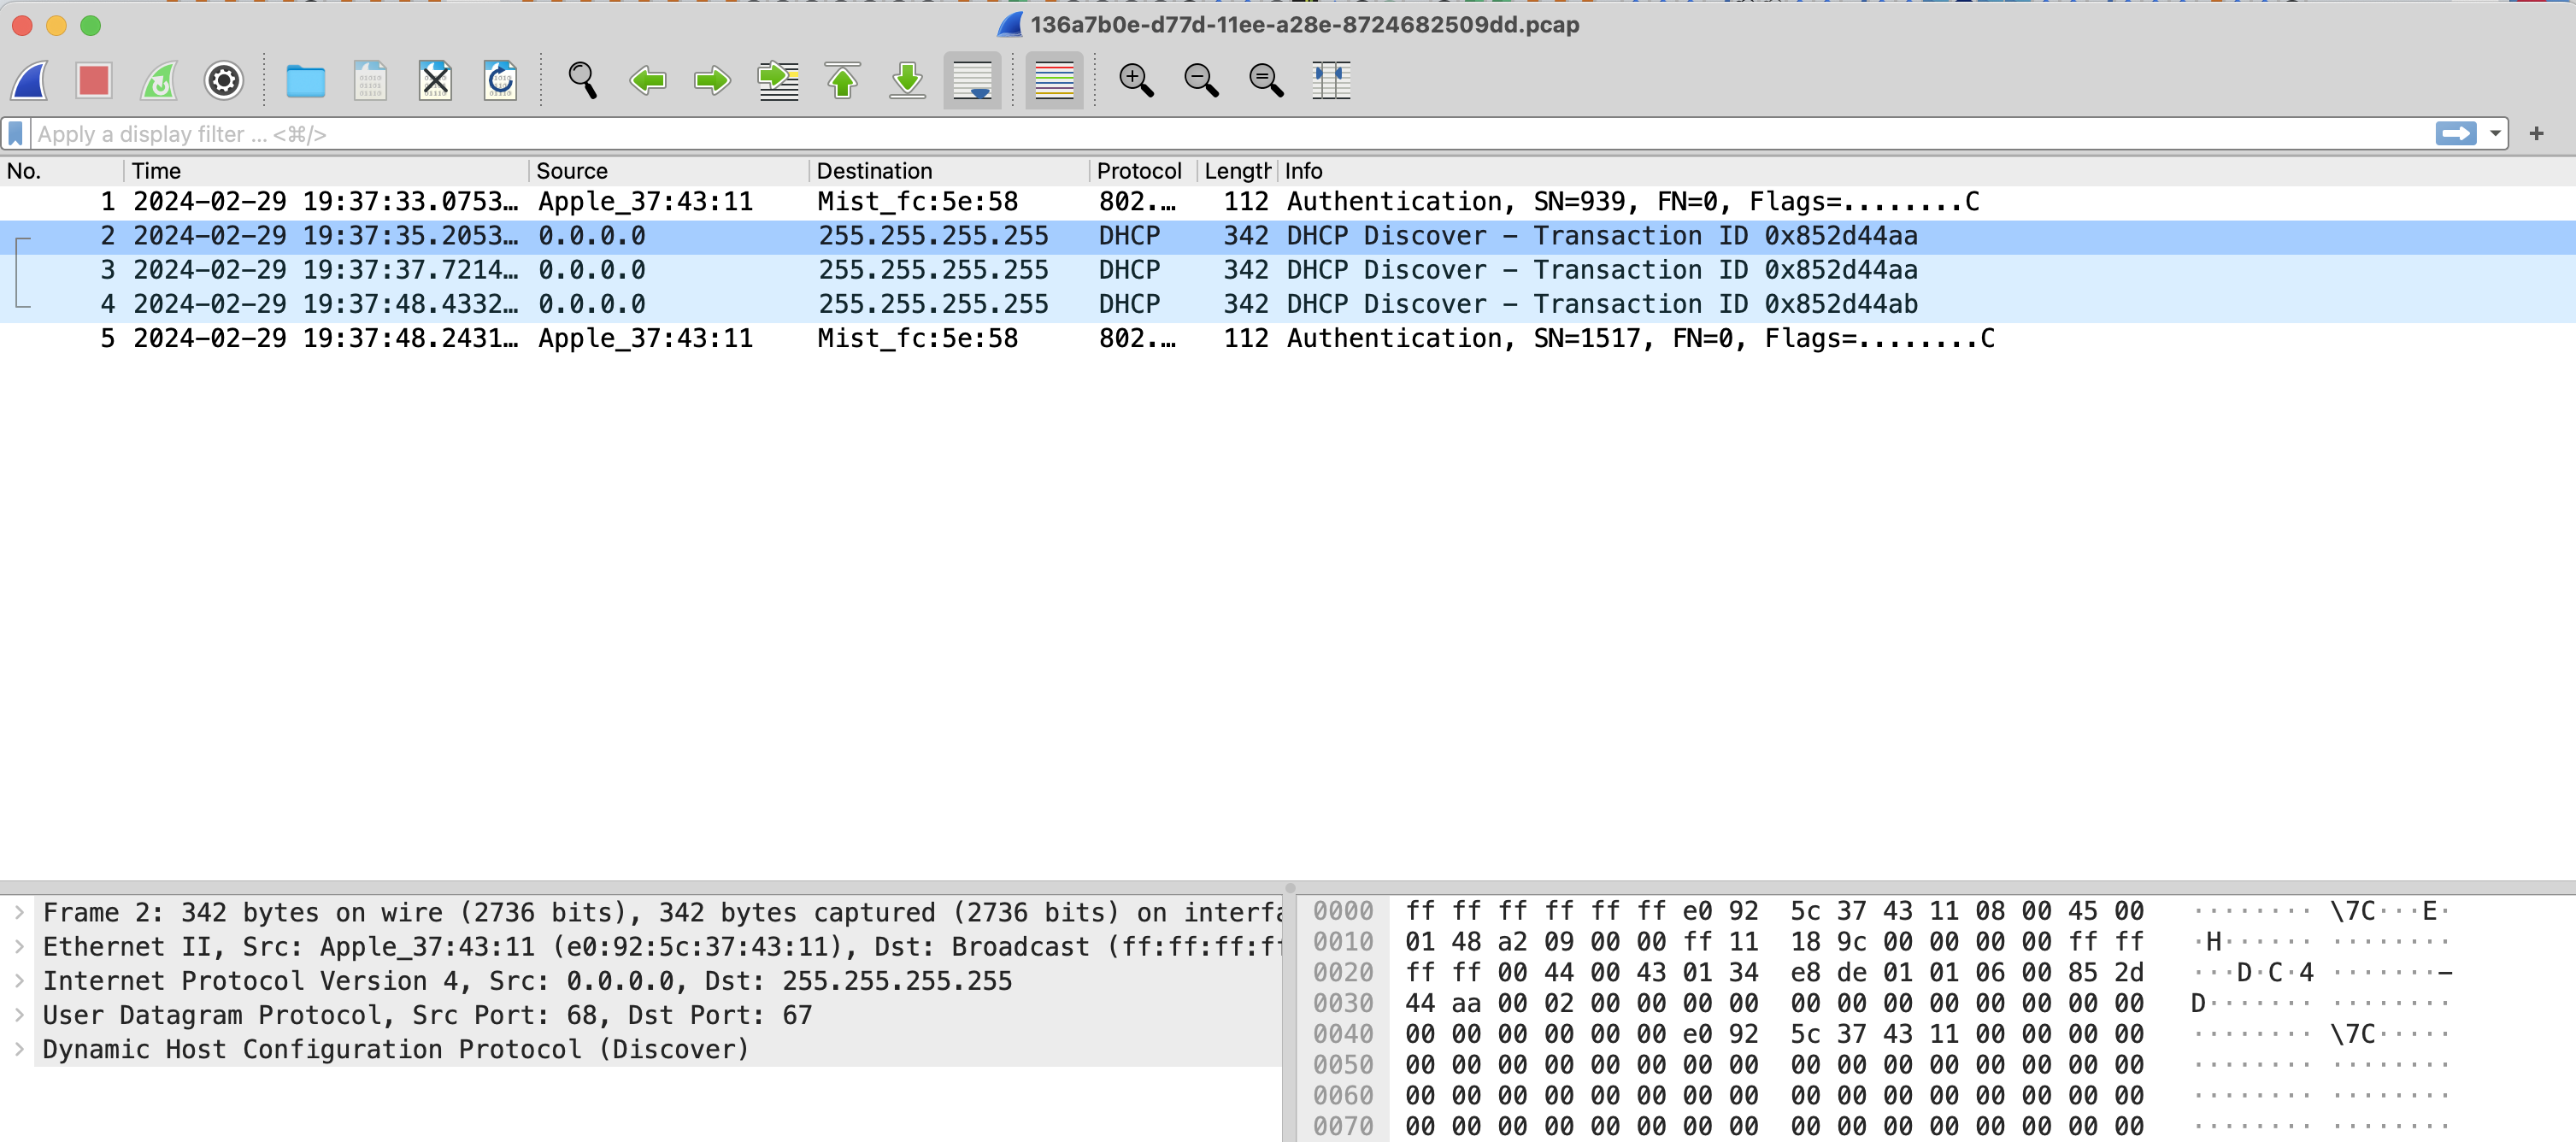
Screenshot of a Wireshark network packet capture showing DHCP Discover packets with source 0.0.0.0 and destination 255.255.255.255, detailed protocol layers, and raw packet data.

Troubleshoot PSK Failures

Marvis detects preshared key (PSK) failures when a large number of clients fail to authenticate to a PSK WLAN. A probable cause for this issue could be a recent PSK change that was not communicated to users.

To troubleshoot PSK failures:

  1. In the Marvis conversational assistant window, enter tshoot followed by the MAC address or hostname of the client. In the following example, you’ll see that Marvis reports an authorization issue due to an incorrect wireless password.
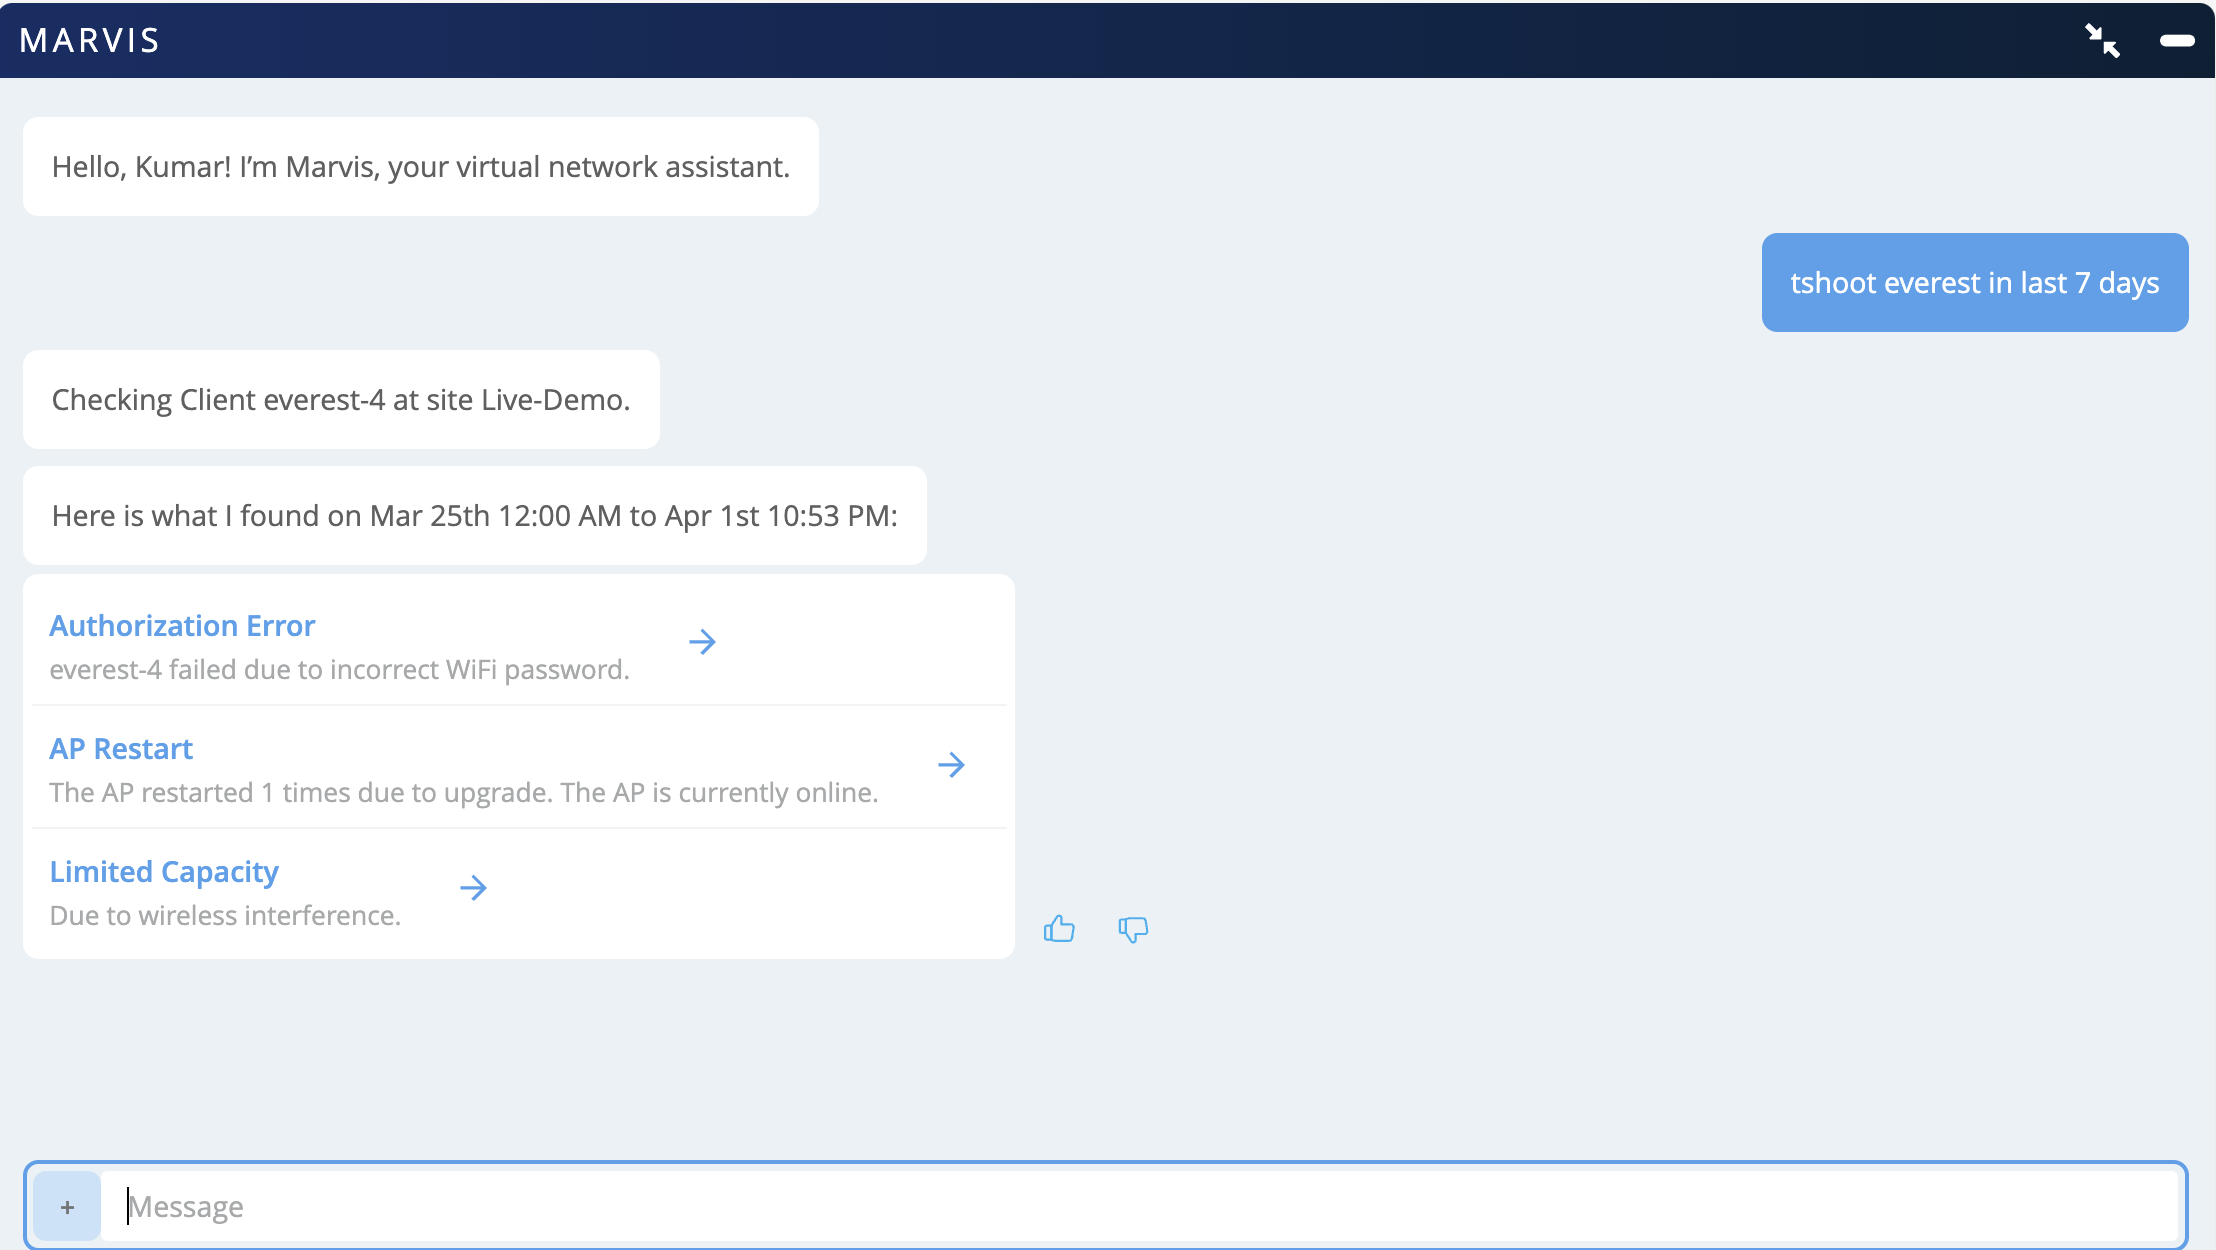
    Virtual network assistant Marvis responds to a query about troubleshooting client everest-4 over 7 days, listing findings: authorization error due to incorrect WiFi password, AP restarted once due to upgrade, and limited capacity from wireless interference, with links for more details and a text input box for interaction.

  2. Click Authorization Errors to view the details.
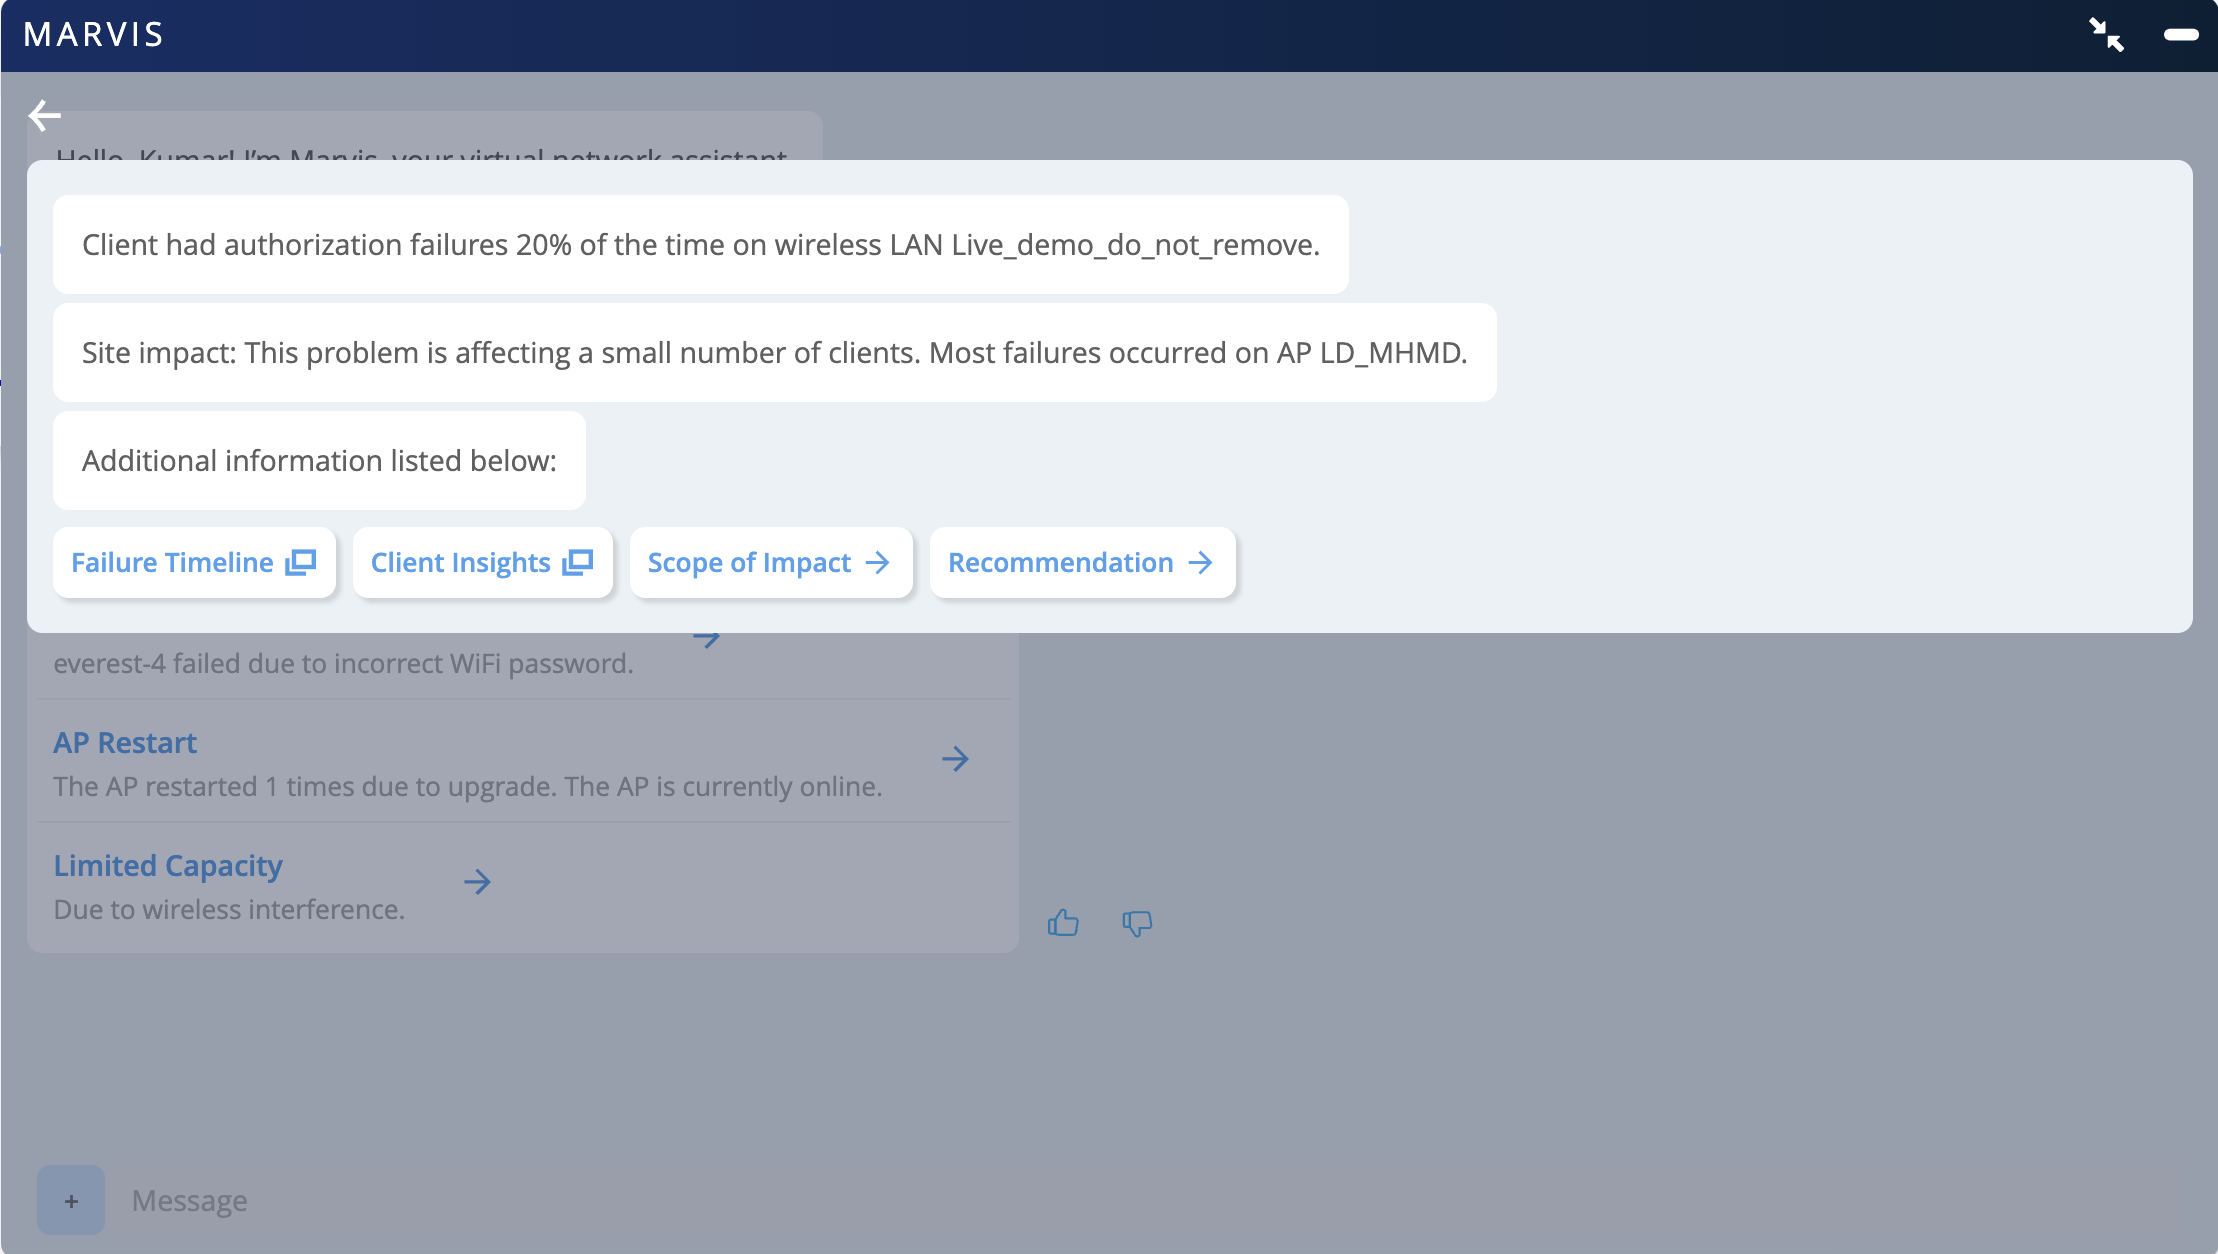
    Network troubleshooting interface from Marvis showing authorization failures 20 percent of the time on WLAN Live_demo_do_not_remove, mostly affecting AP LD_MHMD, with options for further details like Failure Timeline and Recommendation.

Investigate further by using the options displayed.

Scope of Impact

You can start by looking at the Scope of Impact that lists the successful and failed connection attempts. You can check whether the client is failing on one or multiple WLANs.
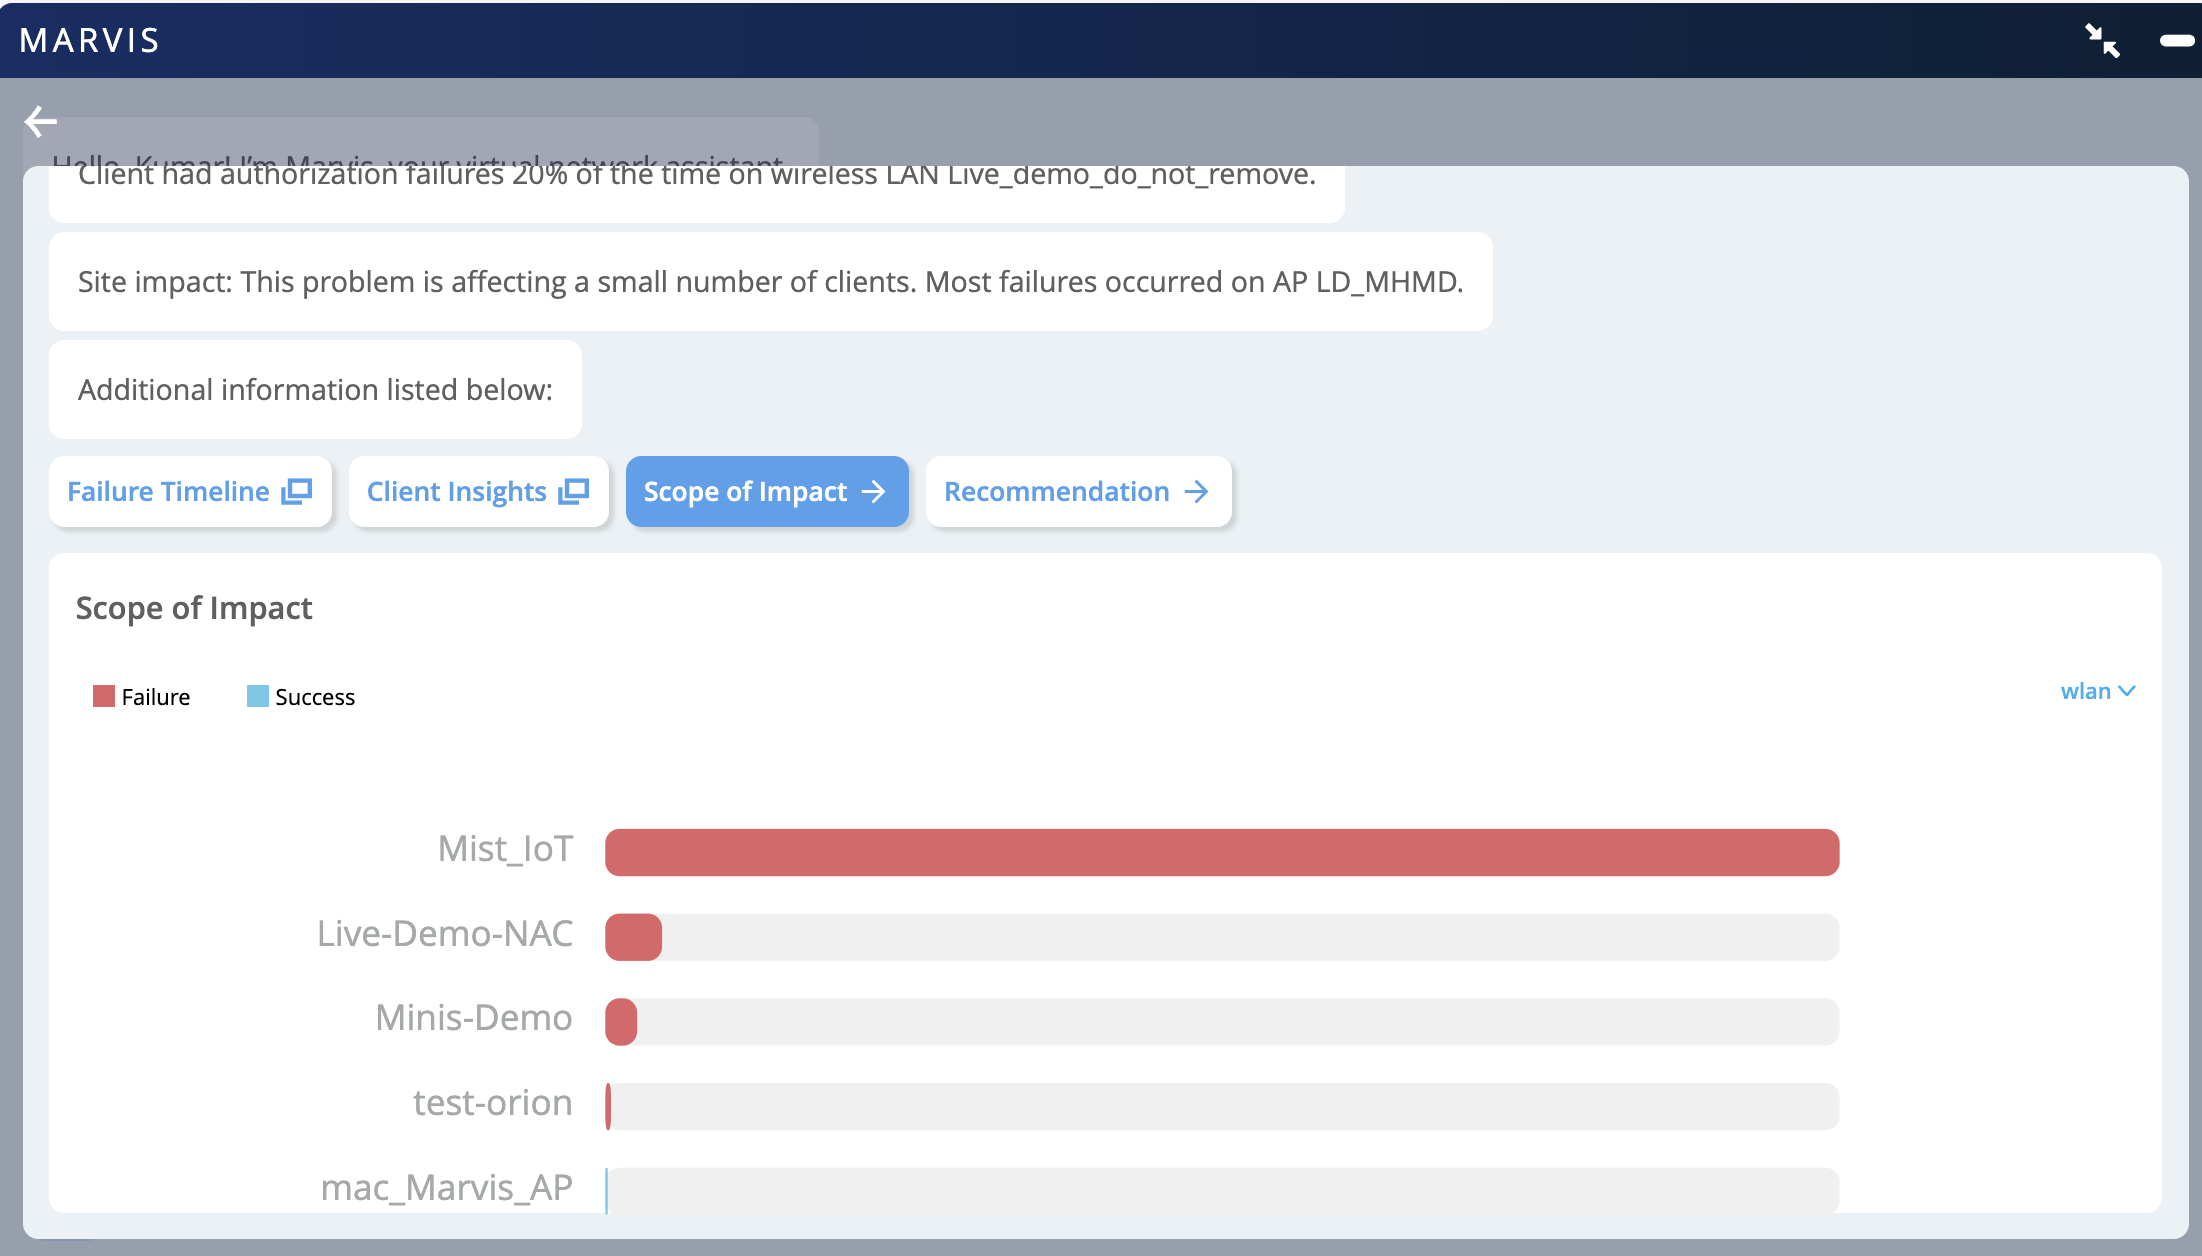
Screenshot of Marvis network analysis tool displaying Scope of Impact section with a bar graph showing WLAN failure and success rates, highlighting 20 percent client authorization failures on a specific WLAN.

Client Insights

You can click Client Insights to view all the events associated with the client. You can click the authorization failure event to see the reason for the failure as shown in the following example.
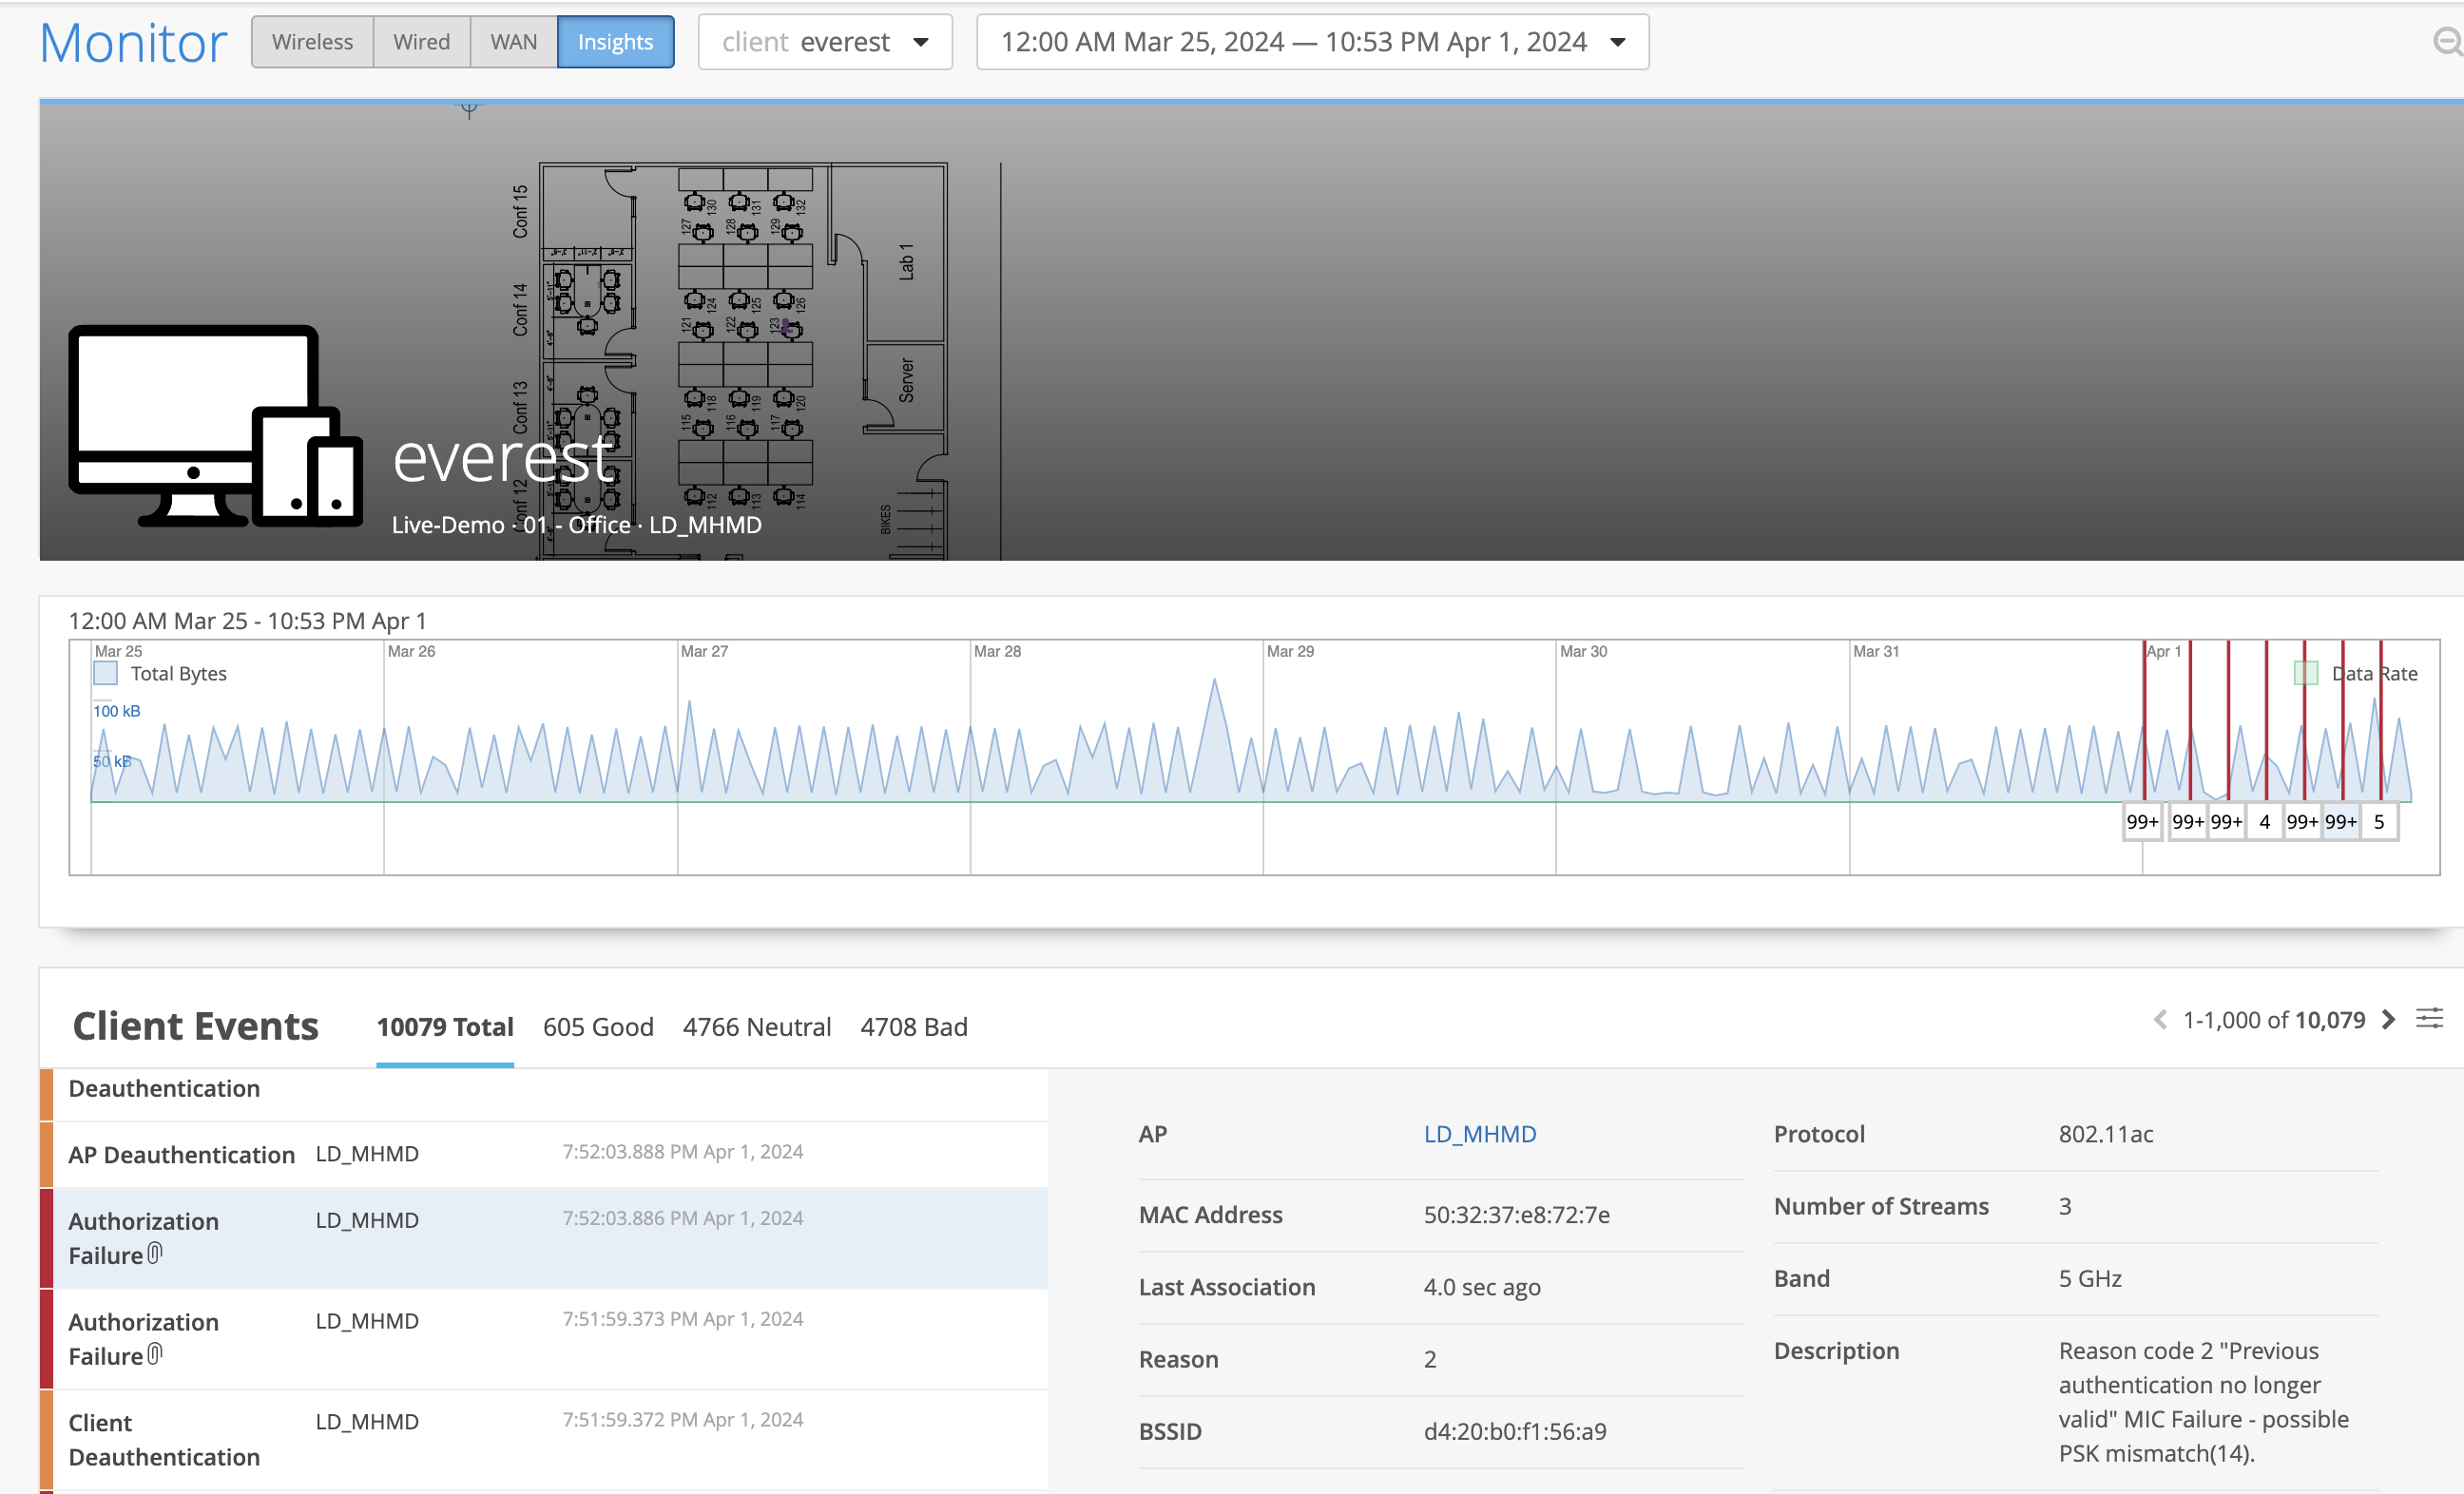
Network monitoring dashboard showing data for client everest from March 25 to April 1, 2024. Includes tabs, search bar, dropdown menus, a floor plan with labeled rooms, a line graph of total bytes over time with marked events, and a table listing 10079 client events categorized as good, neutral, or bad.

Troubleshoot RADIUS Authentication Failures

Clients might experience an 802.1x authentication failure when a RADIUS server is down or unreachable.

To troubleshoot RADIUS authentication failures:

  1. In the Marvis conversational assistant window, enter tshoot followed by the name of the client. In the following example, you’ll see that Marvis detects 802.1x authentication failures in the network.
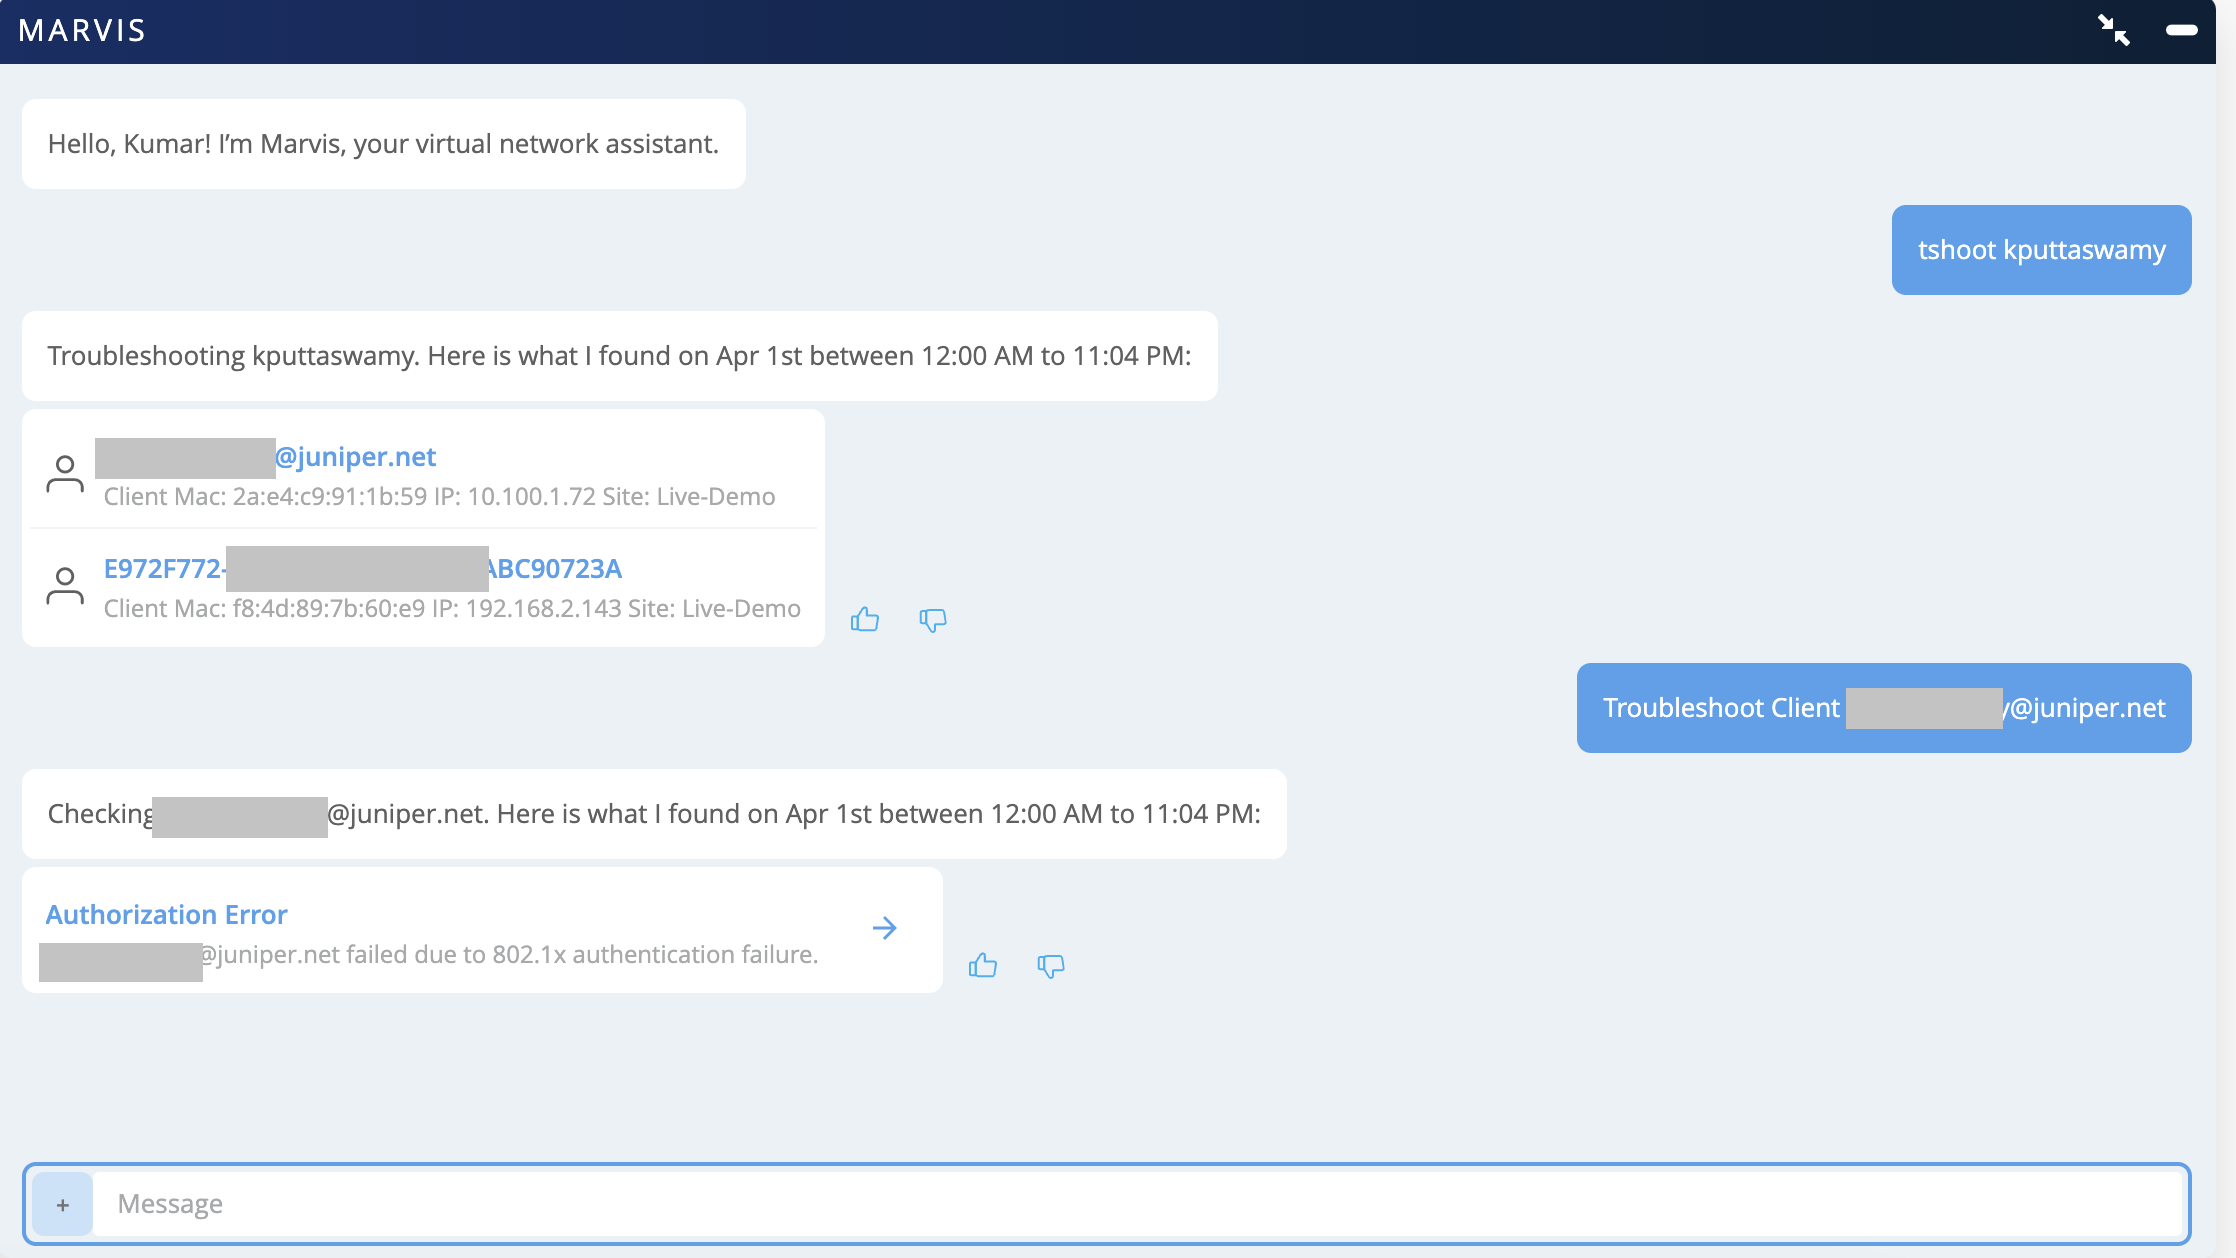
    Screenshot of a chat with Marvis troubleshooting a client device. Includes user input, client details like MAC and IP addresses, site info Live-Demo, and an error message for 802.1x authentication failure. Features user feedback options and a text input field.

  2. Click Authentication Error to view the details.
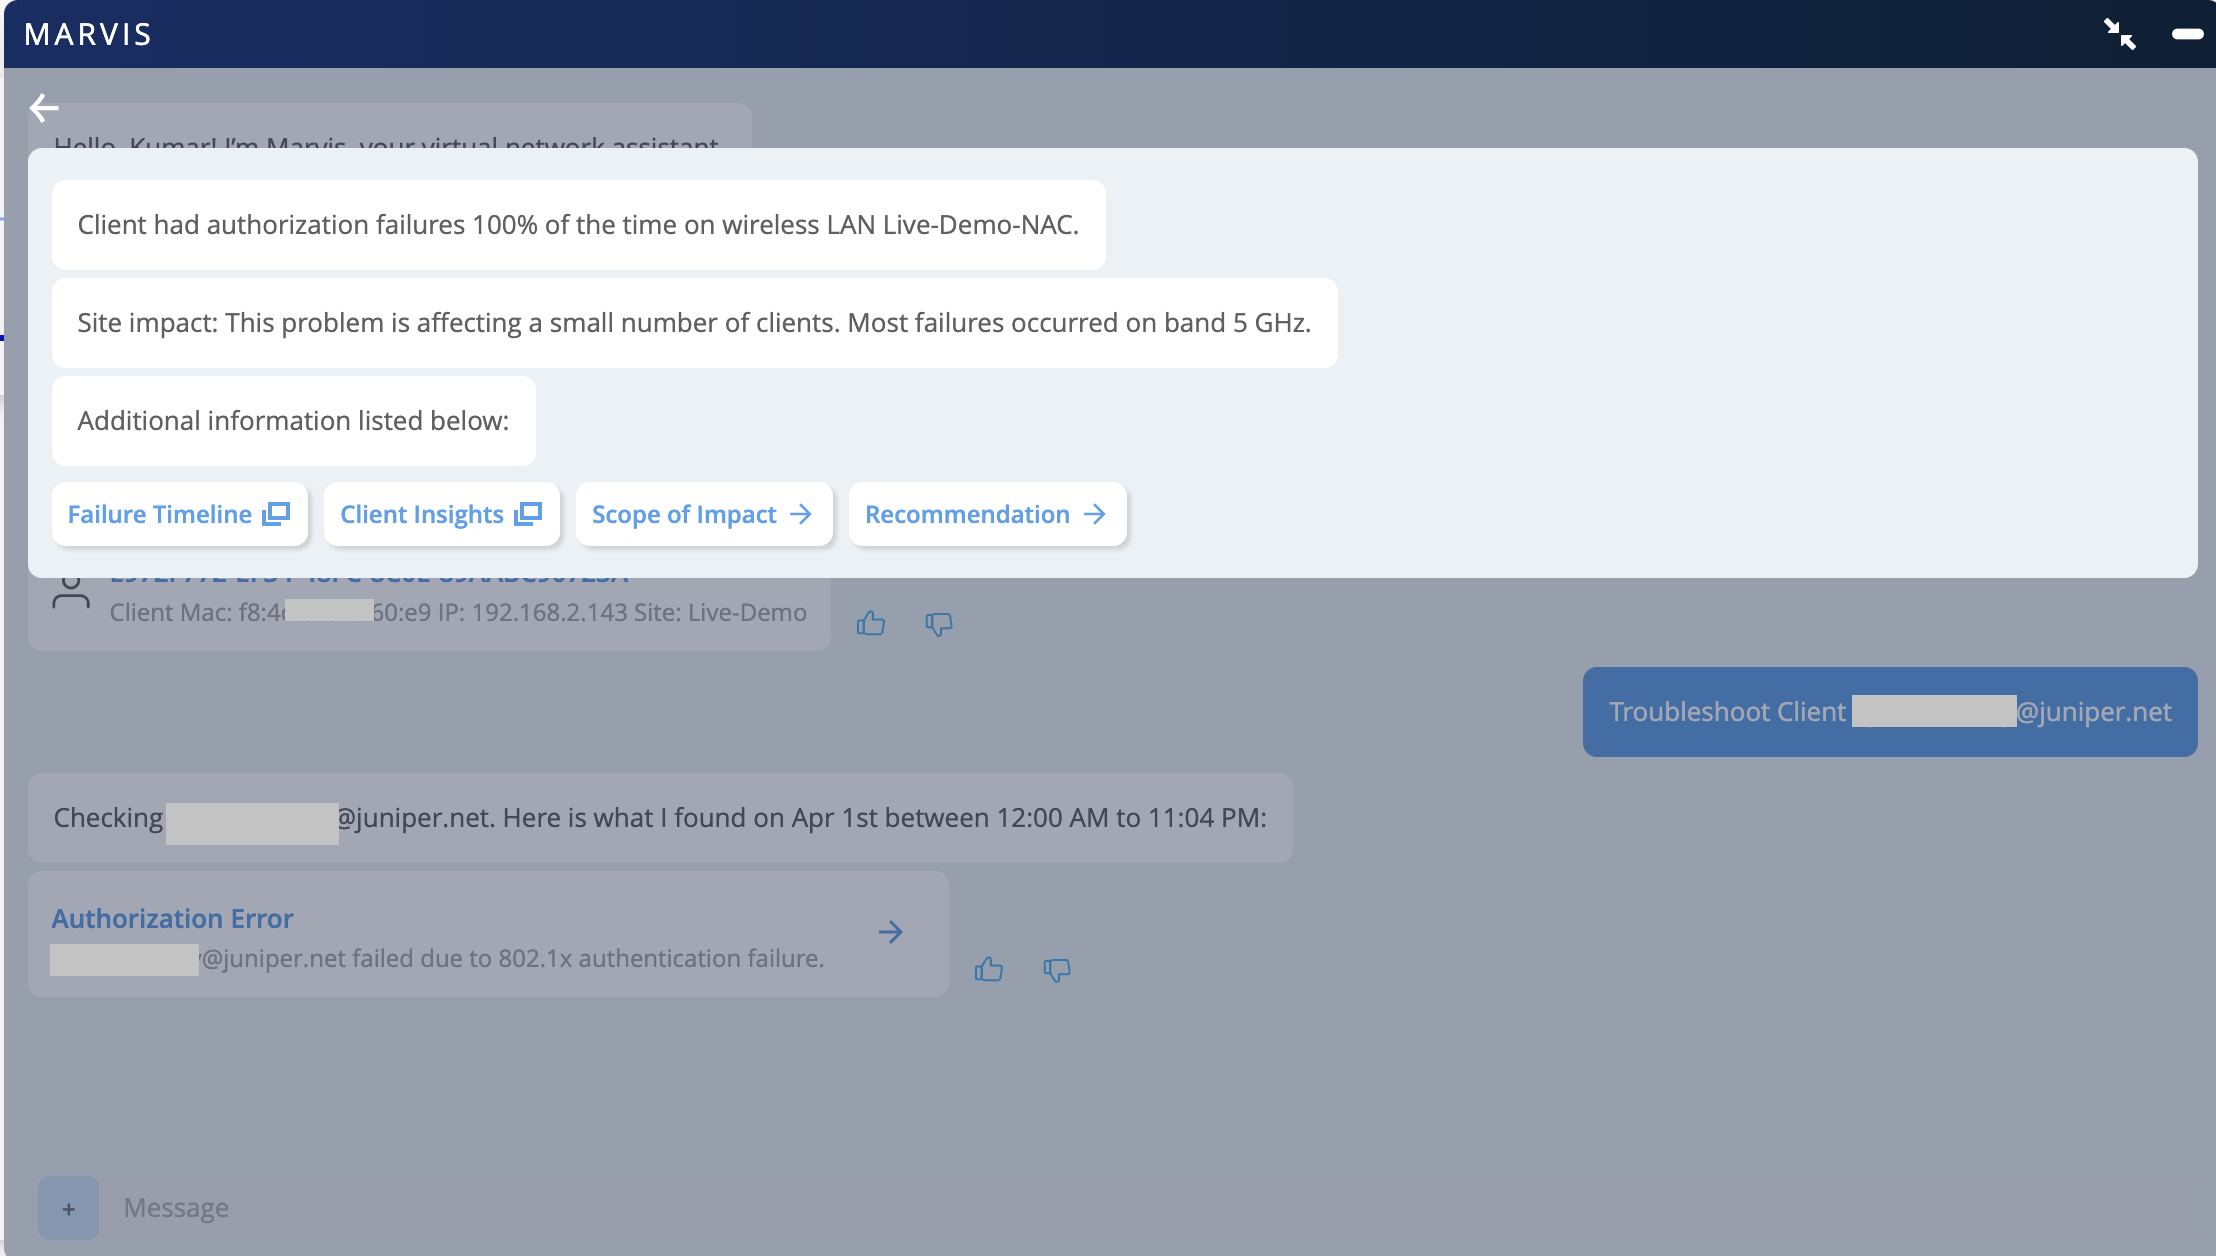
    Network troubleshooting interface showing 100 percent authorization failures for a client on the wireless LAN Live-Demo-NAC with links to failure timeline, client insights, scope of impact, recommendation, and troubleshoot client button.

You can investigate further by using the options displayed.

Scope of Impact

You can start by looking at the Scope of Impact that lists the successful and failed connection attempts. You can check whether the client is failing on one or multiple WLANs.
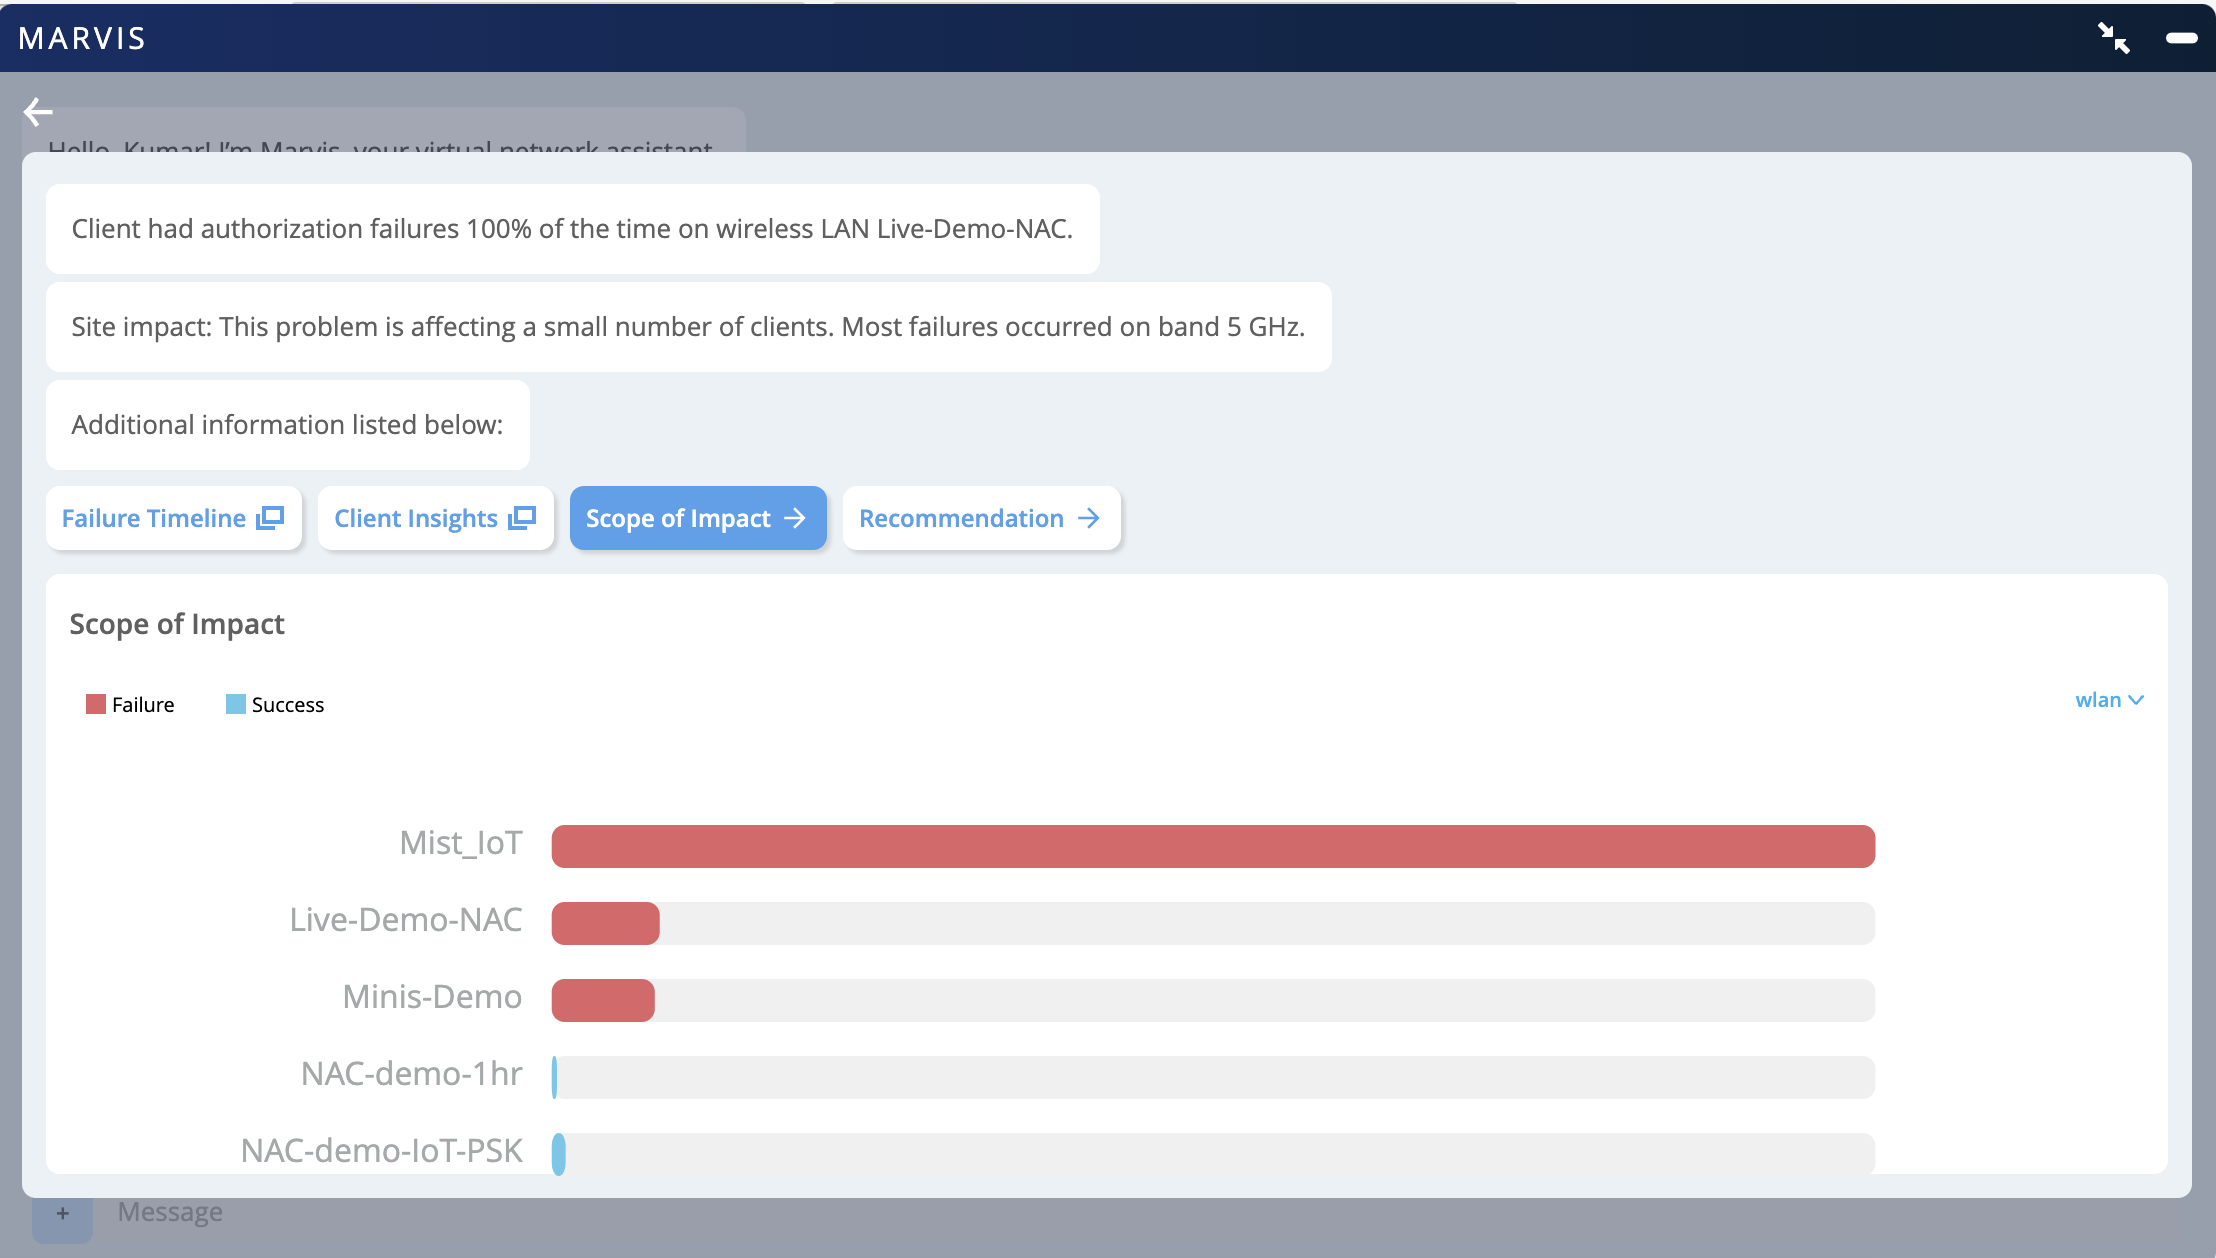
Network troubleshooting interface showing 100 percent authorization failures on wireless LAN Live-Demo-NAC, primarily on 5 GHz band. Scope of Impact tab displays a bar chart comparing success and failure rates across networks, with Mist_IoT and Live-Demo-NAC having highest failure rates.

Client Insights

You can click Client Insights to view all the events associated with the client. You can click the authorization failure event to see the reason for the failure as shown in the following example.
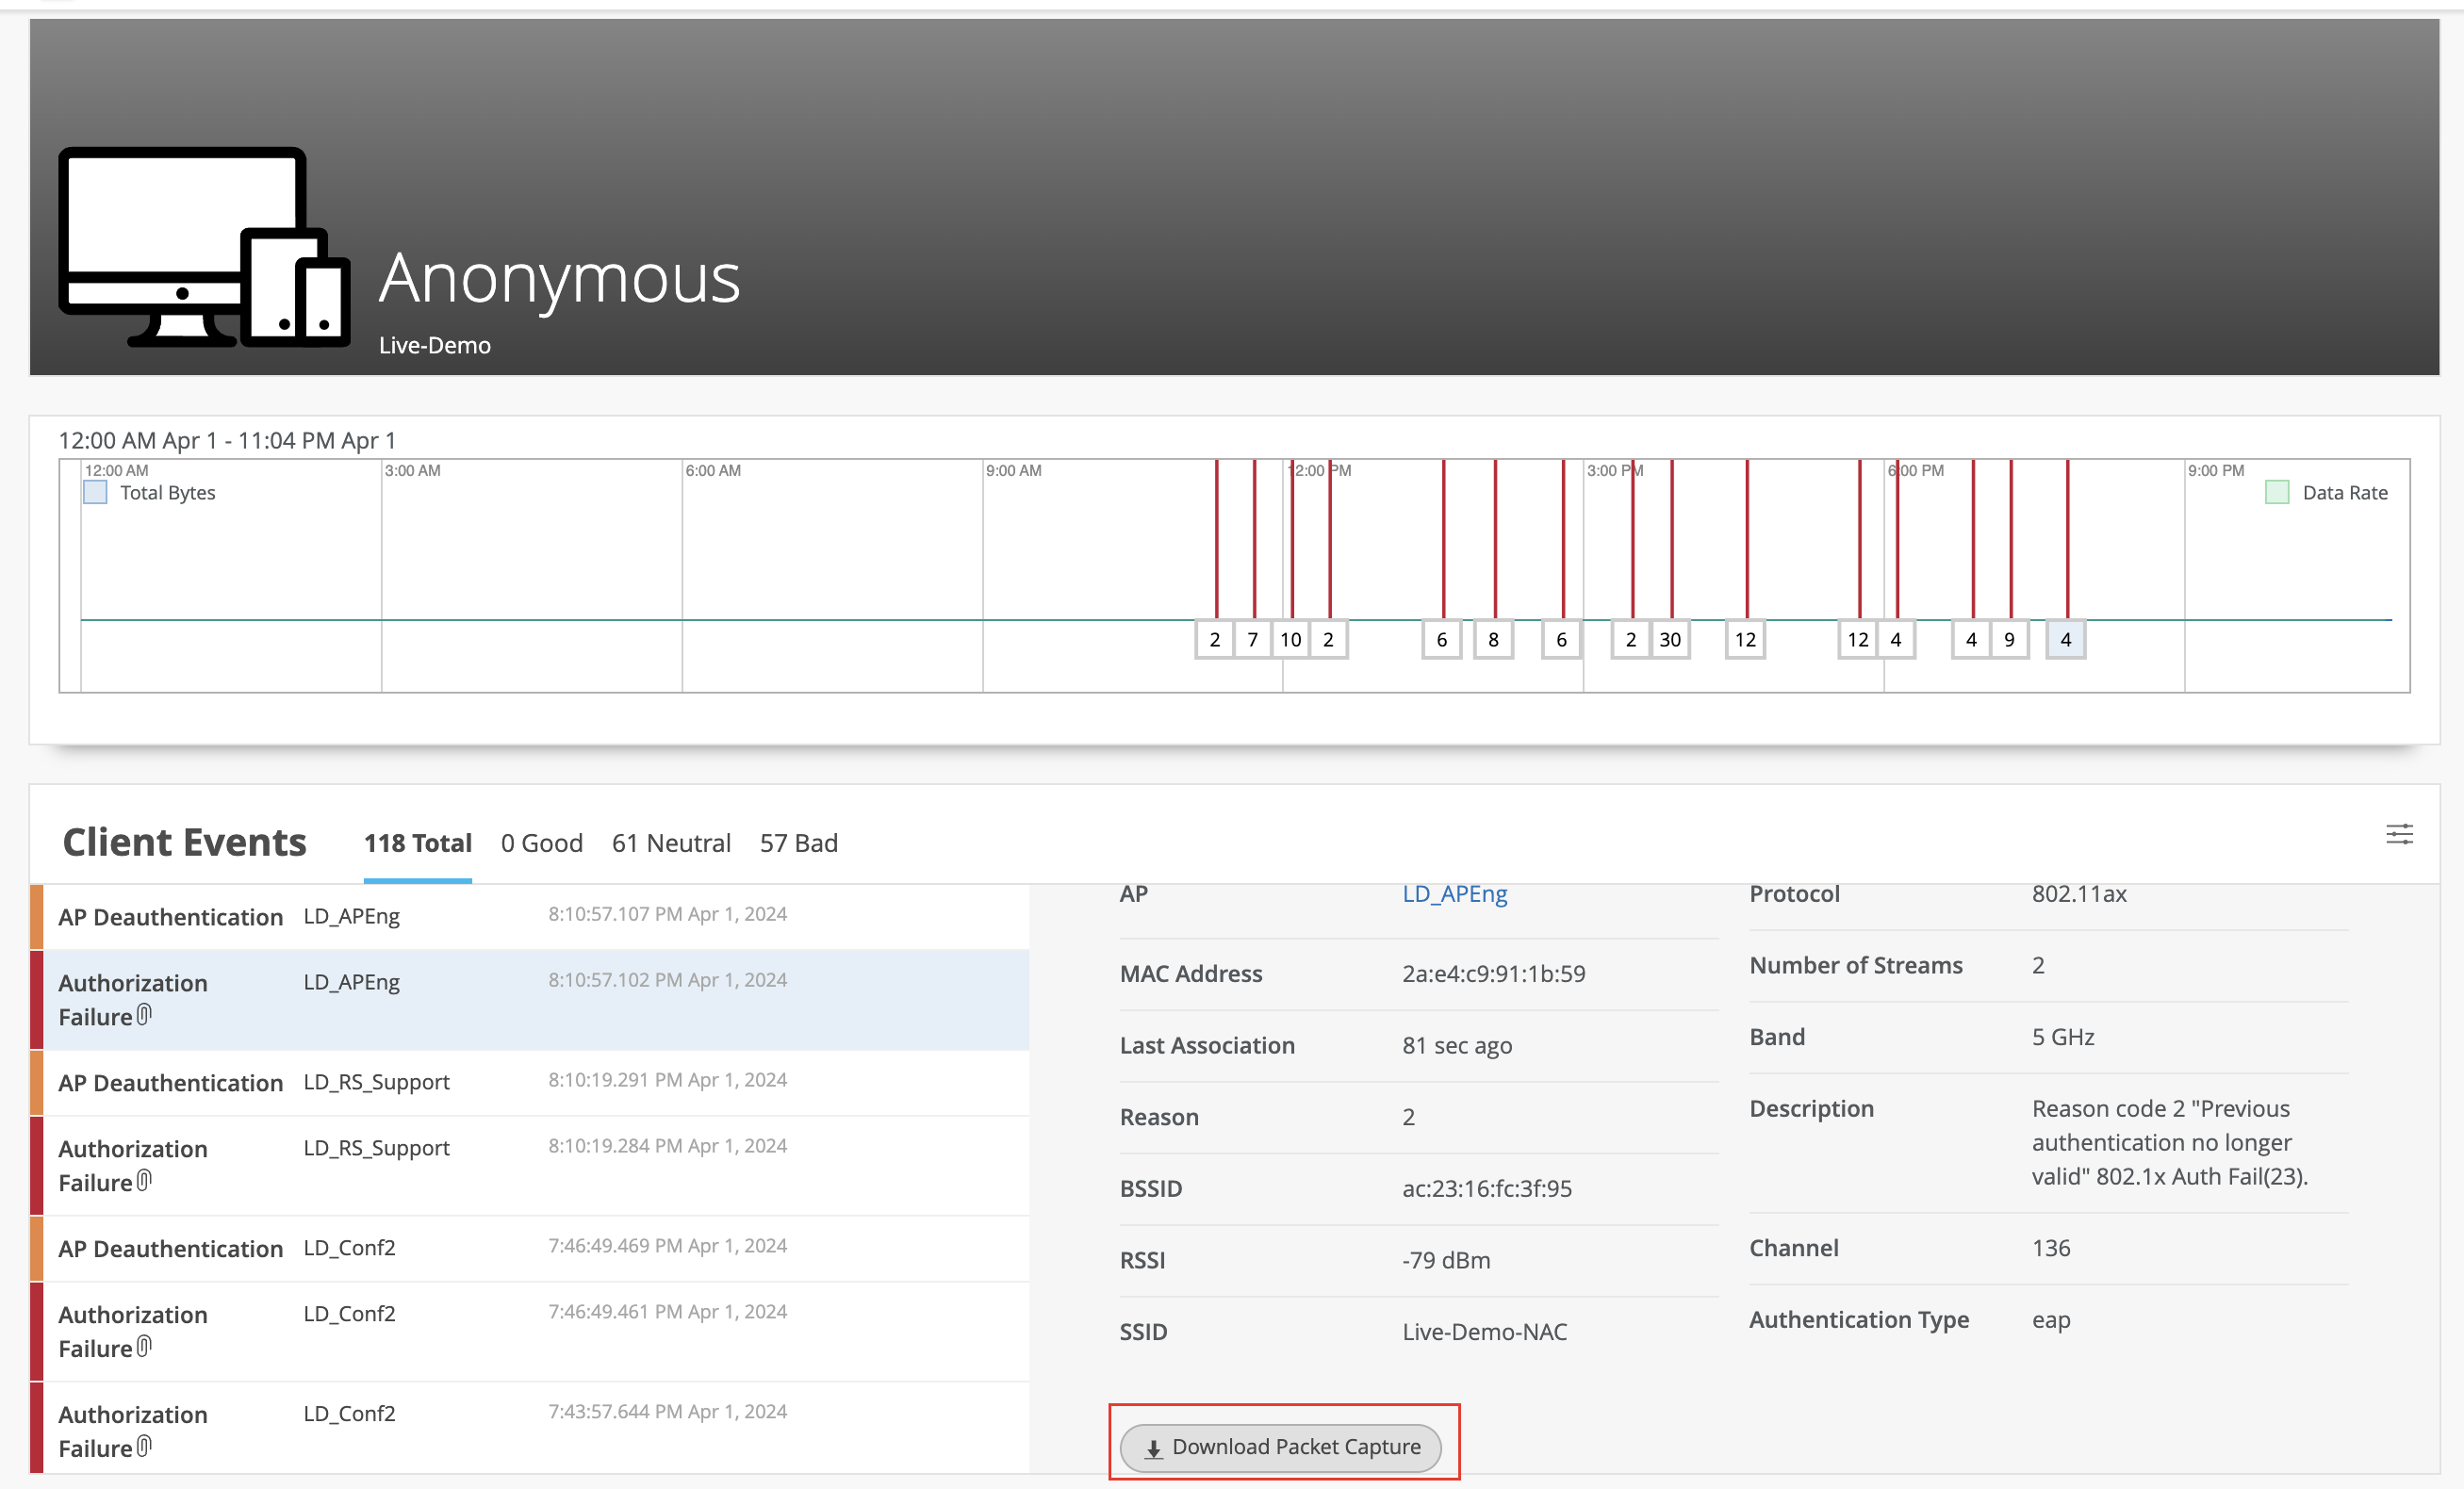
Network monitoring dashboard with header showing Anonymous and Live-Demo, timeline graph of network activity with red event markers, list of client events like AP Deauthentication and Authorization Failure, detailed event info including AP name, MAC address, protocol, RSSI, SSID, issue description, and Download Packet Capture button for troubleshooting.

You can download the dynamic packet capture for a specific event. Here's a sample packet capture:
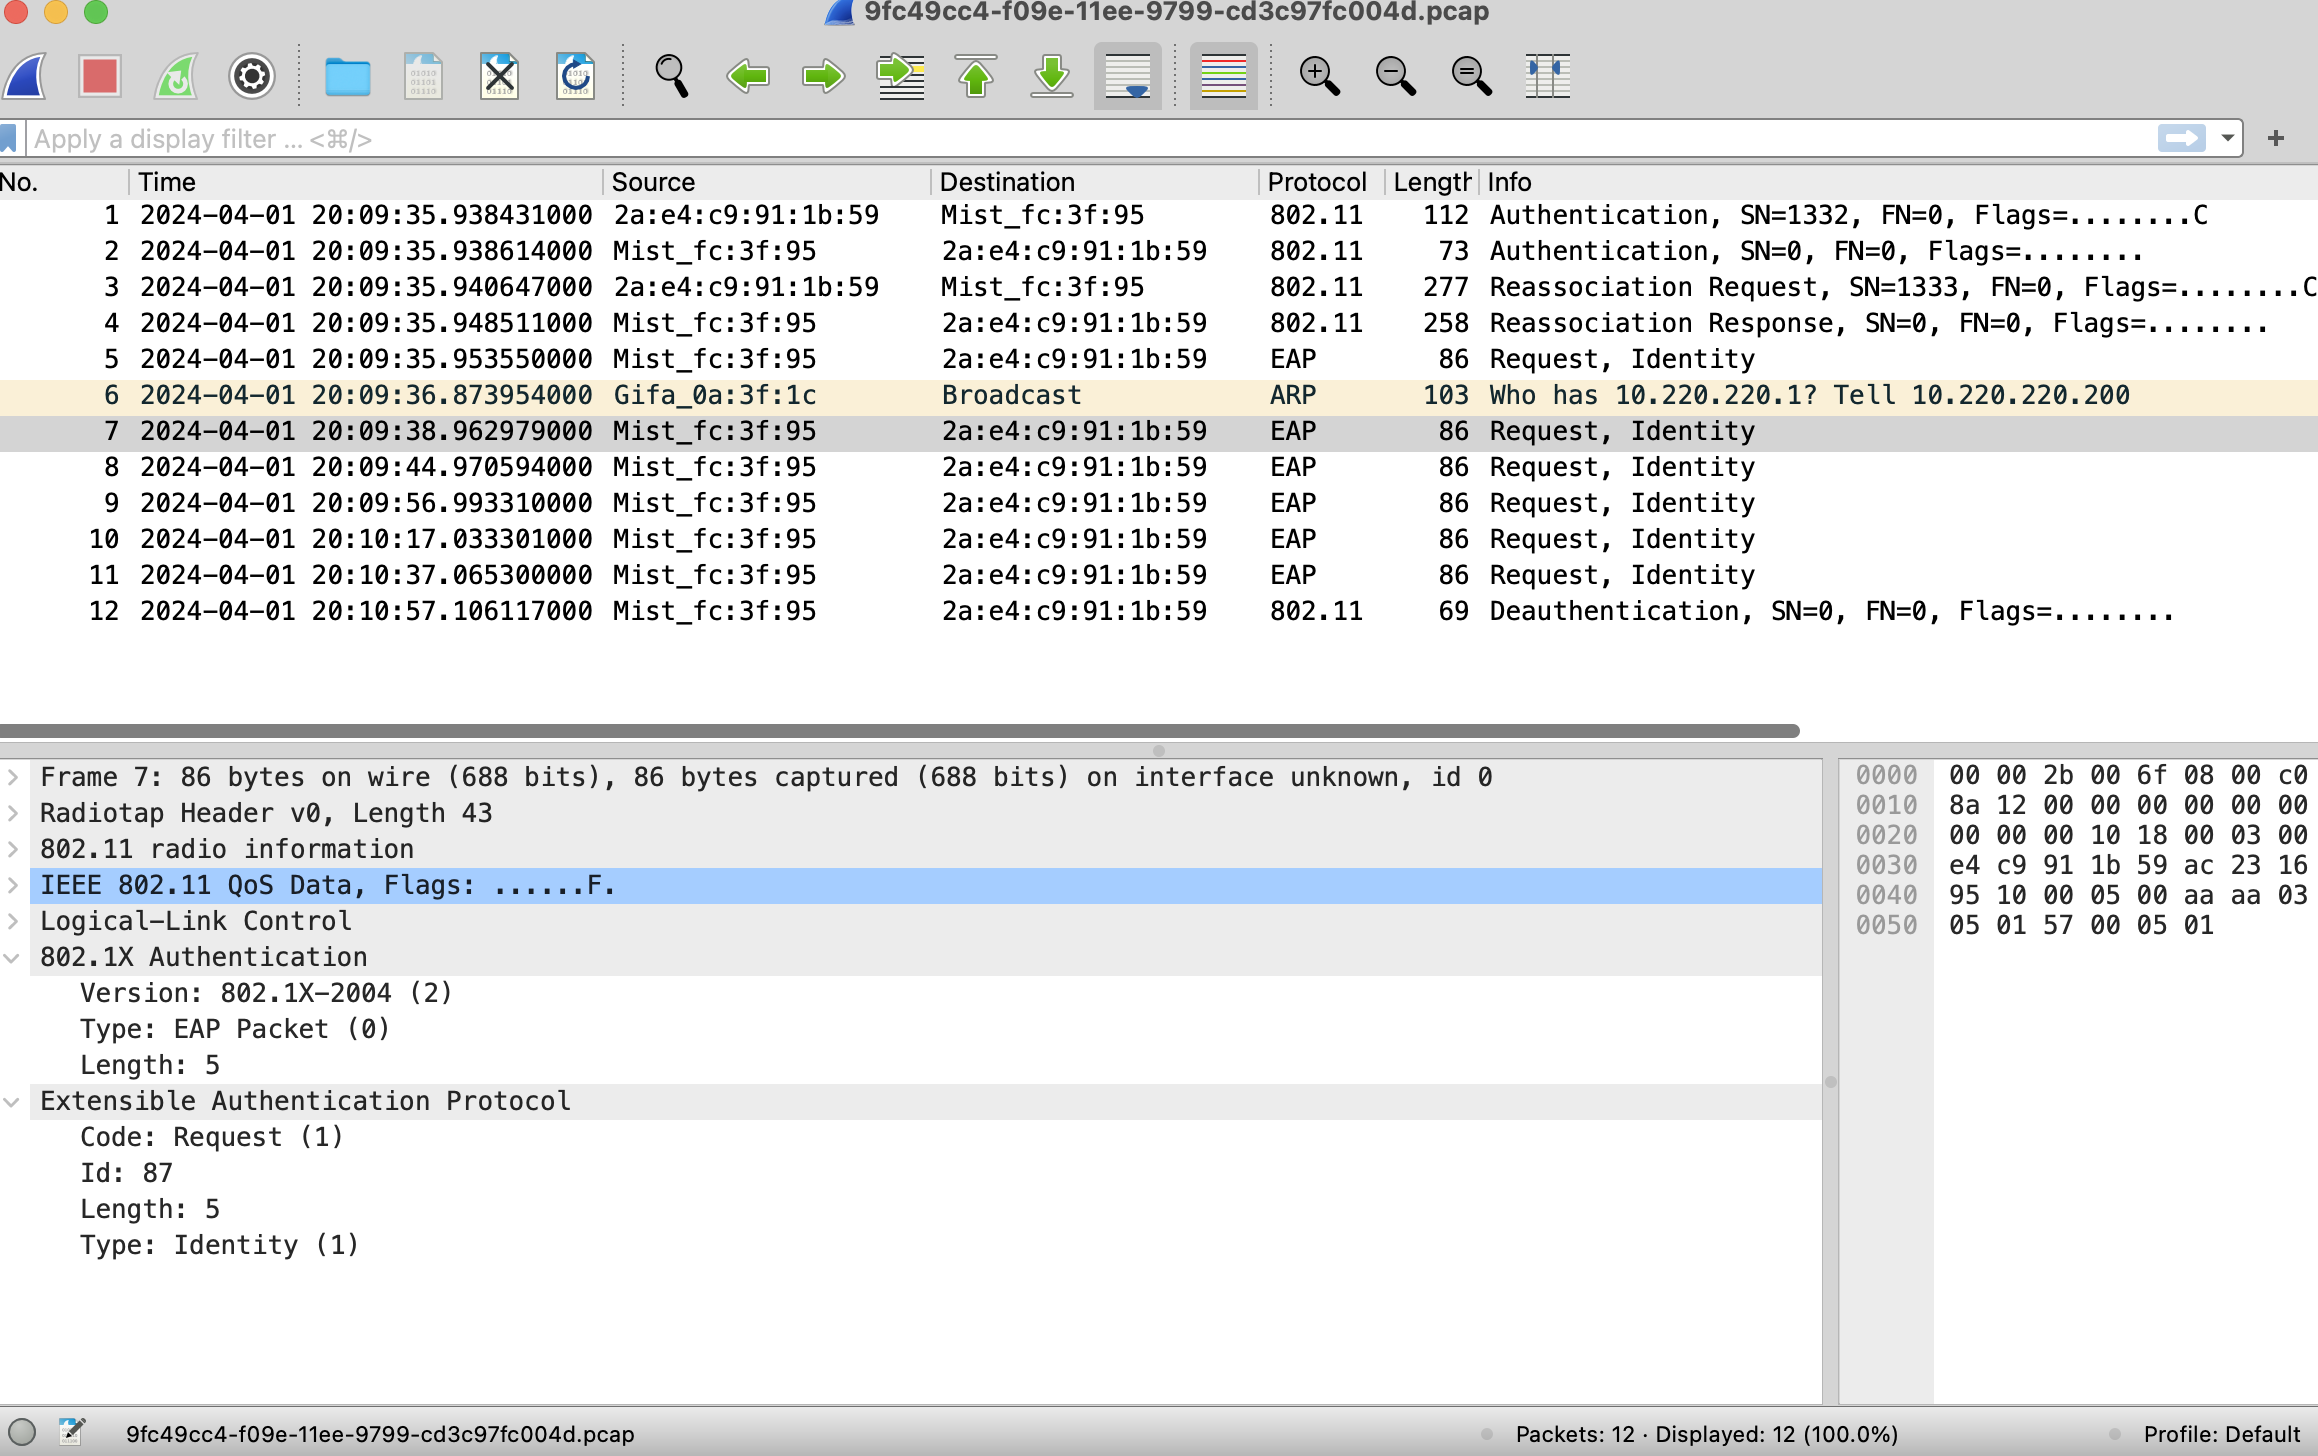
Screenshot of Wireshark showing captured network packets with columns for time, source, destination, protocol, length, and info. Highlighted packet is an EAP request with detailed protocol layers and hexadecimal data in the lower pane. Used for network troubleshooting and analysis.