Troubleshoot Using Marvis Query Language
Use these examples to see how you can use Marvis queries to monitor and troubleshoot your network.
View Event and Device Details
To troubleshoot problems and understand network behavior, you might need to look at event details or device details. You can use the LIST query to view details for the following:
-
Access points (APs)
-
Clients (including wired clients)
-
Switches
-
AP events
-
Client events
-
Switch events
-
Mist Edges
-
Mist Edge events
Table 1 and Table 2 provide a few LIST queries that you can use as a reference to build queries based on your requirements.
| If you want to view | Use |
|---|---|
| Client events for an AP during a specific time interval | LIST ClientEvents WITH AccessPoint <AP name> DURING <time duration> |
| All events for an AP | LIST ApEvents WITH AccessPoint <AP name> |
| Events of a specific type for an AP | LIST ApEvents WITH ApEventType <event-type> AND AccessPoint <ap-name> |
| All events for a switch | LIST SwitchEvents WITH Switch <switch name> |
| Events of a specific type for a switch | LIST SwitchEvents WITH SwitchEventType <event-type> AND Switch <switch-name> |
| All events for Mist Edges at a specific site | LIST MistEdgeEvents WITH Site <site-name> |
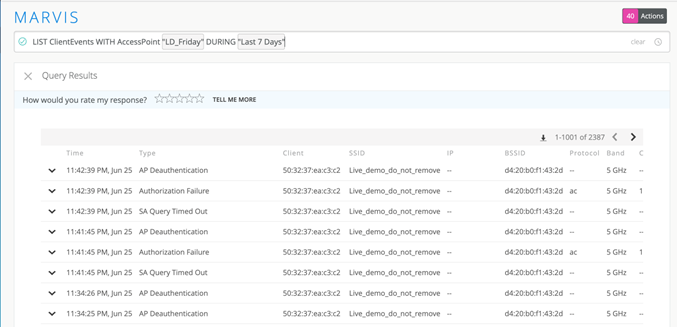
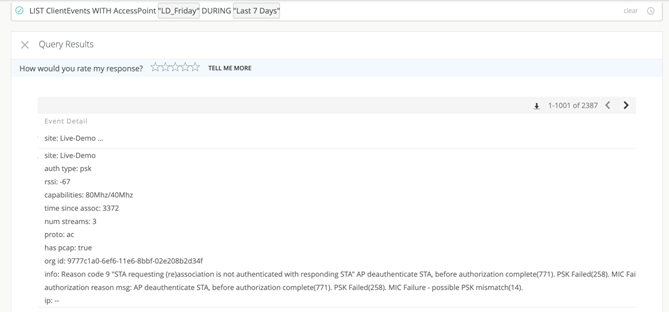
The following example shows the events for all clients associated with a particular AP. To view more details about an event, you can click the arrow in the first column of the table.
This example shows the list for a specific event type:
| If you want to view | Use |
|---|---|
| Switches of a particular model in a site | LIST Switches WITH Model <model number> AND Site <site name> |
| Clients connected to an AP | LIST Clients WITH AccessPoint <AP name> |
| APs of a specific model in a site | LIST APs WITH Model <model number> AND Site <site name> |
| All the wired clients in a site | LIST WiredClients WITH Site <site name> |
|
Mist Edges in a site |
LIST MistEdges WITH Site <site name> |
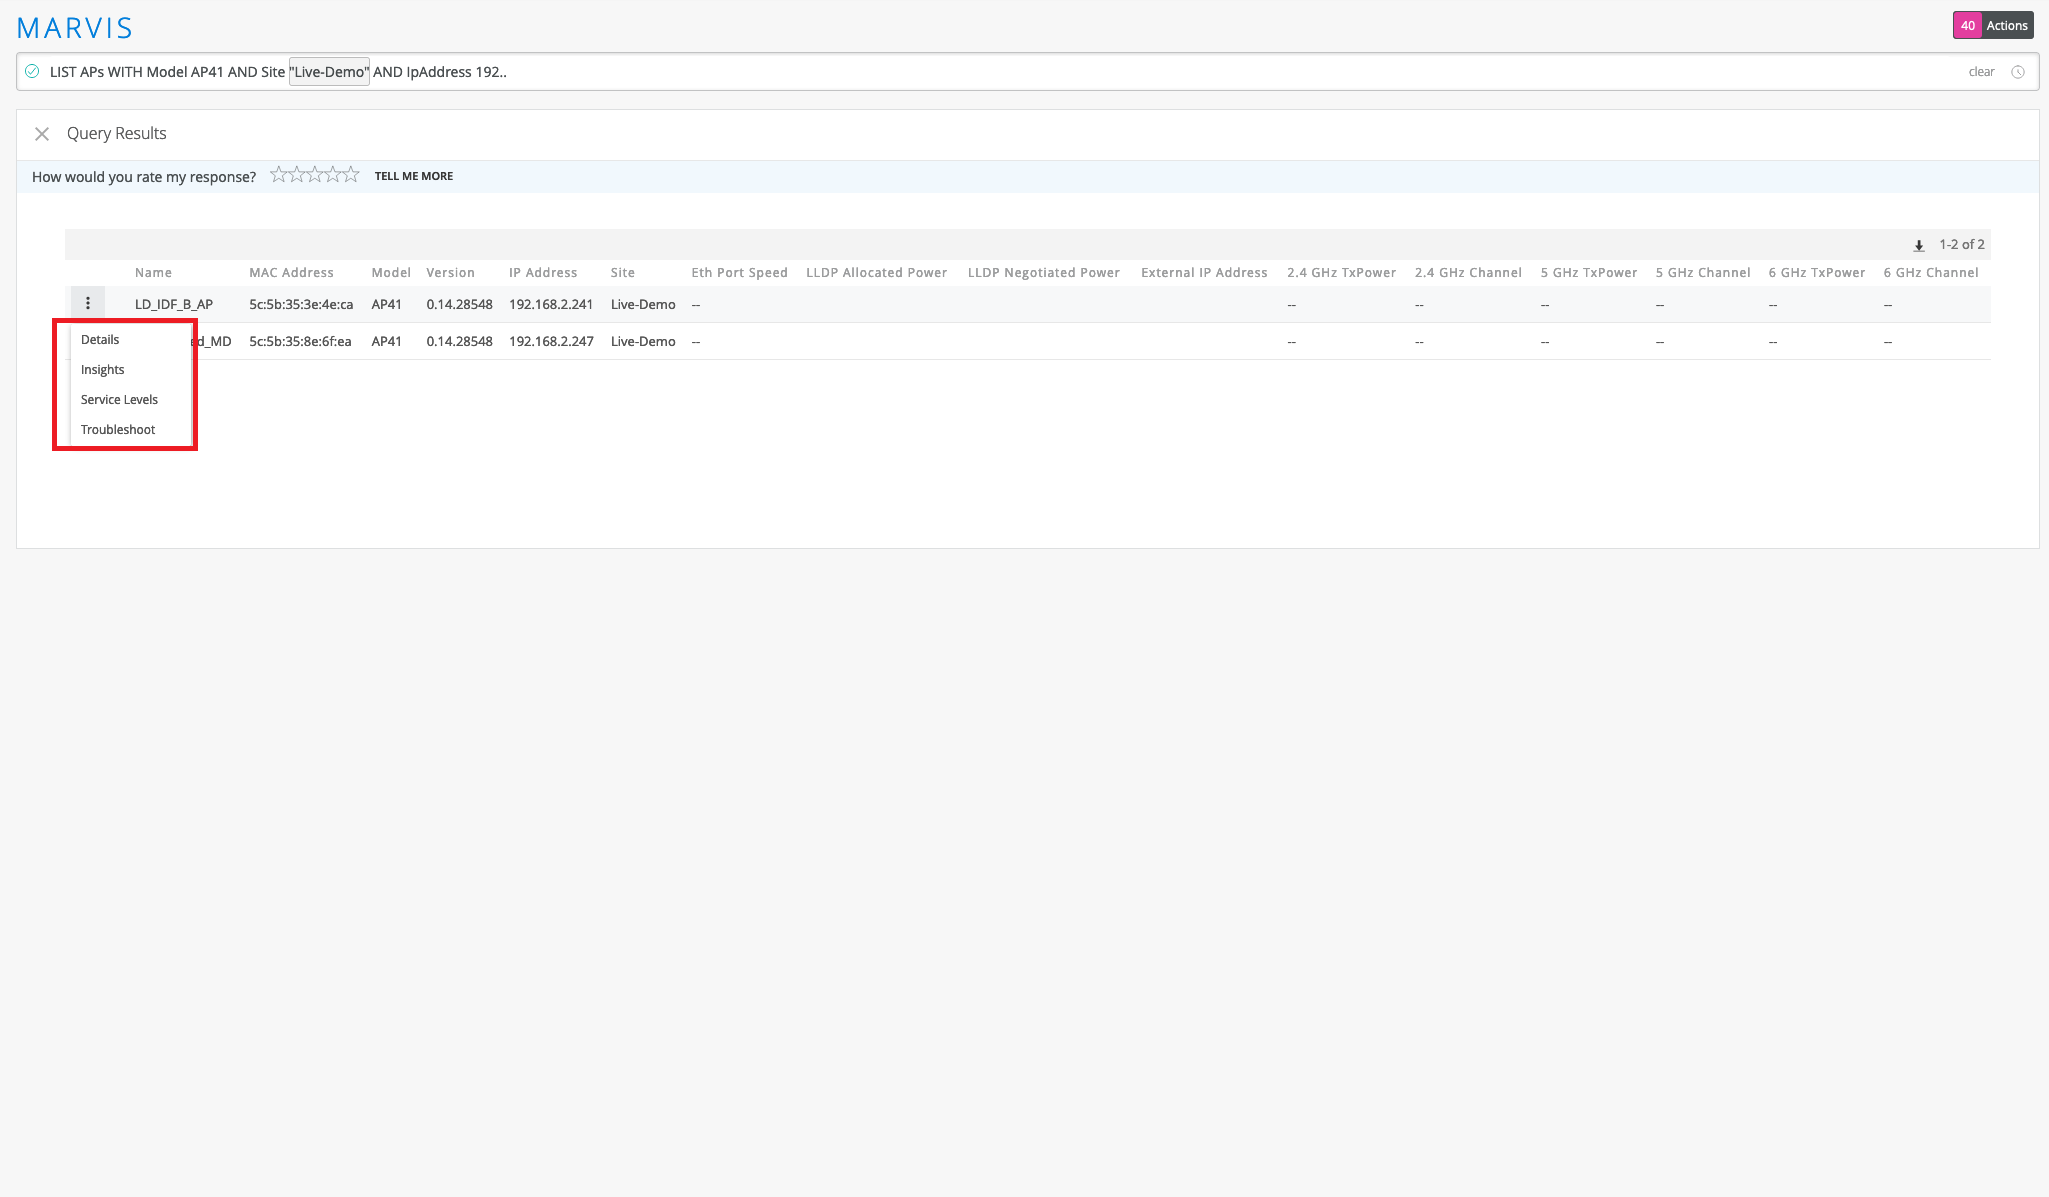
The following example shows the output for a LIST query. Note that you can enter a partial IP address to search for devices in specific subnets. For additional actions, you can click the More Options icon at the top-left corner of the table.
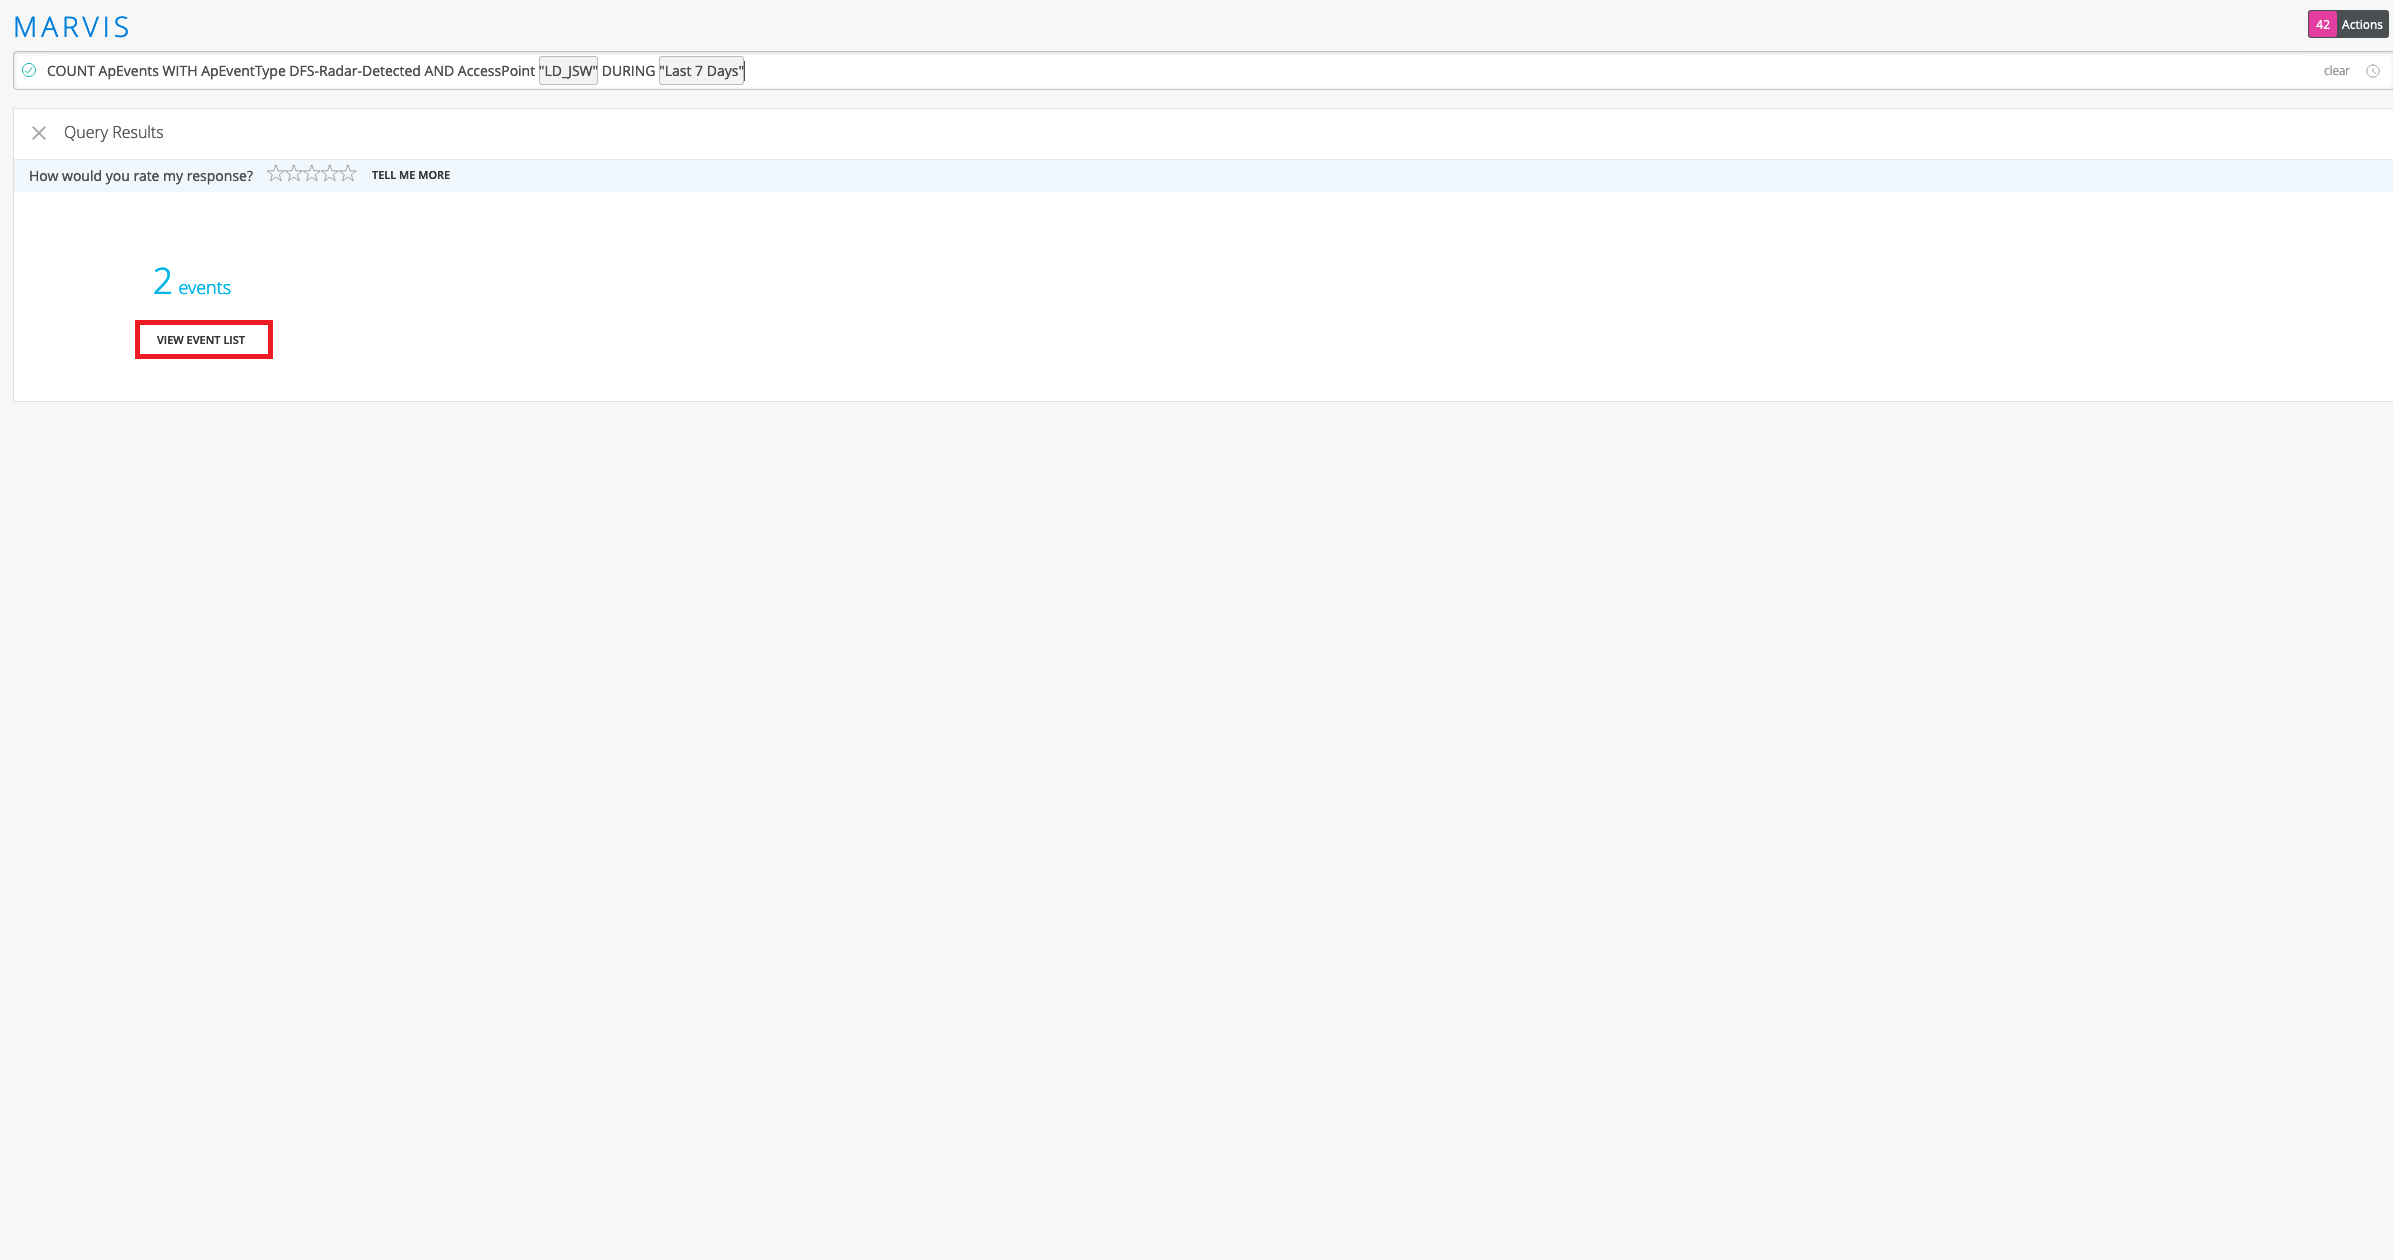
In addition to the LIST query, you can use the COUNT query to get a count of events or devices that match the query. The COUNT query uses the same structure as the LIST query. Here is a screenshot that shows a sample output for the COUNT query. You can click VIEW EVENT LIST to see the event details.
View Roaming Details of a Client
You can use the ROAMINGOF query to see a graphical view of a client roaming between different APs.
ROAMINGOF <client name> DURING <time interval>
View Status of a Client
The STATUSOF query provides an overview of clients that are facing connectivity issues in a site or wireless LAN (WLAN). The query output displays a ranked list of clients, starting with the clients experiencing the greatest number of issues. With this query, you can quickly identify clients facing connectivity issues in your site. You can use this query at the start of a troubleshooting session to identify the affected clients. You can then drill down into the client details to find the root cause of the issue. You can click a client to look at its service levels or insights, or to initiate the TROUBLESHOOT query on Marvis.
STATUSOF Clients WITH Site <site name>
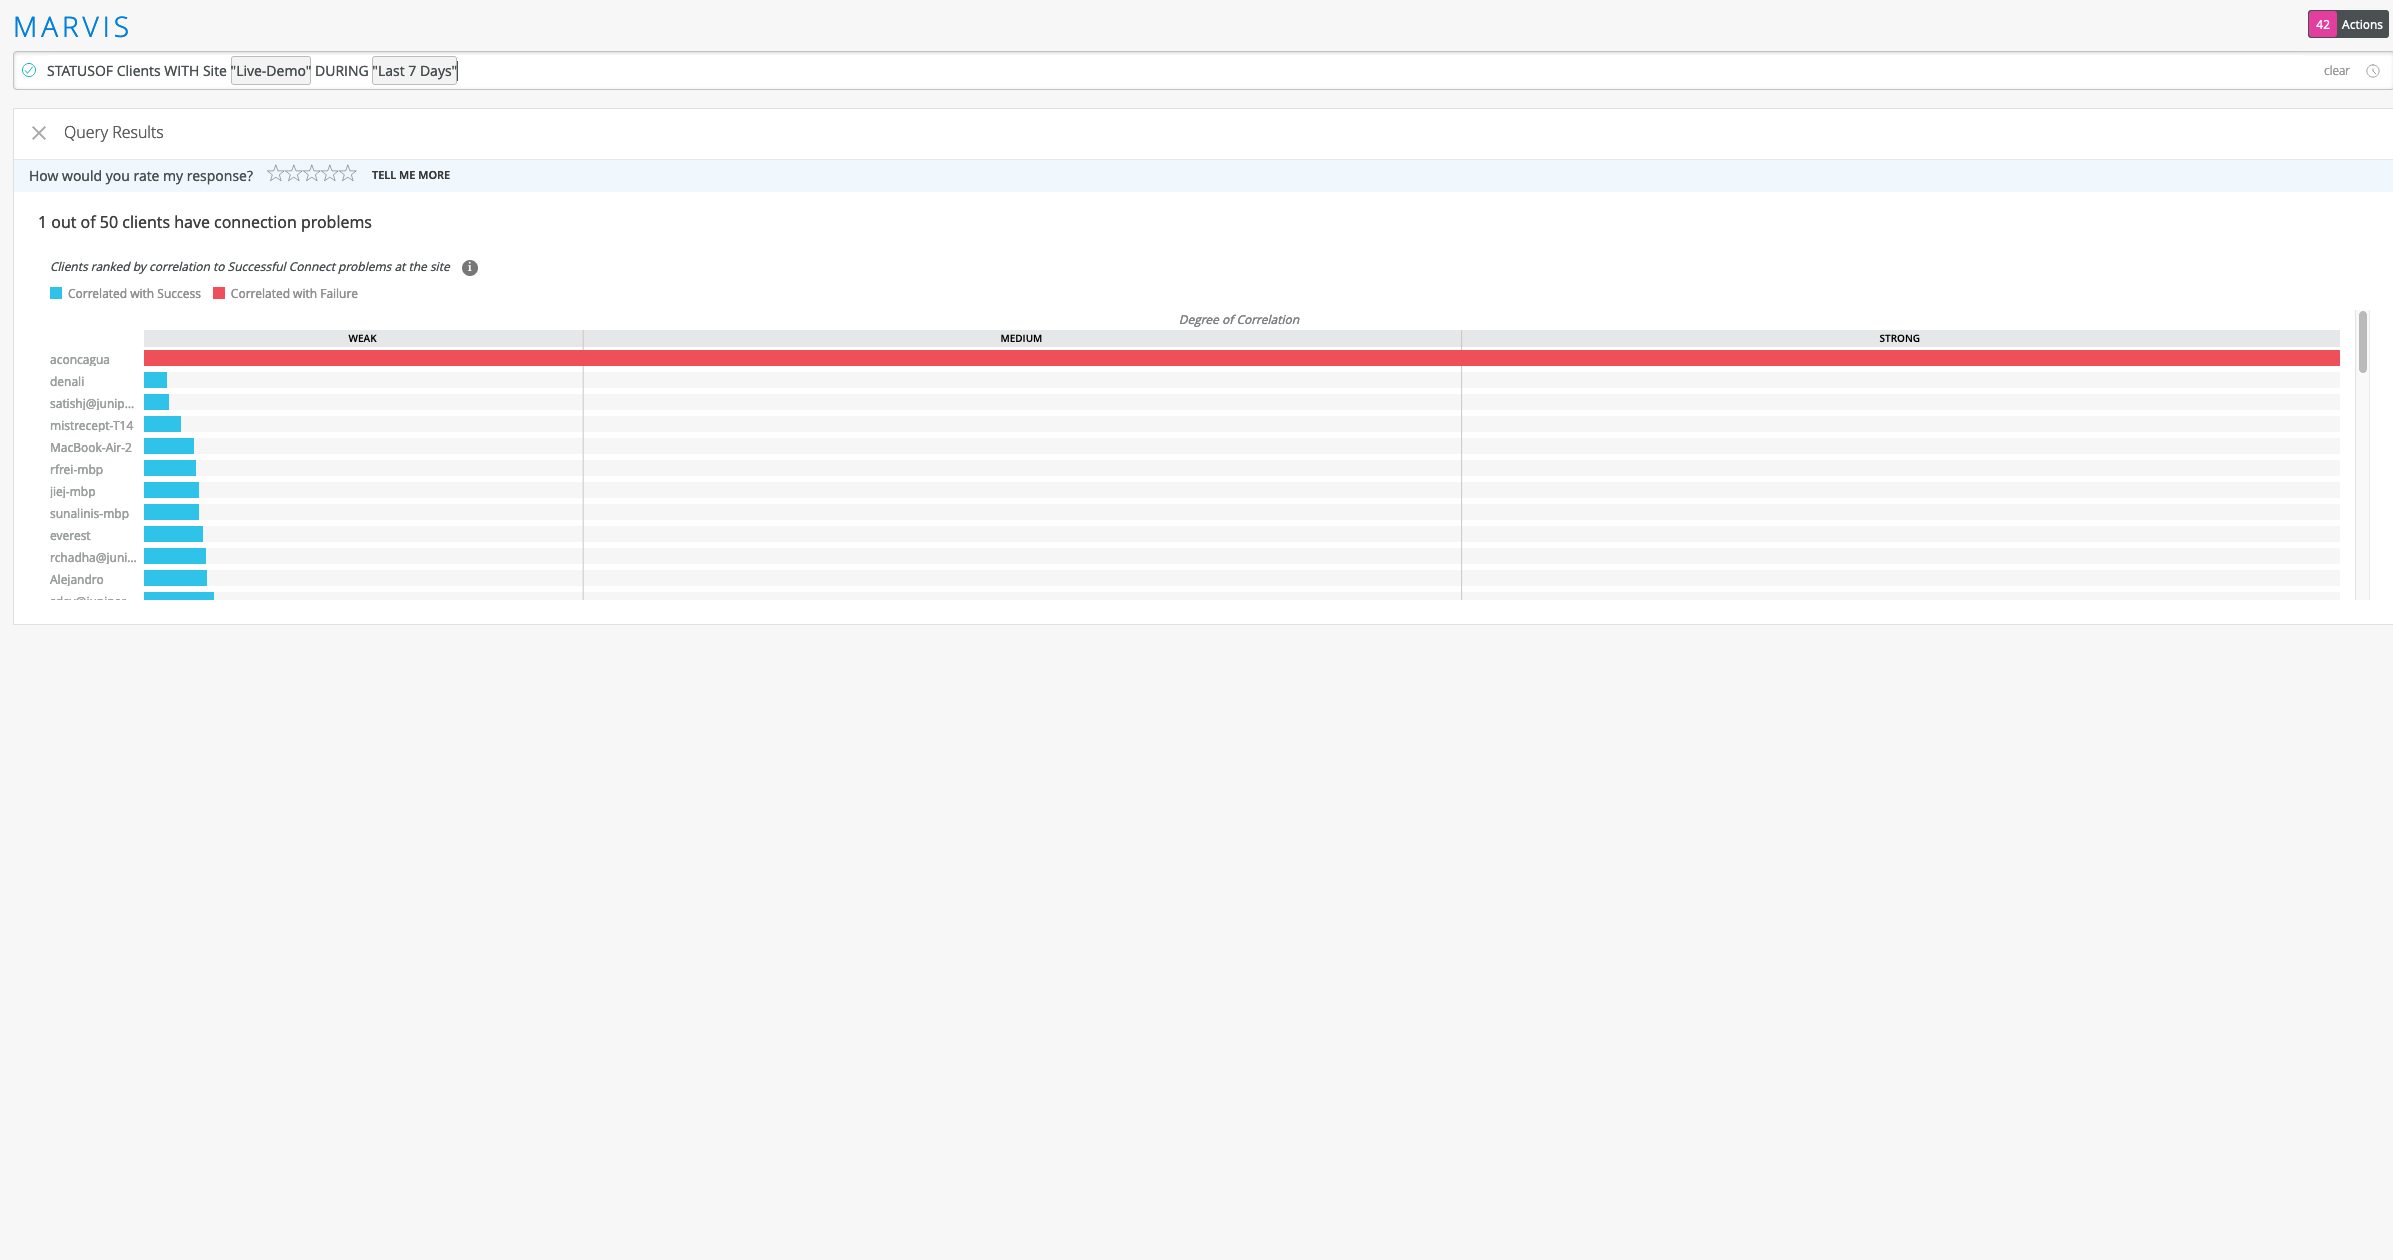
You can also view clients facing specific problems such as coverage issues, throughput problems, connectivity issues, and so on. For example, the query STATUSOF Clients WITH Problem Capacity lists all clients experiencing capacity issues in your organization.
Troubleshoot APs, Sites, or Clients
Table 3 lists a few TROUBLEHOOT queries that you can use to troubleshoot a site, a client, or an AP.
| If you want to troubleshoot | Use |
|---|---|
| A client, an AP, or a site | TROUBLESHOOT <client/site/AP name> |
| A wireless client, an AP, or a site facing connectivity issues | TROUBLESHOOT <client/site/AP
name> WITH Problem
SlowToConnect TROUBLESHOOT <client/site/AP name> WITH Problem UnableToConnect |
| A wireless client, an AP, or a site facing connectivity issues for a specific duration | TROUBLESHOOT <client/site/AP name> WITH Problem UnableToConnect DURING <time duration> |
The following screenshot shows the output for the TROUBLESHOOT <site name> WITH Problem UnableToConnect query. You'll see that Marvis provides data such as the cause of the issue, the band, and the WLAN on which the issue occurred.

You can drill down into more details by clicking each of the categories. If you click
the Service Levels category, Marvis provides more details
about the issue as shown in the following
screenshot:
Locate APs, Sites, or Clients
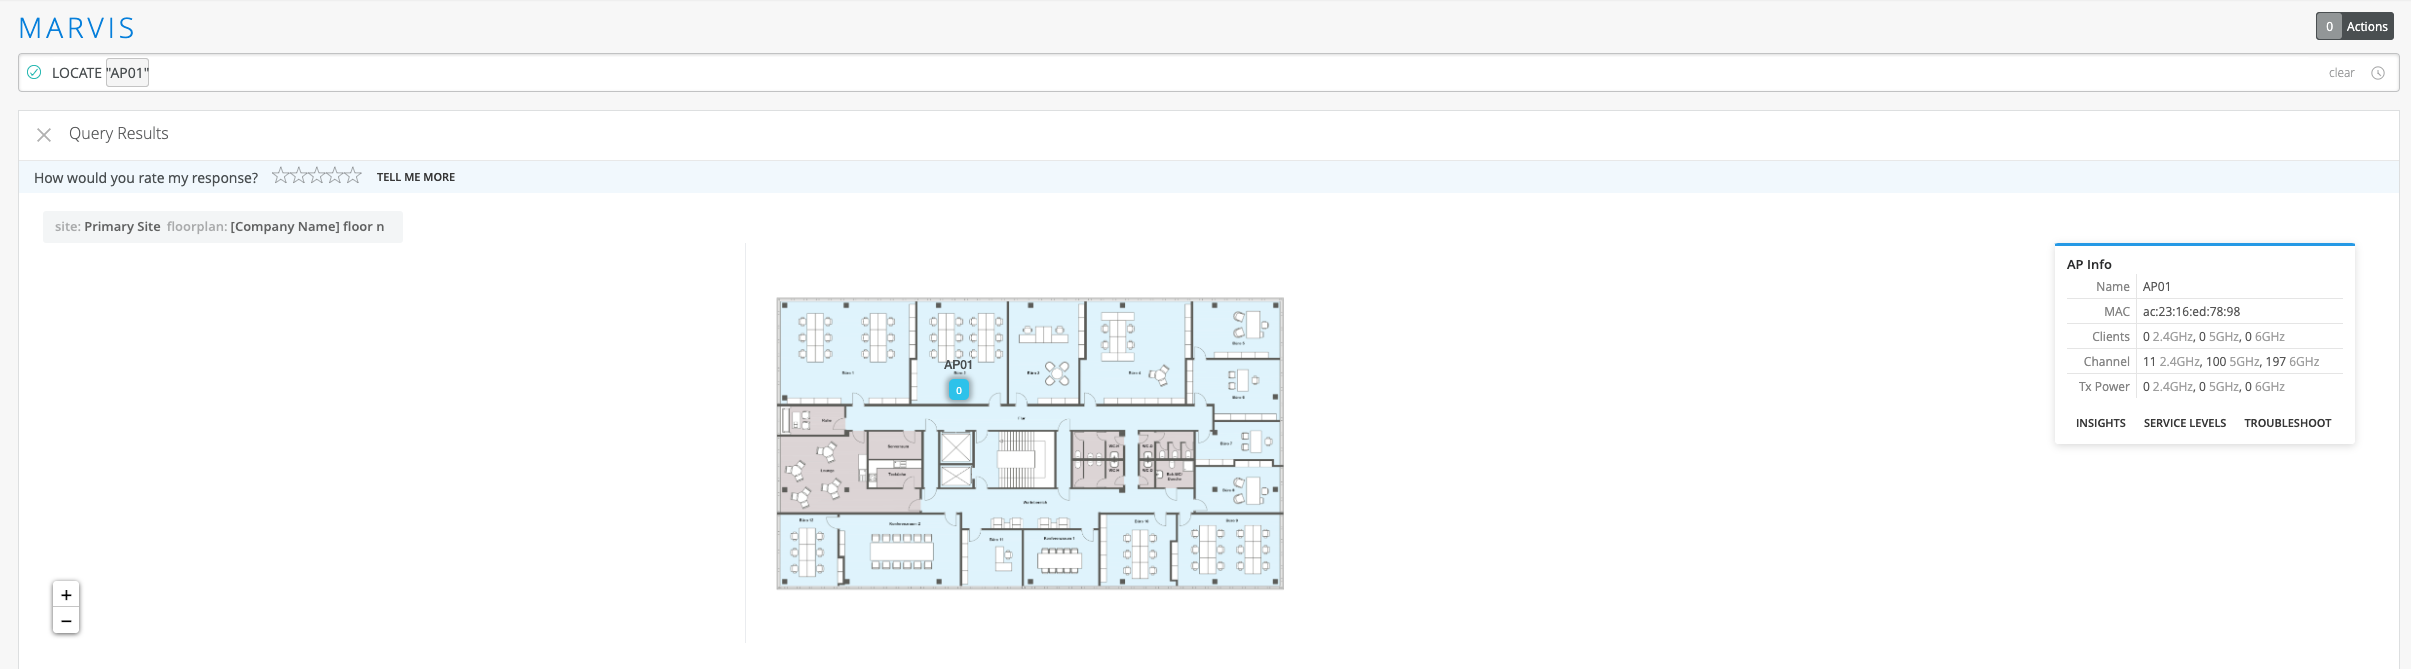
You can use the LOCATE query to find your site, AP, or client. The query output displays a map view of the site location that you configured in Organization > Site Configuration. For APs and clients, Marvis shows the location of these devices on your floorplan. Marvis also displays additional information and provides links to the Insights, Service Levels, and Troubleshoot pages.
View Channel Utilization of an AP
You can use the UTILIZATIONOF query to view the channels that an AP is broadcasting and the usage levels between the 2.4 GHz, 5 GHz, and 6 GHz bands. You can click Show Channels to see a breakdown of all specific channels that the AP uses.