Troubleshoot Wireless Connectivity Issues
To recap the information from the various chapters of this guide, this use case shows how you can use wireless SLEs, the Insights page, Marvis Actions, and the Marvis Conversational Assistant to investigate and troubleshoot connectivity issues.
Typically, you wouldn't use all these tools, but this use case illustrates the valuable insights that you can gain from these tools. Use whichever options suit your situation and your preferences for working in the Juniper Mist™ portal.
Troubleshoot with the Successful Connects SLE
Let's start on the Wireless SLEs dashboard. SLEs offer insights into current and past issues.
To find the Wireless SLEs dashboard, select Monitor > Service Levels from the left menu, and then click the Wireless button.
In this example, you see that only 22 percent of connects were successful. On the right side of the SLE block, you see that 98 percent of the issues involved DHCP errors.
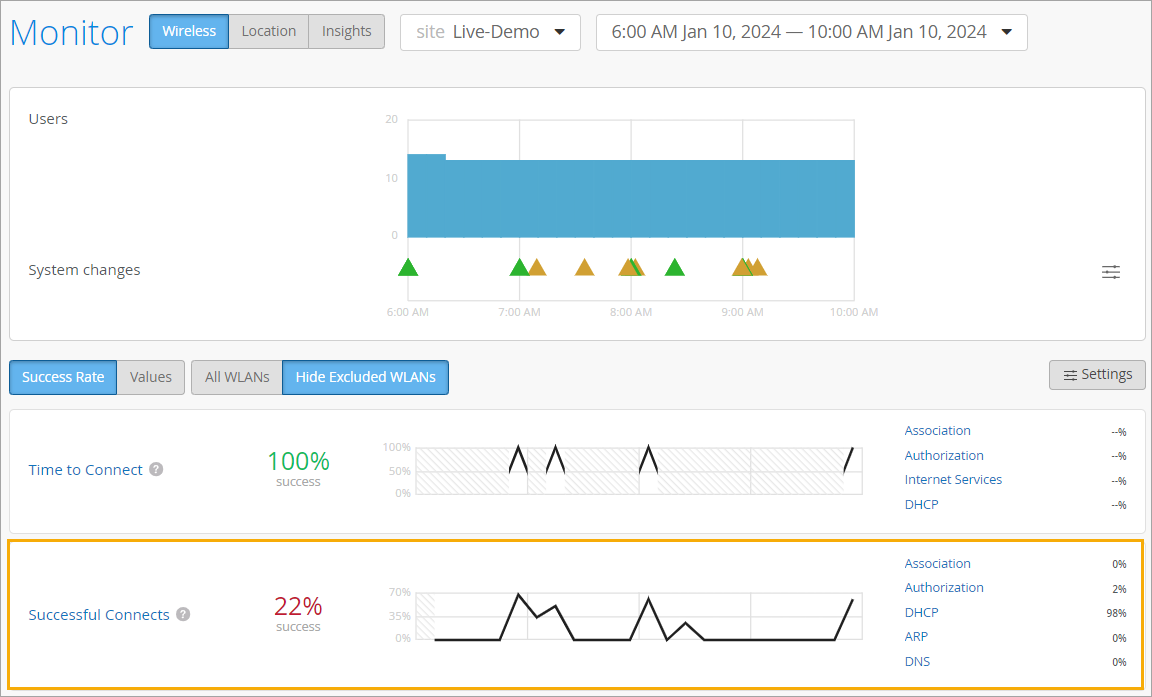
Although this example focuses on DHCP errors, you can see that this SLE provides insights into various factors that can affect connectivity, including authorization, ARP, and DNS issues. For more information about this SLE and its classifiers, see Wireless SLEs.
As shown in the following animation, you can click the DHCP classifier to view the Root Cause Analysis. There, you can explore the sub-classifiers, statistics, and timeline. You can see which devices were affected, when they were affected, and where they're located.
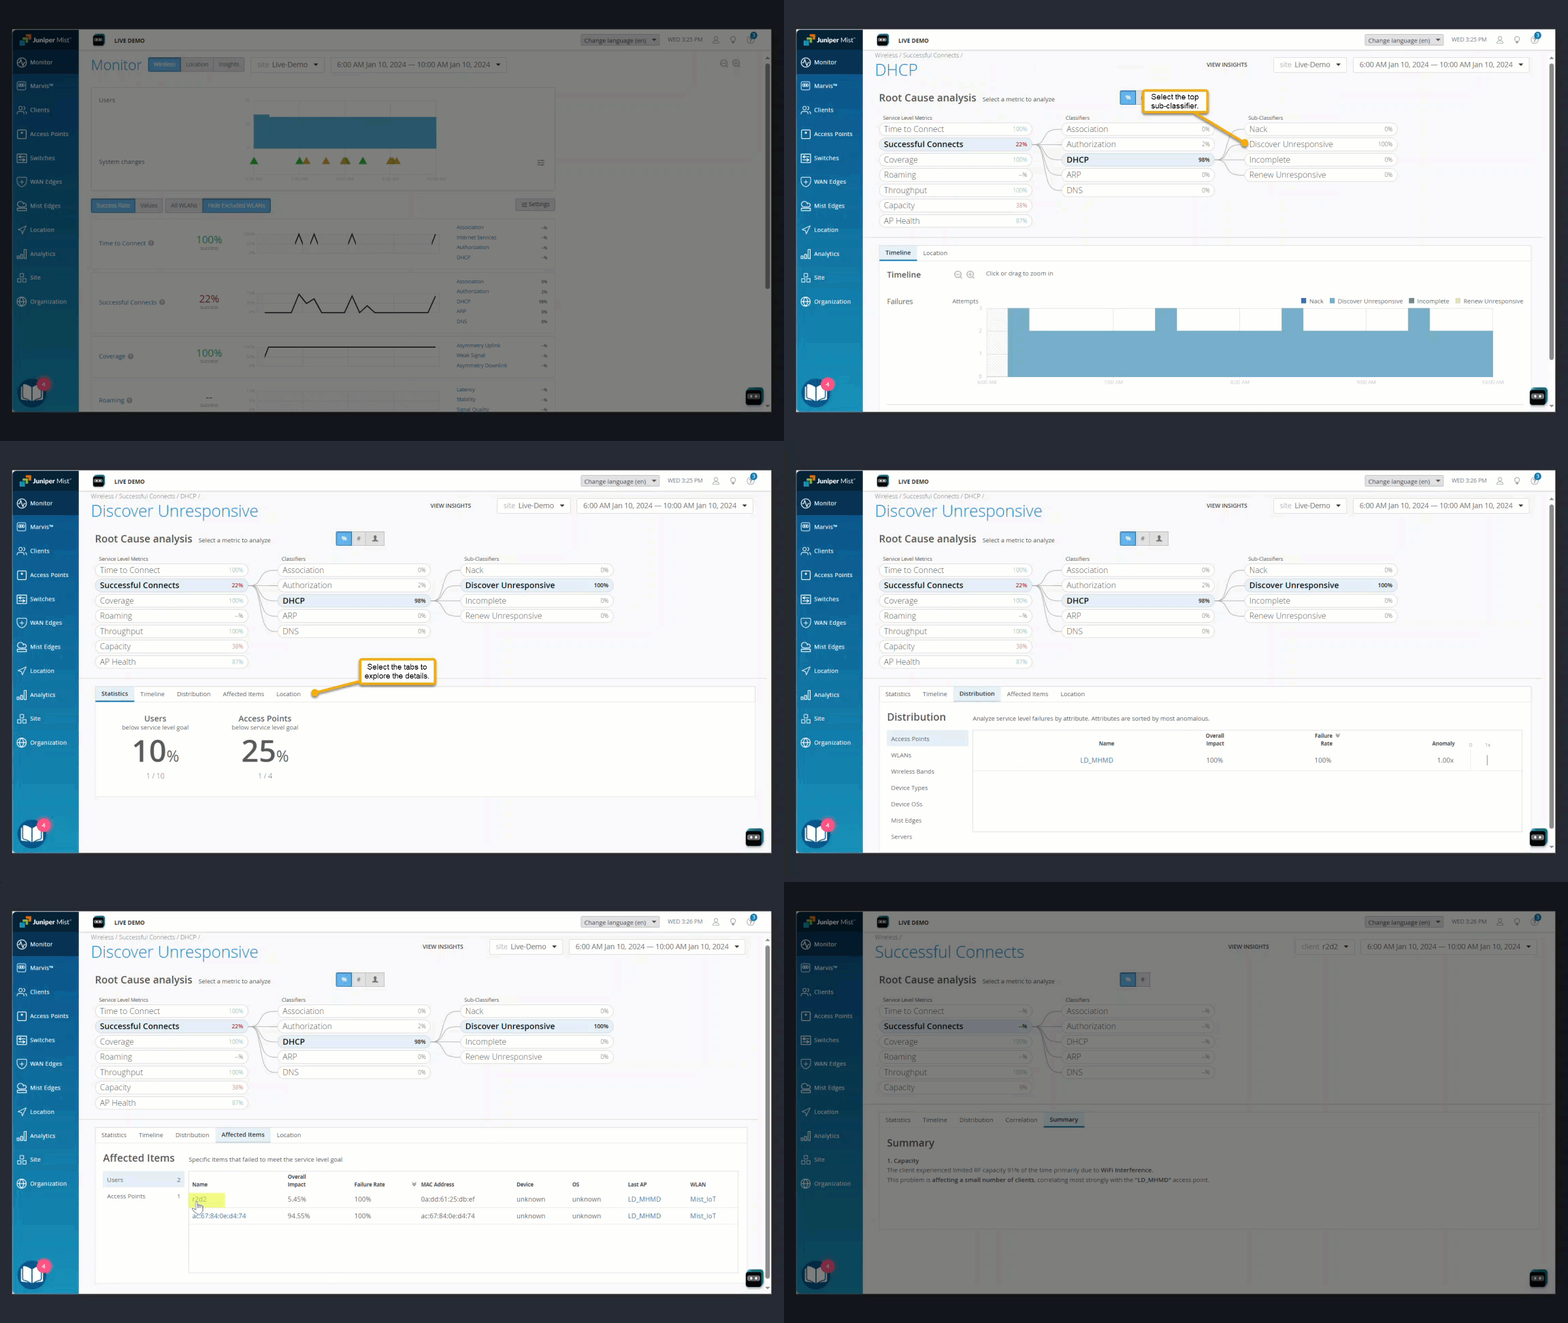
As you explore the Root Cause Analysis page, you can discover:
- If the failures are being observed across access points (APs) or specific APs.
- If the failures are being observed for specific device types or across all device types.
- If the failures are being observed across all Wireless Lans (WLANs) or a specific WLAN.
Explore Further on the Insights Dashboard
As you identify the impacted devices, you can get more details on the Insights dashboard. This dashboard offers information about current and past issues.
To find the Insights dashboard, select Monitor from the left menu of the Juniper Mist portal. Then click the Insights button at the top of the Monitor page.
For connectivity issues, it's helpful to look at AP Events and Client Events.
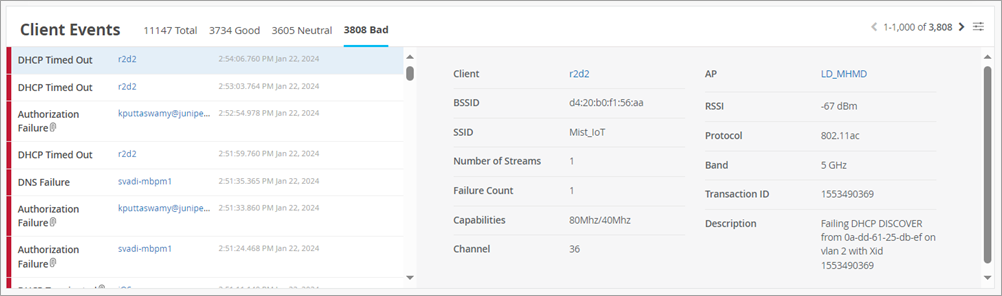
For this example, let's look at Client Events. If you click the Bad tab at the top, you can focus on the user-impacting issues. In this example, you see the details that are available for a DCHP timeout. For more information about an incident, you can click the link on the client name or the AP name.
Get Quick Recommendations About Ongoing Issues
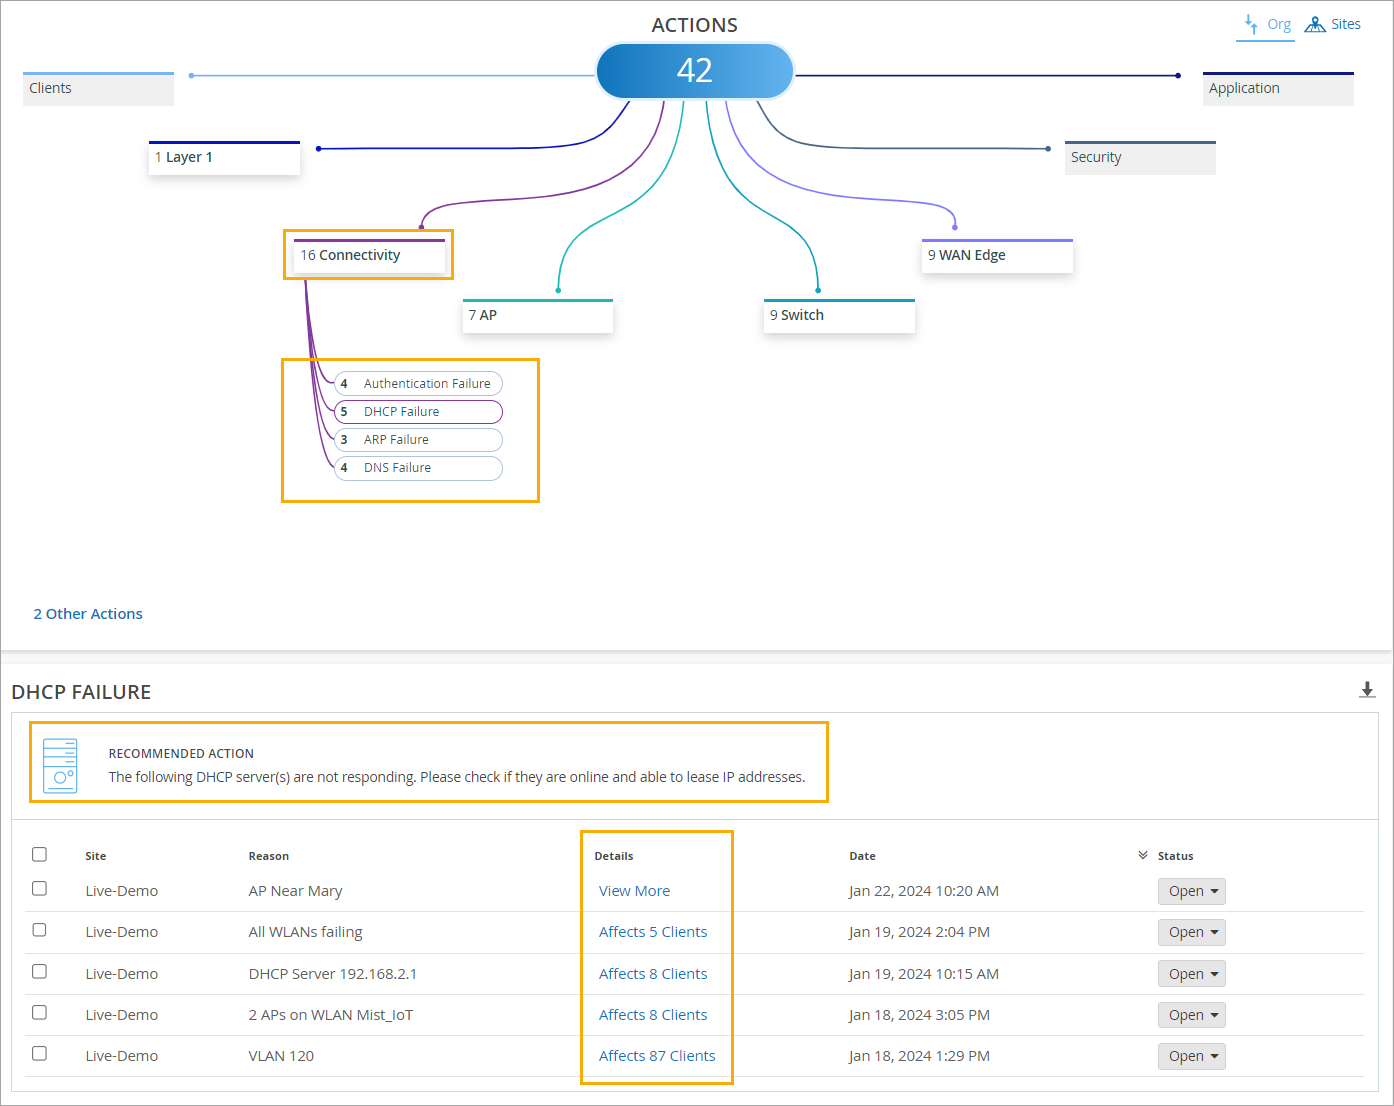
The Marvis Actions dashboard offers quick recommendations about current and past issues.
In this example, the Actions dashboard shows several connectivity issues. In this example, DCHP Failure has the highest number of issues. When you click DHCP, you see a recommended action. You also see the scope of the issue: which sites were affected, what happened, and when the issues occurred.
Troubleshoot with Marvis
If you have a Marvis subscription, you get help by clicking the Marvis icon and entering questions.

Look for the Marvis icon at the top-left or bottom-right corner of the Juniper Mist portal.
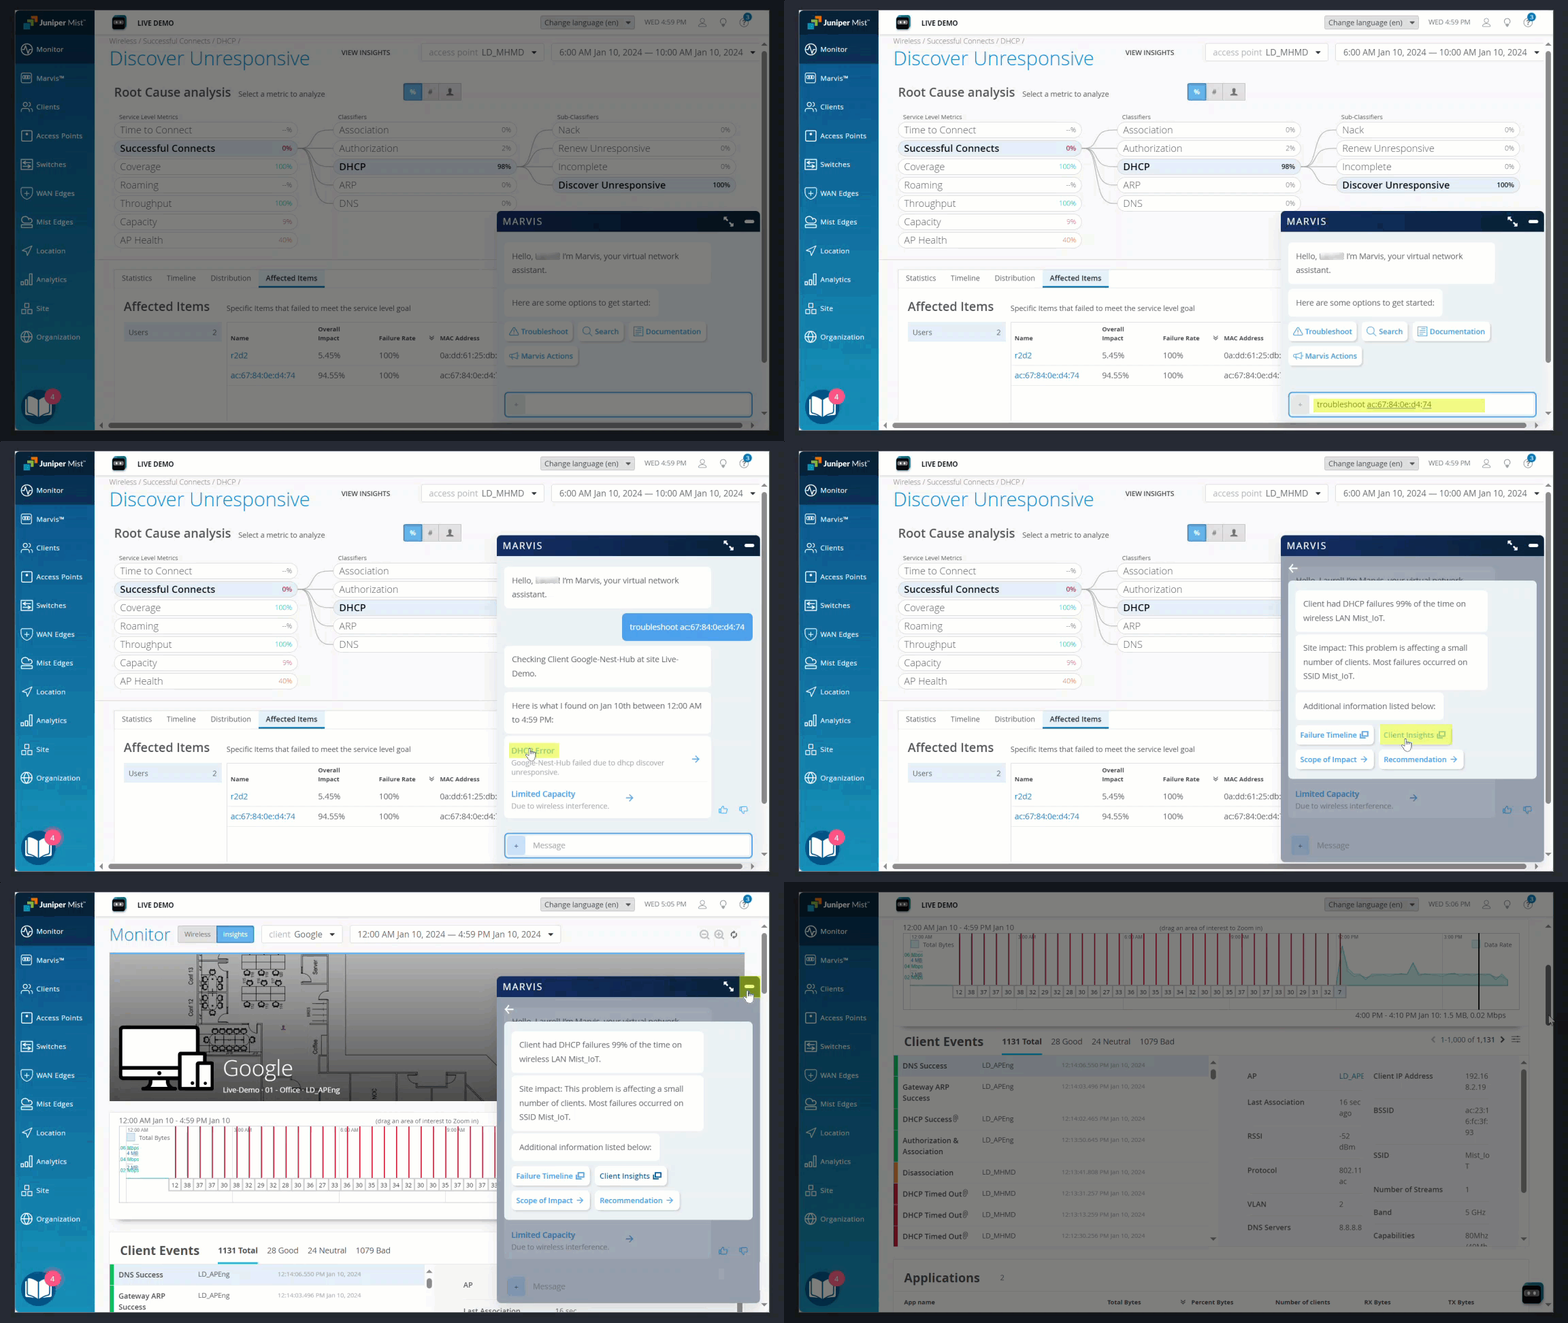
As shown in the animation below, you can enter troubleshoot followed by the MAC address or hostname of a device. Then interact with Marvis to get the information that you need.