Marvis Conversational Assistant (Enhanced Version Using Agentic AI)
Get started using the Marvis Conversational Assistant to get information about your network, identify and troubleshoot issues,
The AI-driven Marvis conversational assistant functions as an intelligent troubleshooting aid by providing first-level assistance through issue identification, network telemetry analysis, and targeted corrective action recommendations. These capabilities streamline diagnostic workflows, improve operational efficiency, and significantly reduce issue resolution time. By leveraging multiple workflow agents, data sources, tools, and advanced natural language processing, Marvis interprets prompts from users and translates them into meaningful diagnostic actions
Marvis surfaces as much insight as possible from the collected telemetry data so that you have direct, actionable information for your queries. The conversational assistant provides a consolidated and unified view of everything you need for a quick and effective analysis. From issue descriptions and impact analysis to likely root causes, recommendations, and trends, the conversational assistant presents a comprehensive set of information. As a result, you do not need to spend significant time navigating multiple pages and piecing information together.
Finding the Conversational Assistant
Click the Marvis icon at the top-left corner or bottom-right corner of the Juniper Mist portal. You can also press Ctrl + K to open the conversational assistant.
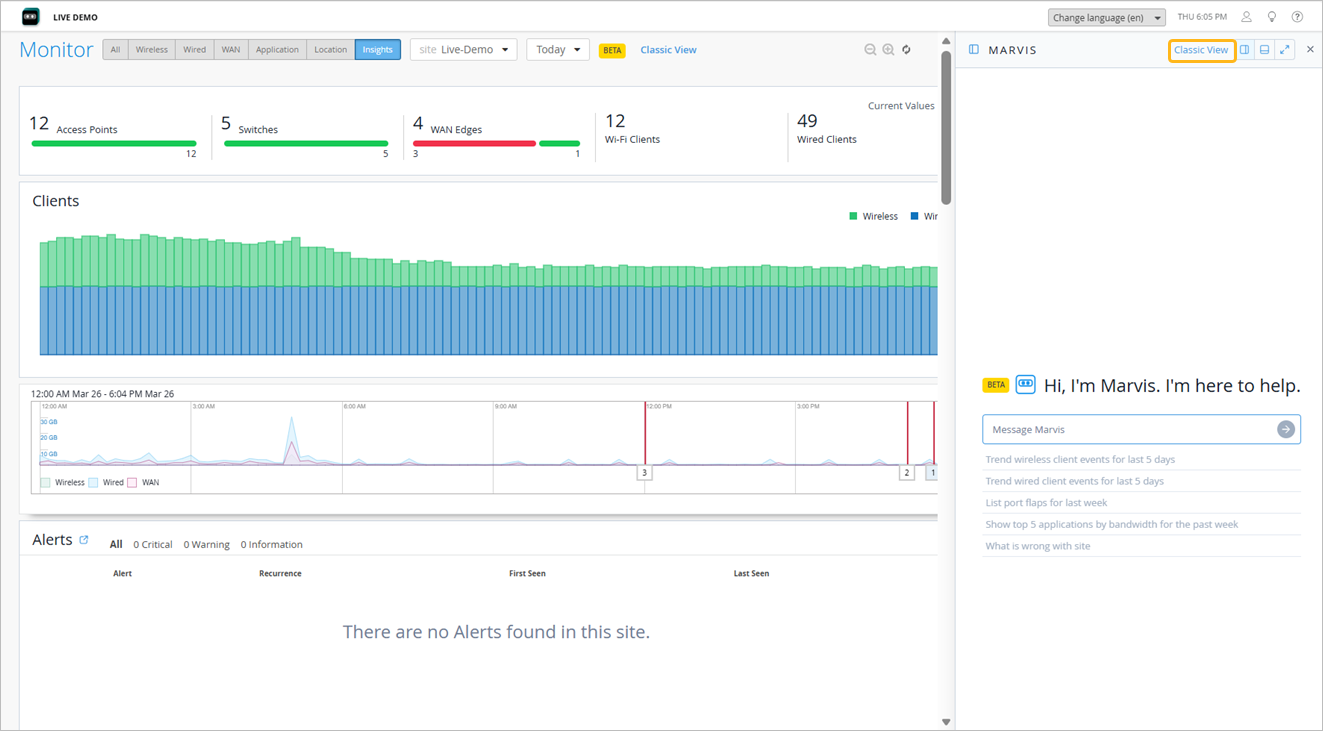
You can also switch to the earlier view (Classic View) using the link on the upper right corner of the page. If you need to switch to the enhanced view again simply minimize the Marvis conversational interface and click the Marvis icon again.
You can dock the conversational assistant window to the bottom or right side of your screen to keep it consistently visible. This enables you to navigate through the pages on the Mist portal while keeping the conversational assistant window in view. Certain debug answers include embedded links that open in a new tab, ensuring that the original Marvis conversational interface remains open in its current tab. Use the icons on the top right corner to dock the window. Once the window is docked, Mist automatically saves the docked location. You can also resize the window by dragging its border.

The window retains its last size and docked location (bottom or right) when you log out of the Mist portal and log in again,
Guidelines to Write Prompts for the Marvis Conversational Interface
We recommend that you follow these guidelines to enable the AI assistant to deliver accurate insights, perform effective troubleshooting, and provide actionable recommendations.
| Guidelines | Examples |
|---|---|
| A clear and concise description of what you want to know or resolve helps Marvis to interpret your request better. A well-framed query helps Marvis to determine whether you’re looking for information, visibility into the network, or support with diagnosing an issue. |
|
| Details about the impacted scope (such as site name, client information, or device information) enable Marvis to narrow and focus its analysis. By default, Marvis considers a 24-hour period; including a relevant time range can further refine the response. |
|
| You can use natural language without needing specific commands. For clarity, we recommend that you ask one primary question at a time and use follow-up questions to refine the query. |
|
| Symptoms play an important role in effective troubleshooting. Clear and detailed descriptions of the symptom or issue enable Marvis to provide a more focused and accurate response. |
|
Example Prompts for the Marvis Conversational Interface
Here are a few sample responses generated for different prompts. These examples will help you understand how you can structure and use prompts to obtain the information you need.
Track the trend and progression of bad client events over time.
Prompt: trend bad client events in last 7 days
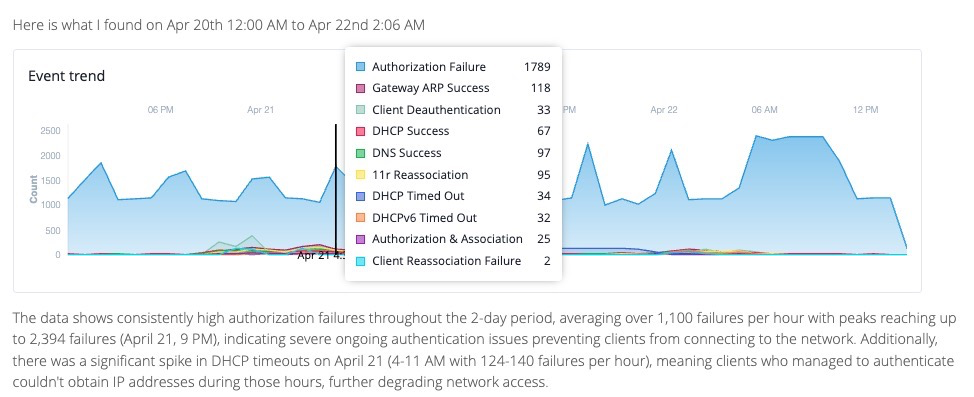
You can use a followup query to filter the results. For example, here is an output that excludes the authorization failures:

-
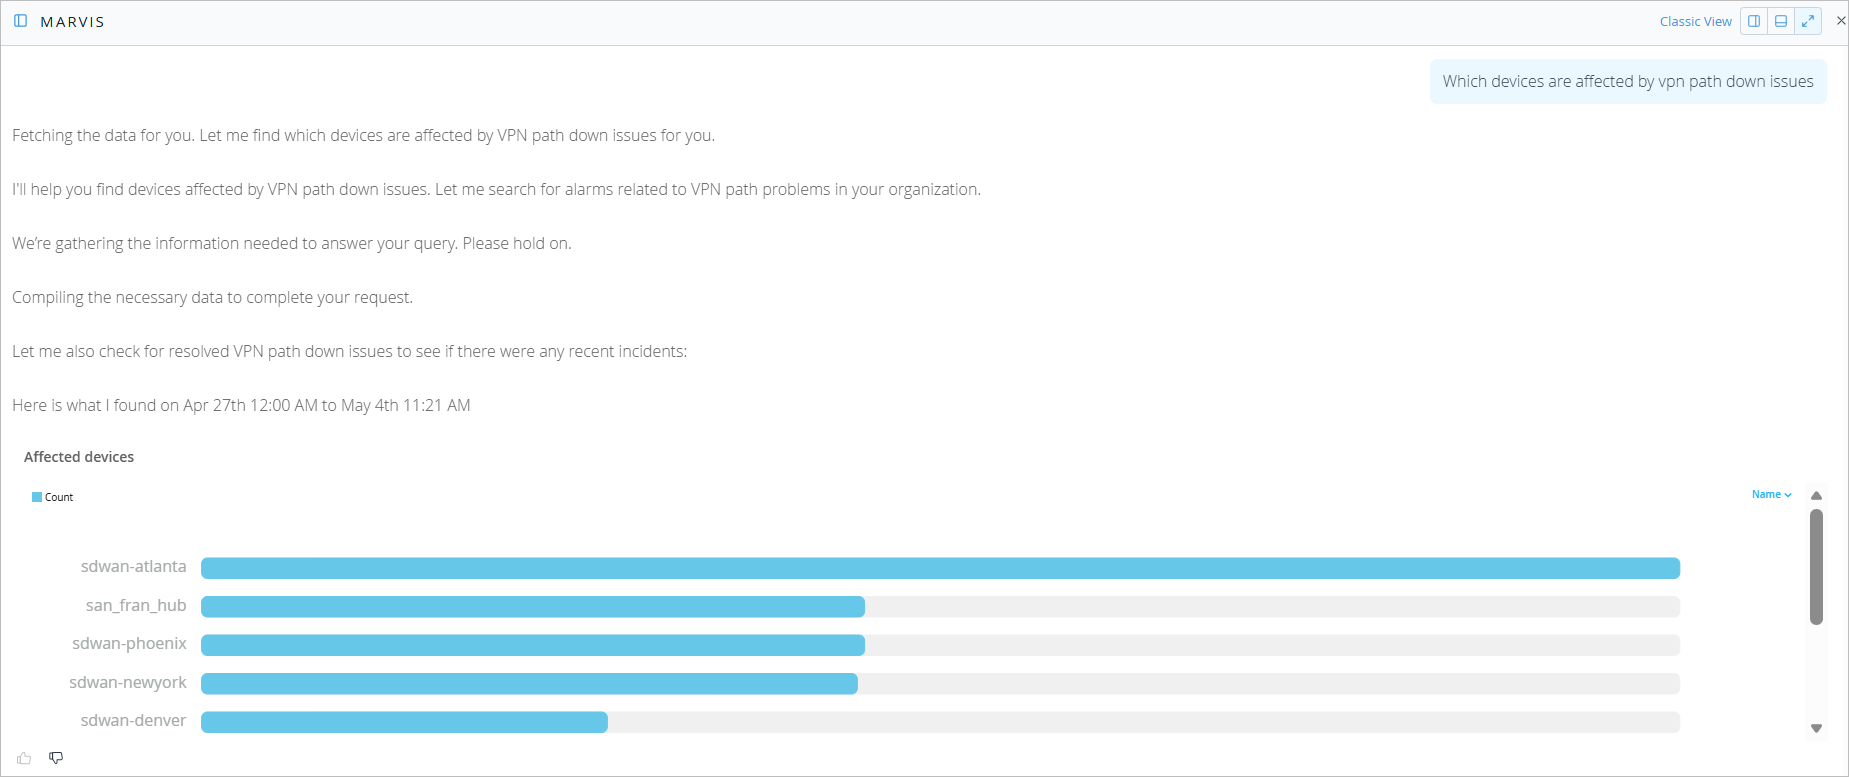
Identify devices experiencing VPN path down issues.
Prompt: Which devices are affected by vpn path down issues
-
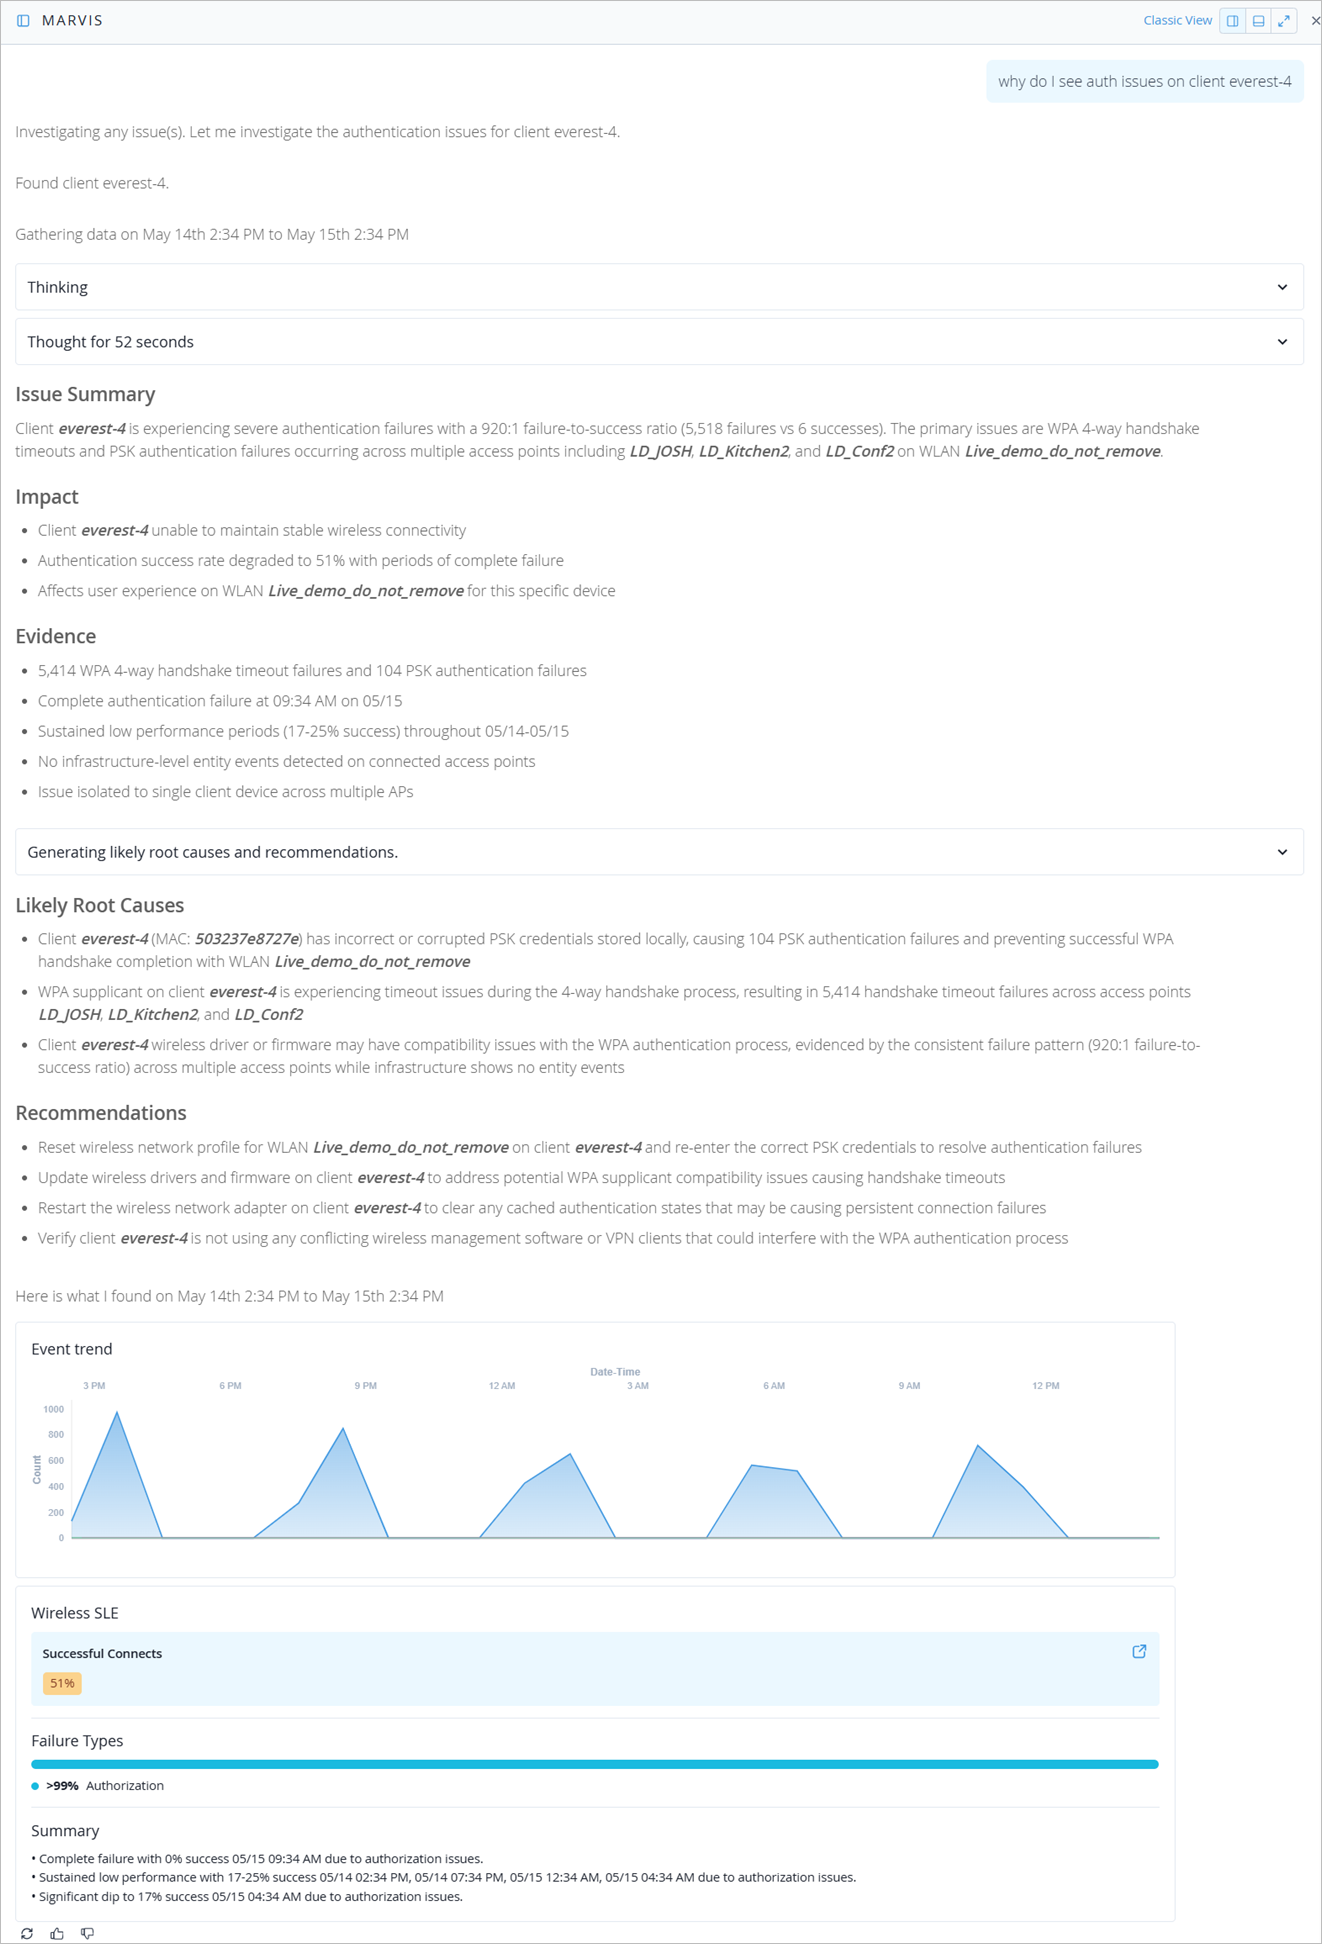
Identify what’s causing auth issues at a specific site.
Prompt: why do I see auth issues on client everest-4
-
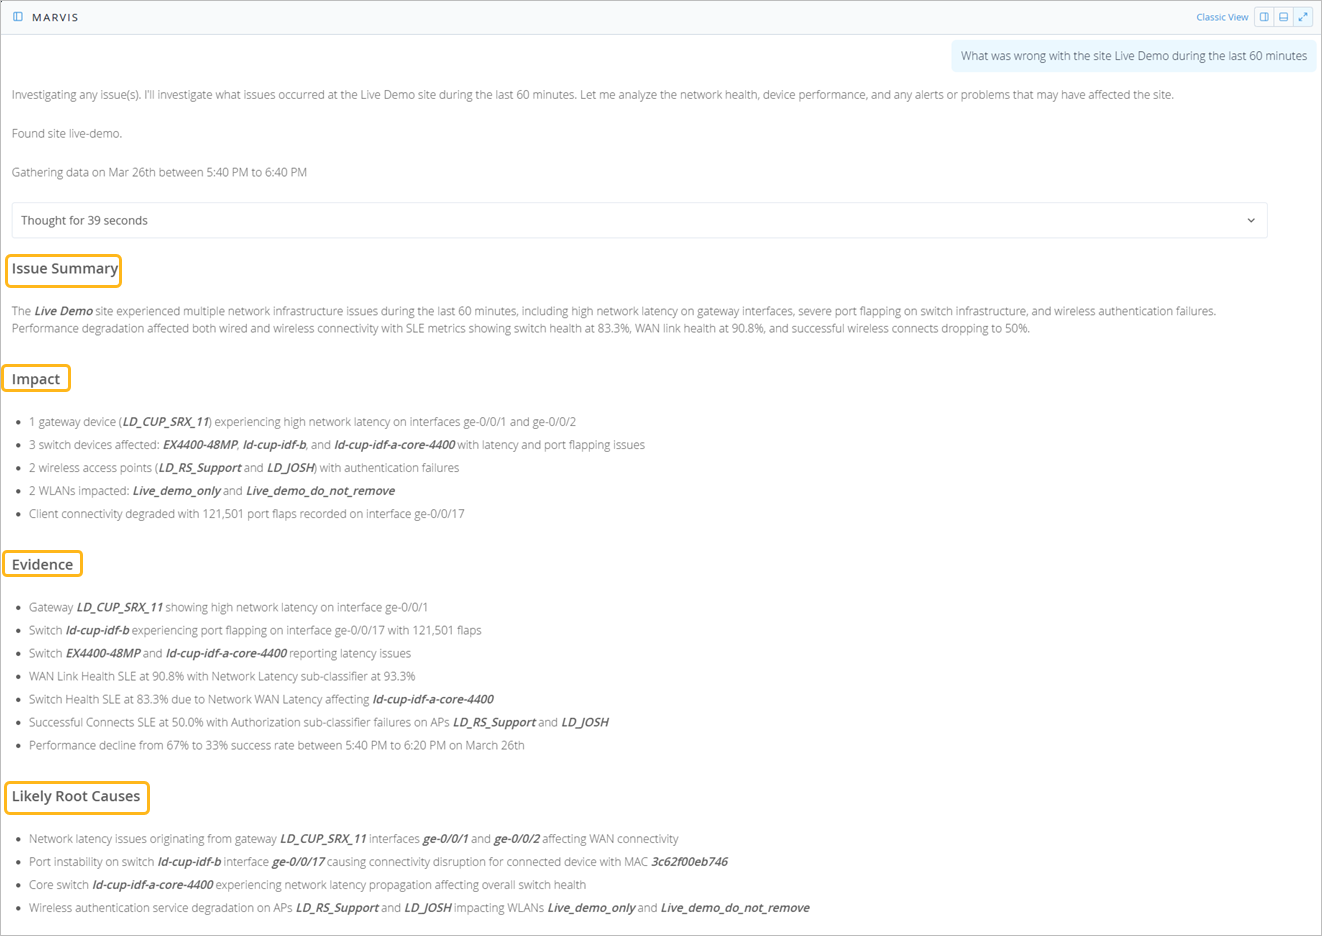
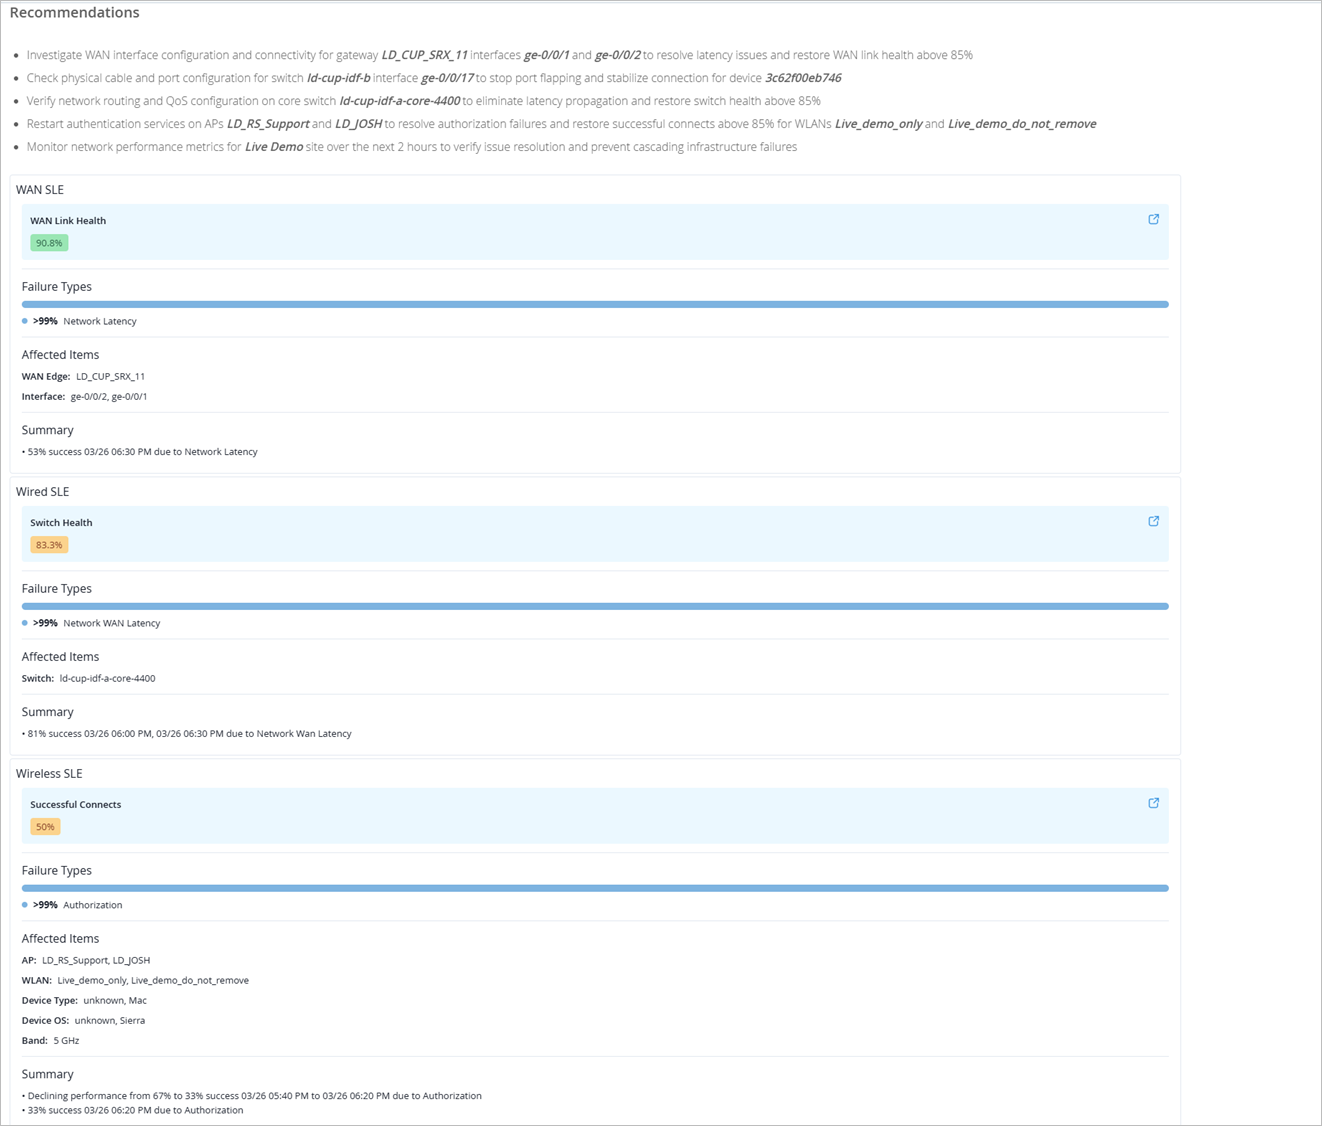
Gain a clear understanding of the issues occurring at the specific site.
Prompt: What was wrong with the site Live Demo during the last 60 minutes
-
View the roaming history for a client.
Prompt: show me the roam of client ZS-user106 in last 7 days

-
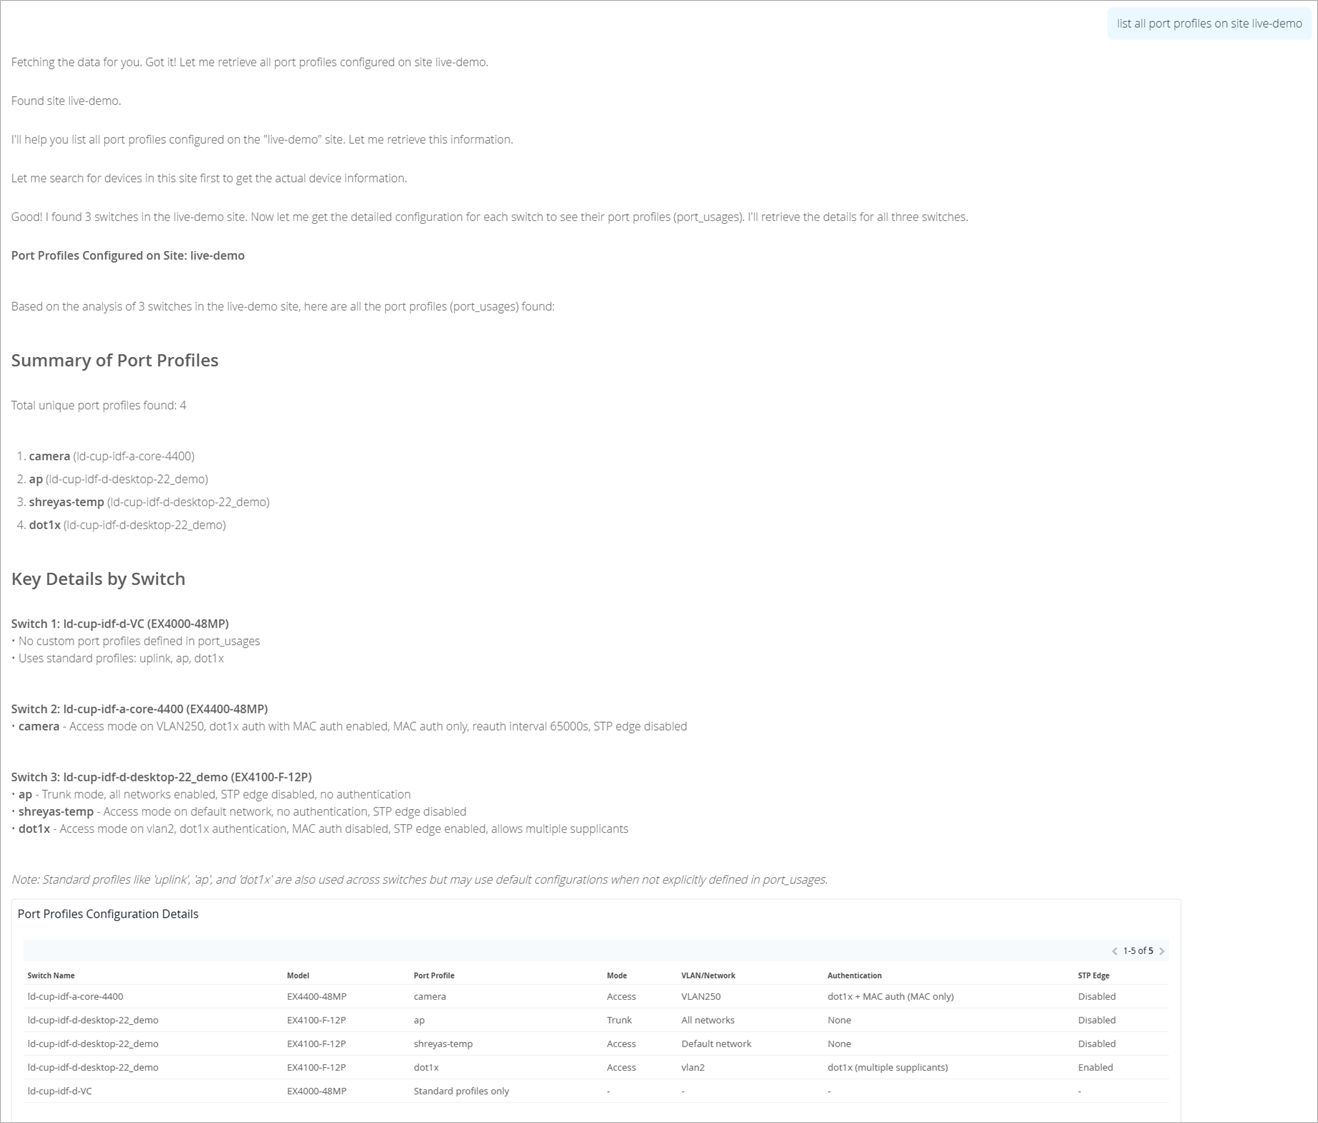
View a list of port profiles configured on the switches in a specific site.
Prompt: list all port profiles on site live-demo
-
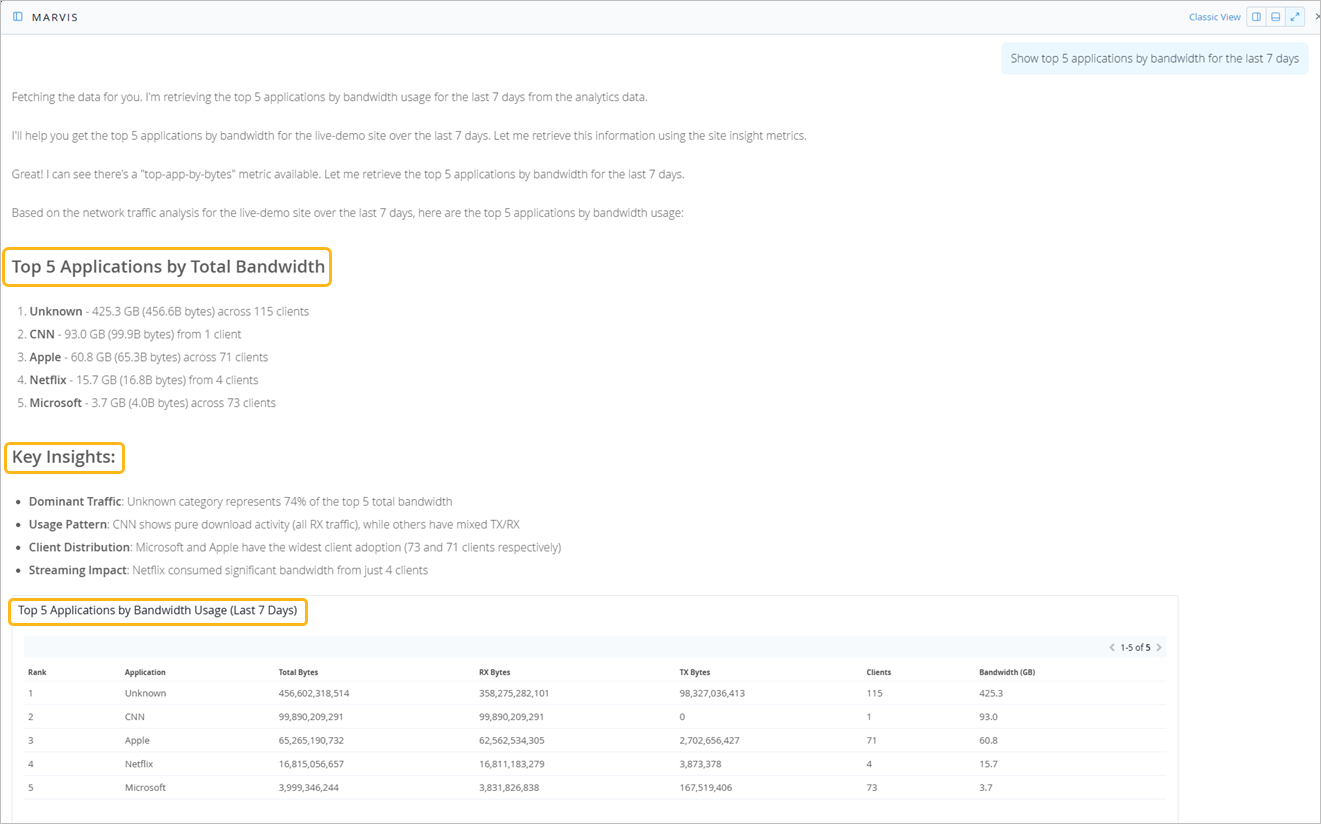
View the top five applications by bandwidth usage.
Prompt: Show top 5 applications by bandwidth for the last 7 days
-
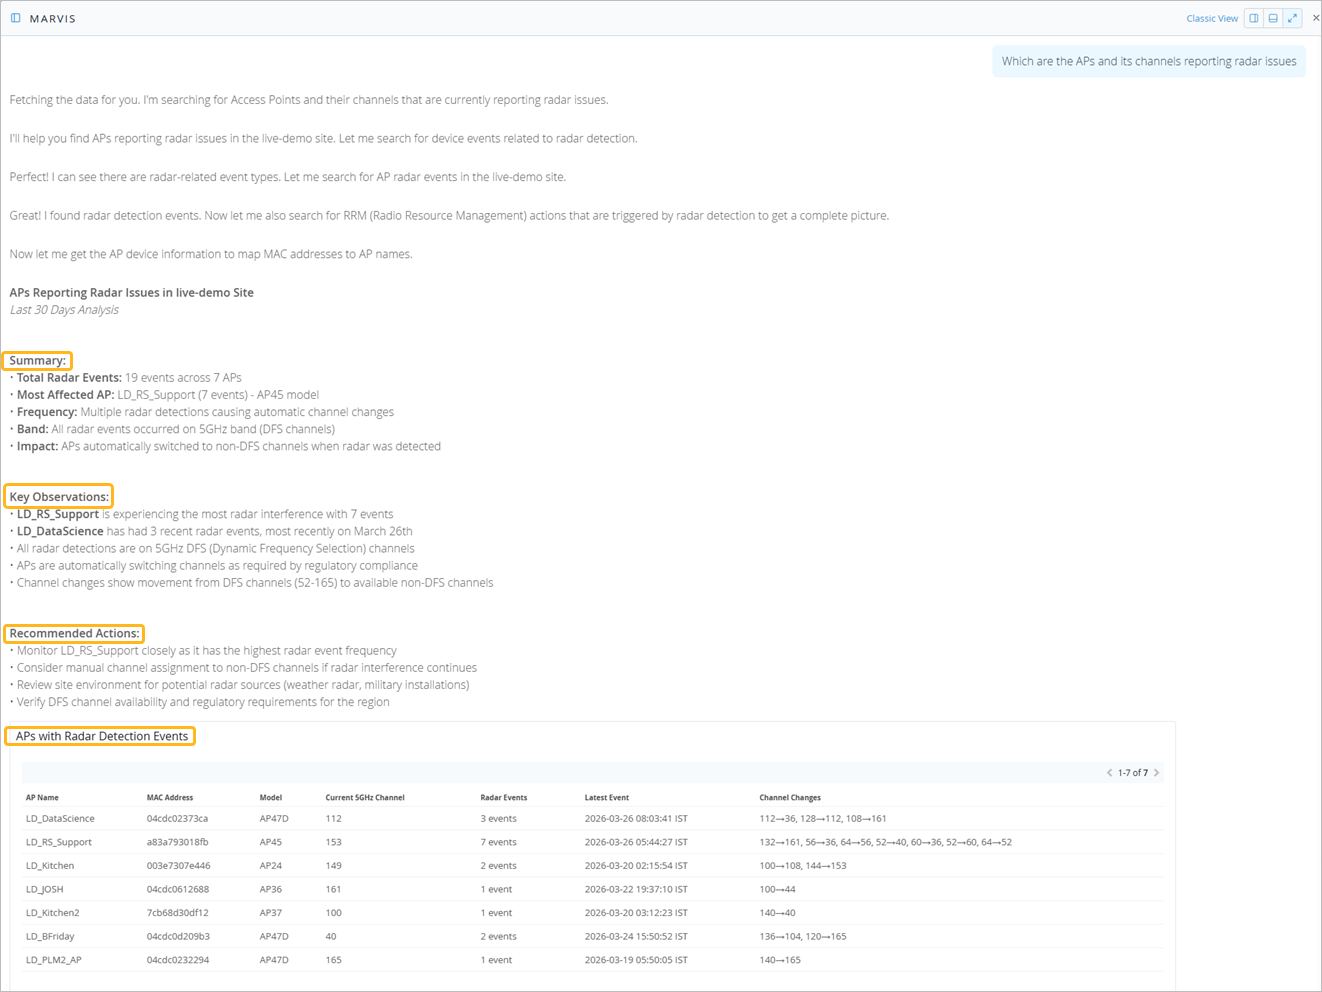
View APs reporting radar issues
Prompt: Which are the APs and its channels reporting radar issues
-
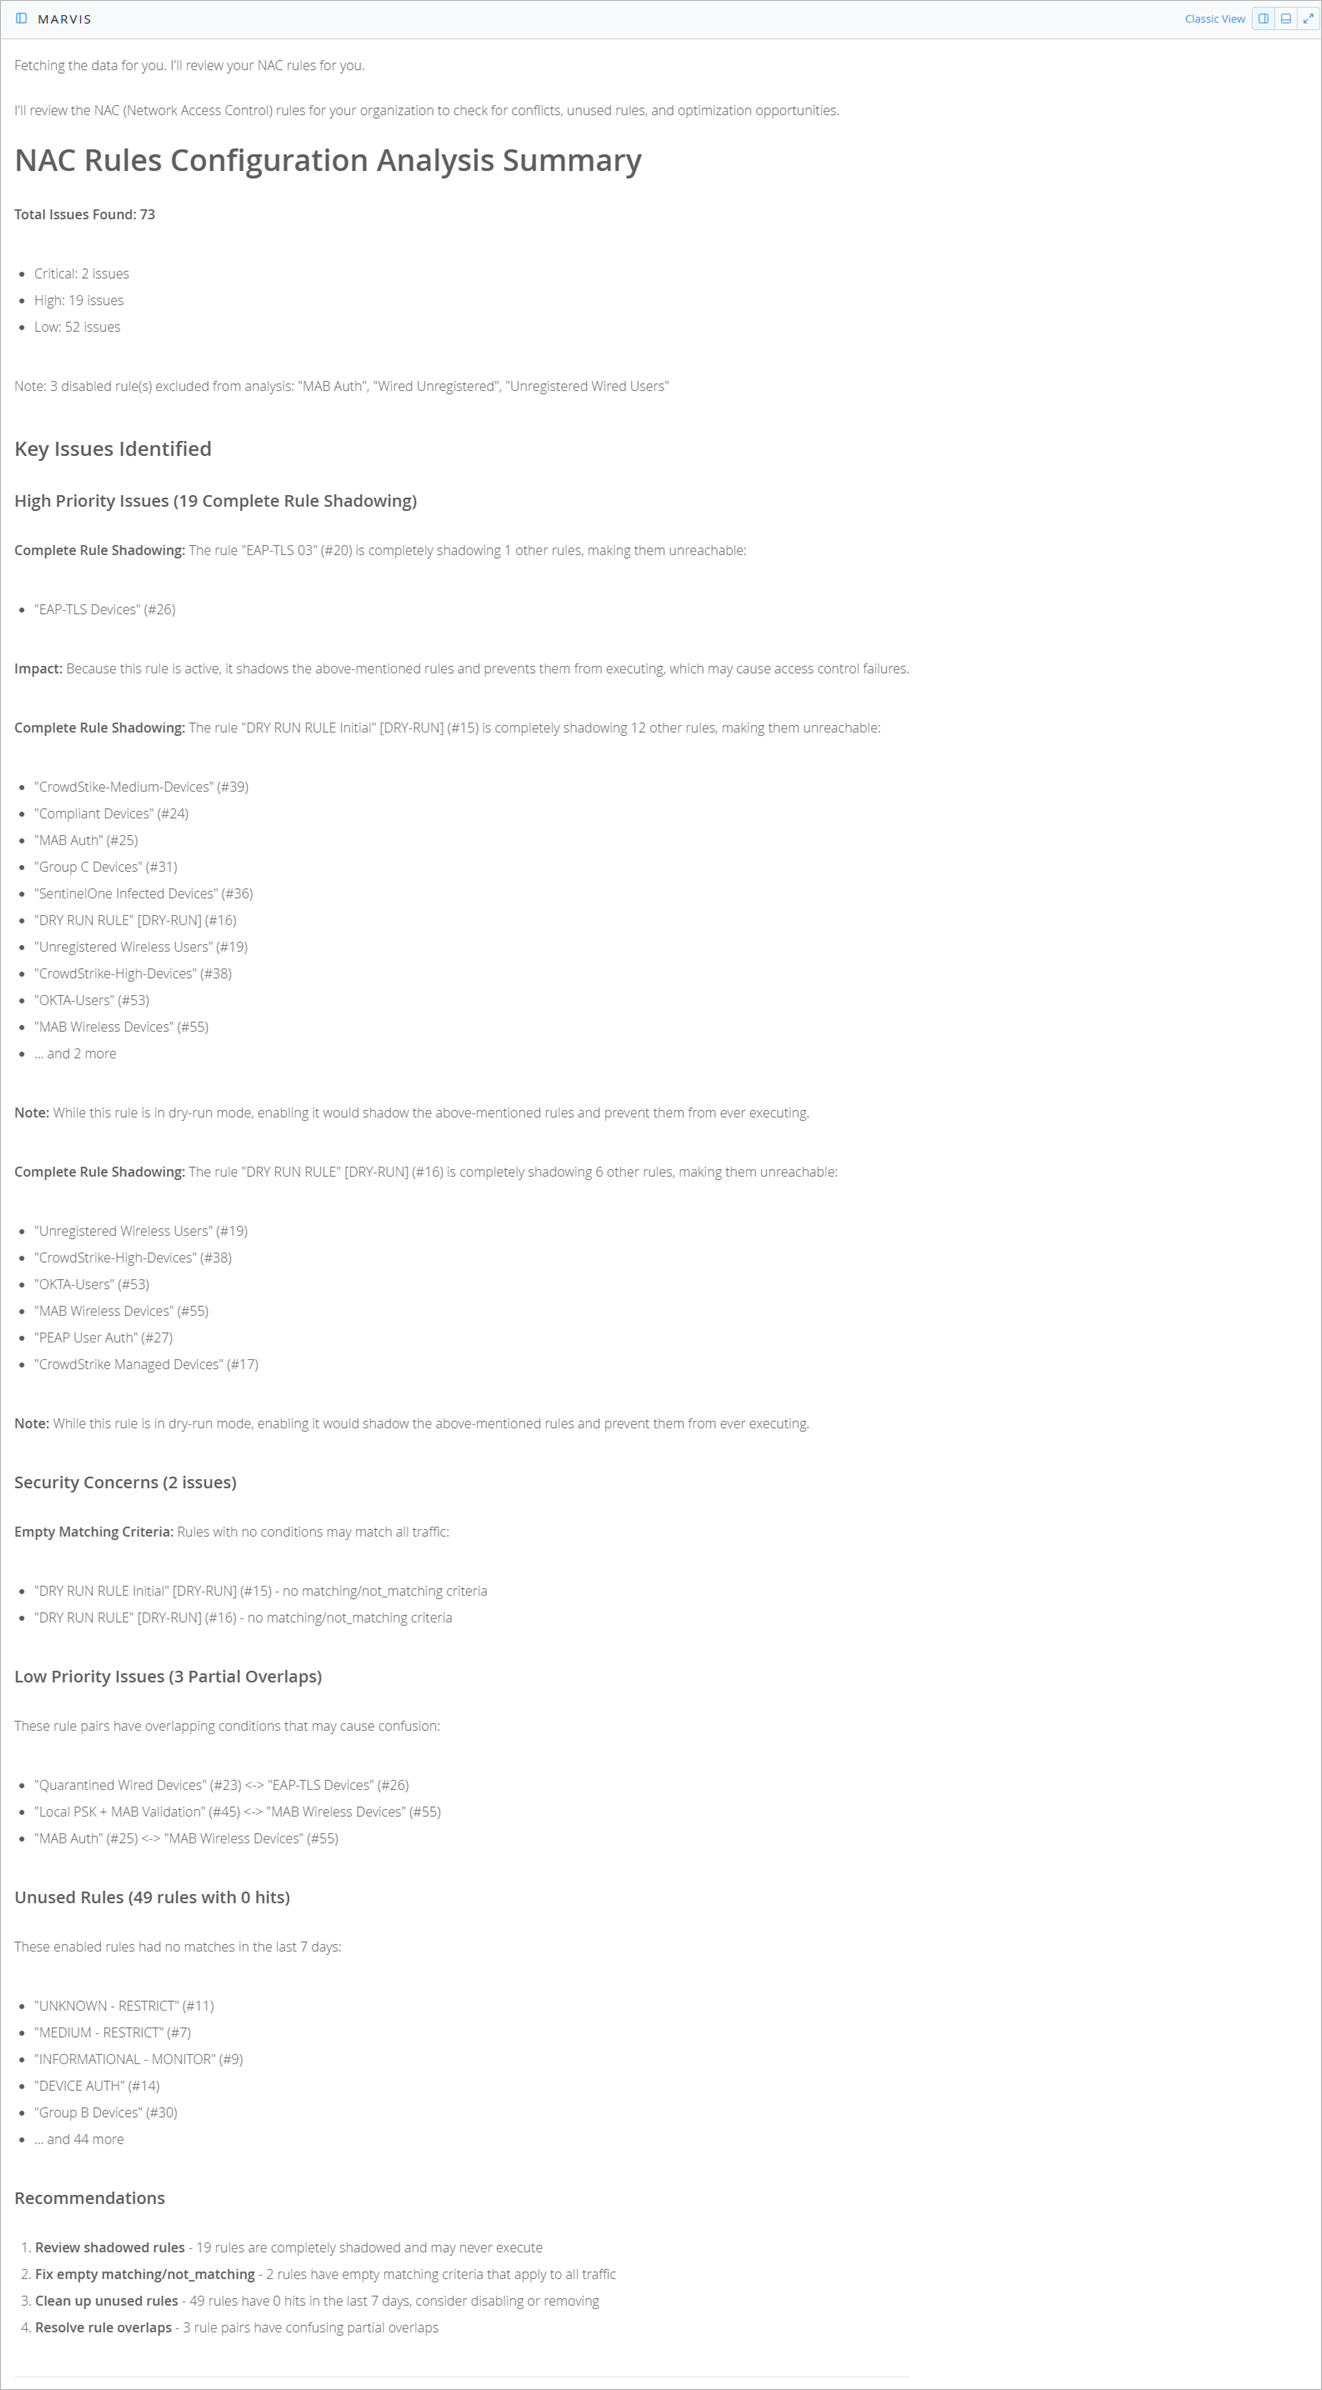
Verify if NAC rules are configured correctly
Prompt: Review NAC rules
-
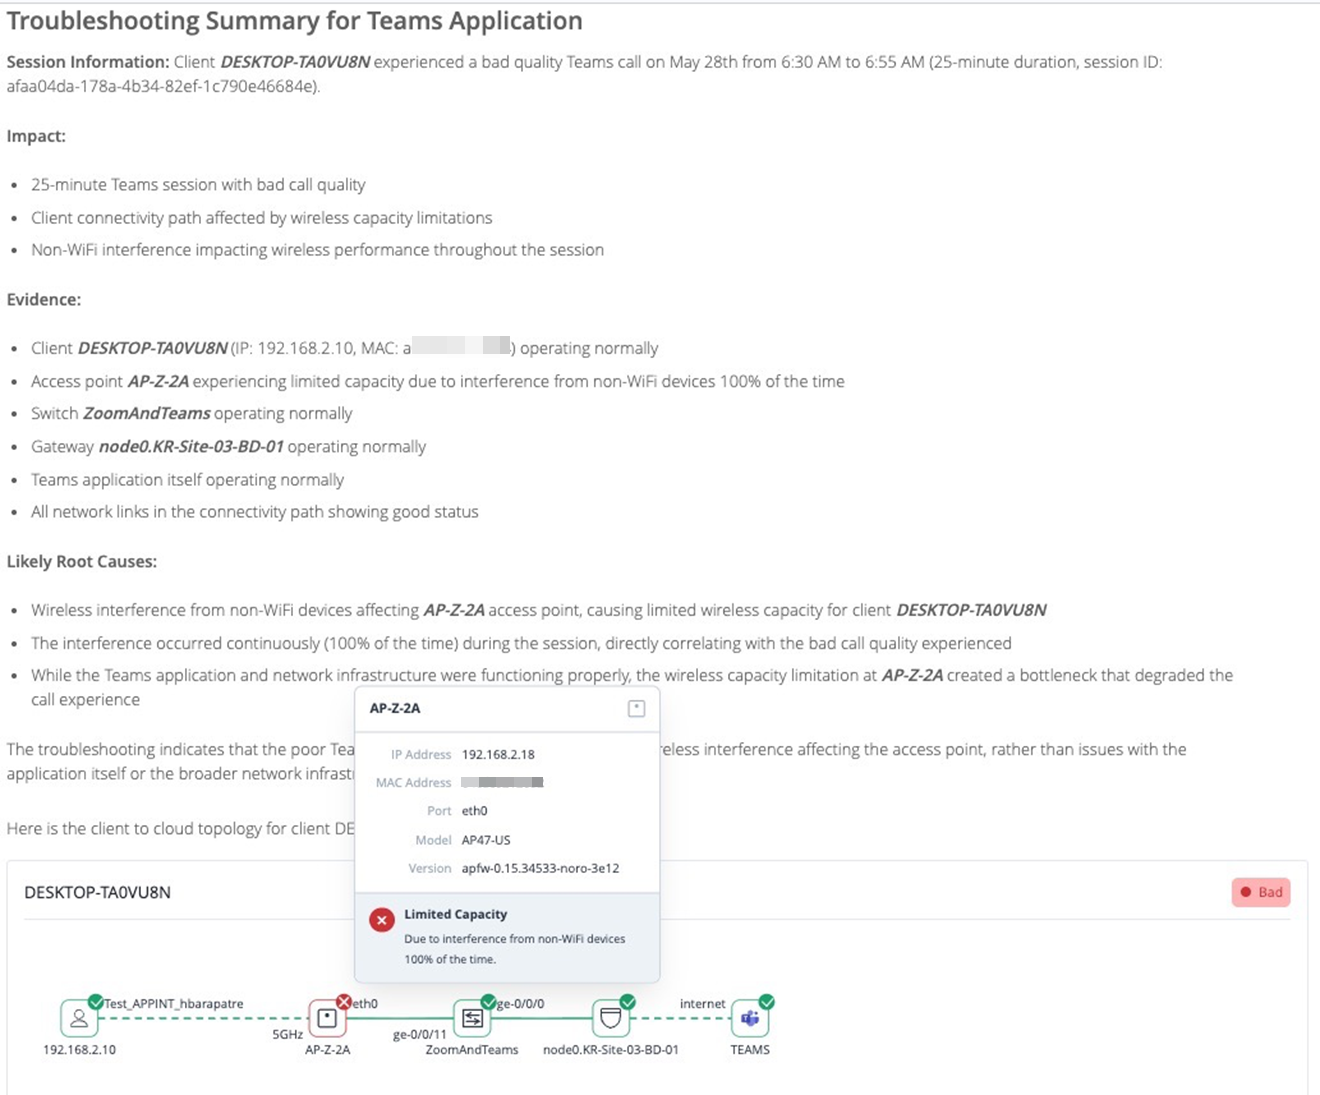
Troubleshoot Teams issues impacting a specific user.
Prompt: Troubleshoot application teams for client a0:xx:xx:ad:xx:e4 on May 28th