Monitoring Nodes in the Fabric

As an administrator or operator, you can use Junos Space to track the status of physical and logical components of deployed nodes in a fabric.

Junos Space Network Management Platform supports SNMP Monitoring by an SNMP Manager for SNMP v1, v2c, and v3.

The SNMP manager polls Junos Space to obtain information about the logical components of the nodes using an object identifier (OID) in SNMP v1 and v2, or v3 as a user. The response is provided by the Junos Space SNMP agent and the polled data is displayed in the Network Monitoring workspace.

This topic contains the following sections:

Viewing and Modifying the SNMP Configuration for a Fabric Node

To view and edit the Junos Space SNMP configuration for self-monitoring:

  1. Select Administration > Fabric.

    The Fabric page appears.

  2. Select the node whose configuration you want to view or modify, and from the Actions menu, select SNMP Configuration.

    The SNMP Configuration window appears with the title bar displaying the IP address of the selected node.

  3. Set the SNMP configuration parameters as required, using Table 1 to guide you.
    Note:

    By default, the system load parameters are set to 4, which means that an alert is indicated only when all CPUs are under 100 percent load.

    Table 1: SNMP Configuration

    Setting

    Explanation

    Recommended Settings

    Default Value

    Enable SNMP over TCP

    Enables SNMP communication over TCP

    Note:

    By default, SNMP communication occurs over UDP.

    Cleared

    Cleared

    Monitor Web Service

    Includes monitoring the performance of the Junos Space GUI

    Note:

    This parameter is enabled only for the Junos Space VIP node.

    Selected

    Selected

    Monitor All Disks

    Includes all disks on the current Junos Space server

    Cleared

    Cleared

    Monitor RAID

    Enables Net-SNMP to monitor the RAID state

    When a RAID controller fault is detected, a trap is sent.

    Note:

    From Junos Space Platform Release 16.1 onward, if you want to use the Monitor RAID option, you need to install StorMan-7.31-18856.x86_64.rpm . For installation instructions, see Installing StorMan RPM for Monitor RAID Functionality.

    Note:

    This field is not applicable to and is disabled for Junos Space Virtual Appliances.

    Selected

    Cleared

    Disk Usage %

    When the percentage of the disk in use exceeds the configured disk usage percentage, an alarm is triggered.

    5

    5

    System Load (1 min)

    When the average system load (over 1 minute) exceeds the configured value, an alarm is triggered.

    4

    4

    System Load (5 min)

    When the average system load (over 5 minutes) exceeds the configured value, an alarm is triggered.

    4

    4

    System Load (15 min)

    When the average system load (over 15 minutes) exceeds the configured value, an alarm is triggered.

    4

    4

    System Location

    Location of the fabric node

    Actual geographical or other location

    unknown

    System Contact

    E-mail address to which the system sends notifications

    E-mail address of actual person

    root <root@localhost>

    Disk Mount Path

    Disk mount path that is to be monitored

    Note:

    This field is disabled if the Monitor All Disks field is selected.

    Actual path, if available

    /

    CPU Max Temp (mC)

    When the temperature exceeds the configured value, an alarm is triggered.

    50000

    50000

    CPU Min Fan (RPM)

    When the CPU fan speed goes below the configured value, an alarm is triggered.

    1000

    1000

    CPU Min Voltage (mV)

    When the CPU voltage goes below the configured value, an alarm is triggered.

    1000

    1000

  4. Select Confirm to apply the SNMP configuration changes to the node, or select Cancel if you do not want to make any changes to the SNMP configuration.

Table 2 shows the configuration parameters for monitoring disk usage.

Table 2: SNMP Configuration Parameters: Monitoring Disk Usage

Monitoring Disk Usage

Parameter: Disk Usage (%)

Default: 5%

When the free disk space is greater than the configured threshold, the trap shown in Figure 1 is generated.

Figure 1: Disk Usage Threshold Is Normal System log entry showing ID 406, identifier space-000c29d796f5, count 1, timestamp 3/27/14 12:25:51, navigation buttons, and status Disk usage is normal.

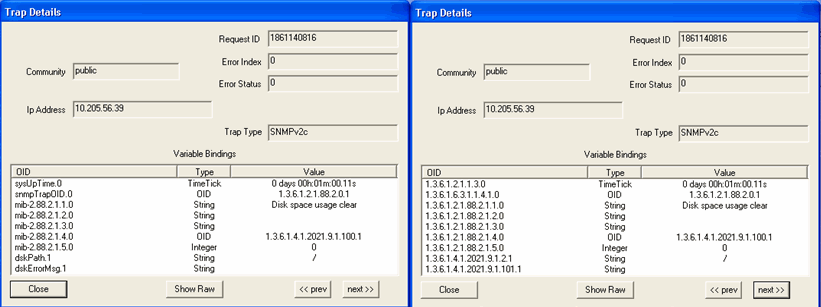
Figure 2 shows the OID details for the trap generated when disk usage is normal.

Figure 2: Trap Details When Disk Usage Normal SNMP trap details interface with Request ID, Community set to public, Error Index and Status 0, IP 10.205.56.39, SNMPv2c, and OIDs like sysUpTime and Disk space usage clear.
When the free disk space is less than the configured threshold, the trap shown in Figure 3 is generated.

Figure 3: Disk Usage Threshold Exceeds Configured Threshold Log entry 377 alerts disk space-000c29d796f5 exceeded limits with 63 percent free. Severity level 2 on March 27, 2014, at 11:59:48.

Figure 4 shows the OID details for the trap generated when disk usage exceeds the configured threshold.

Figure 4: Trap Details When DIsk Usage Exceeds Configured Threshold Trap Details window showing SNMP trap information: Request ID 1141303069, Community public, Error Index 0, Error Status 0, IP Address 10.205.56.39, Trap Type SNMPv2c, and Variable Bindings table with OID, Type, and Value. Includes disk space usage trigger message less than 90 percent free.
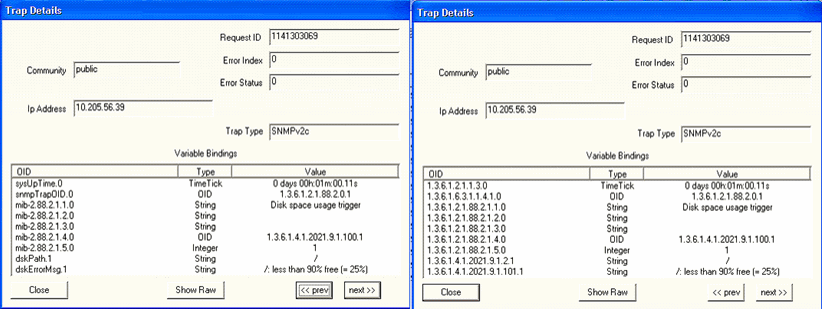
Table 3 shows the configuration parameters for monitoring the CPU load average.

Table 3: SNMP Configuration Parameters: Monitoring the CPU Load Average

Monitoring the CPU Load Average (System Load)

Parameter: CPU Load (1 min, 5 min, 15 min)

Default Threshold Value: 4

When the CPU Load Average threshold is less than or equal to the configured threshold limit, the trap shown in Figure 5 is generated:

Figure 5: CPU Load Average Threshold Is Normal Entry 379: space-000c29d796f5, count 1, logged at 3/27/14 12:00:48. Status: CPU load average is normal.

Figure 6 shows the OID details for the trap generated when the CPU load is normal.

Figure 6: Trap Details When CPU Load Average Threshold Is Normal Software interface showing SNMP Trap Details with Request ID, Community set to public, Error Index and Status at 0, IP Address 10.205.56.39, Trap Type SNMPv2c, and Variable Bindings with OIDs and values. Two panels differ in Variable Bindings, left includes CPU LA clear and Load=15, right includes Load=15. Used for network monitoring.
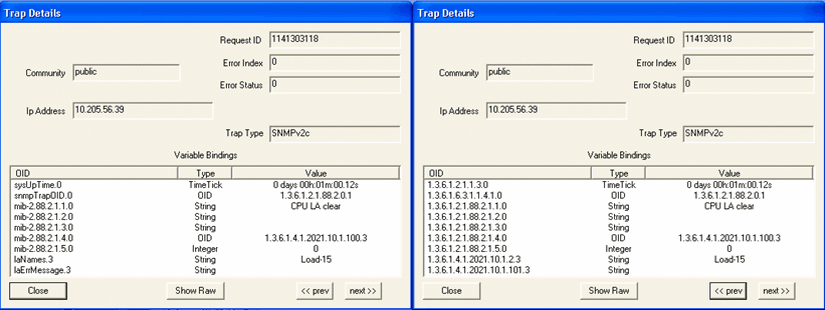
Figure 7 shows the traps generated when the 15 minute, 5 minute, or 1 minute CPU Load Average threshold is exceeded.

Figure 7: CPU Load Average Threshold – Upper Limit Exceeded Monitoring interface showing alerts for exceeded CPU load thresholds with alert IDs, space names, severity levels, timestamps, and descriptions.

Figure 8 shows the OID details for the trap generated when the CPU load 5 minute average exceeds the threshold.

Figure 8: Trap Details When CPU Load 5 Minute Average Exceeds Threshold Two Trap Details windows from a network management system using SNMP displaying performance alerts with system metrics like uptime and a 5 min Load Average too high message.
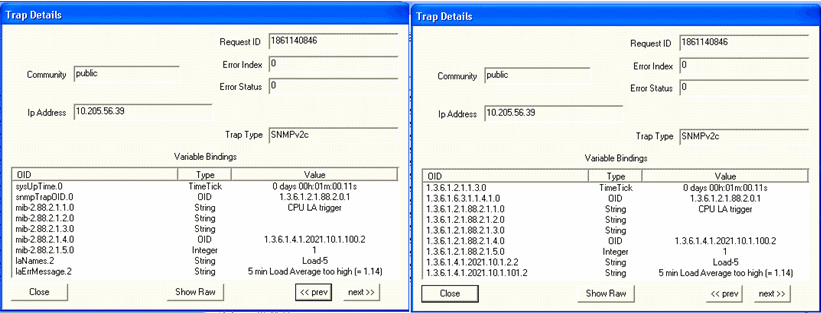
Table 4 shows monitoring processes for the Junos Space Network Management Platform.

Table 4: SNMP Configuration Parameters: Monitoring Processes

Monitoring Processes

Parameter: Node Management Agent (NMA)

When the NMA process is up, the trap shown in Figure 9 is generated:

Figure 9: NMA Is Up Process log entry with ID 384 shows process NMA started on 3/27/14 at 12:10:05 with navigation options.

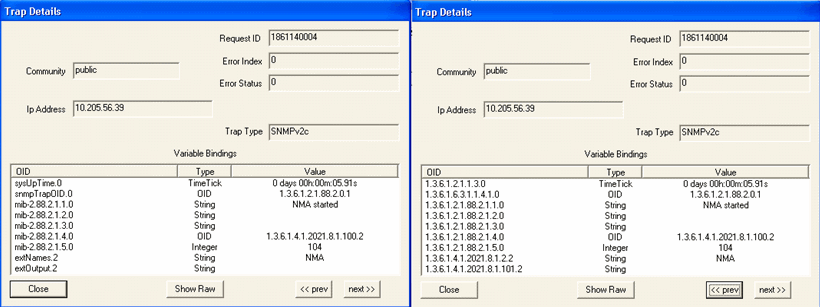
Figure 10 shows the OID details for the trap generated when the NMA process is up.

Figure 10: Trap Details When NMA Is Up SNMP trap details with trap type SNMPv2c from IP 10.205.56.39. Fields include Request ID, Community, Error Status, and Variable Bindings with OIDs and values.
When the NMA process is down, the trap shown in Figure 11 is generated:

Figure 11: NMA is Down Row 382: Identifier space:000c29d796f5; Count 1; Timestamp 3/27/14 12:09:25; Message Process NMA stopped; Red background indicates error or warning.

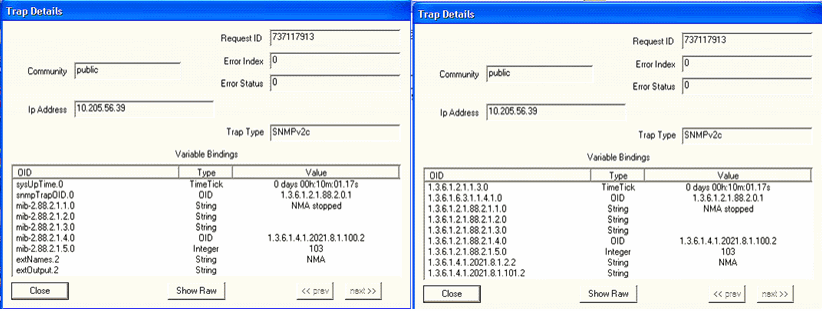
Figure 12 shows the OID details for the trap generated when the NMA process is down.

Figure 12: Trap Details When NMA is Down Network monitoring tool screenshots showing SNMP trap details: Trap Details window with Request ID 737117913, Community public, IP 10.205.56.39, SNMP version SNMPv2c, Error Index and Status 0. Variable Bindings table includes sysUpTime, OID values, Type, and Value with examples NMA stopped and 103.
Parameter: Webproxy

When the WebProxy process is up, the trap shown in Figure 13 is generated:

Figure 13: WebProxy Is Up System log entry with ID 390: space-000c29d79ef5 at 3/27/14 12:12:55. WebProxy process started.

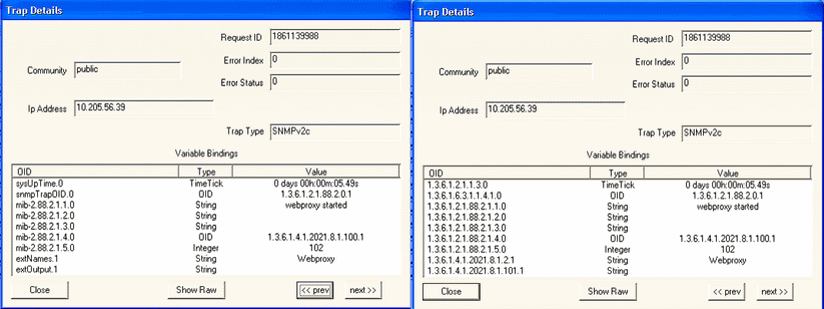
Figure 14 shows the OID details for the trap generated when the WebProxy process is up.

Figure 14: Trap Details When WebProxy Is Up Screenshots of SNMP trap details showing Request ID 1861139988, Community public, IP 10.205.56.39, Trap Type SNMPv2c, indicating a web proxy start event.
When the WebProxy process is down, the trap shown in Figure 15 is generated:

Figure 15: WebProxy Is Down ID 386, space-000c29d796f5, status 1, timestamp 3/27/14 12:12:24, message Process WebProxy stopped, red background indicates an error or warning.

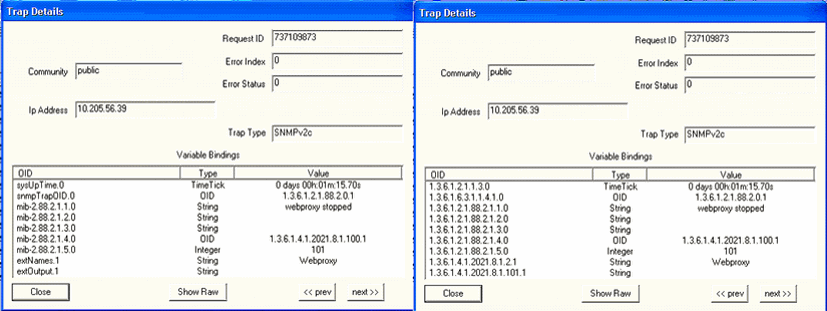
Figure 16 shows the OID details for the trap generated when the WebProxy is down.

Figure 16: Trap Details When WebProxy Is Down SNMP monitoring tool showing two panels with SNMPv2 trap details from IP 10.205.56.39. Both panels share Request ID 737109873, Community public, Error Index and Status 0, and Trap Type SNMPv2c. Variable Bindings include OIDs, data types, and values like webproxy stopped, 101, and Webproxy. Left panel uses symbolic names; right panel uses numeric OIDs.
Parameter: JBoss

When the JBoss process is up, the trap shown in Figure 17 is generated:

Figure 17: JBoss Is Up Log entry with checkbox 394, ID space-000c29d79ef5, count 1, timestamp 3/27/14 12:14:46, status Process Jboss started.

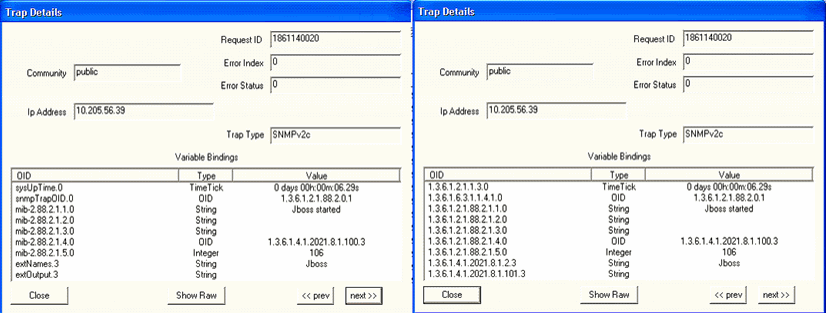
Figure 18 shows the OID details for the trap generated when the JBoss process is up.

Figure 18: Trap Details When JBoss Is Up SNMP Trap Details interface with Request ID 1861140020, community string public, no errors, source IP 10.205.56.39, SNMPv2c, and variable bindings with OIDs. Two panels show simplified and full numeric OIDs.
When the JBoss process is down, the trap shown in Figure 19 is generated:

Figure 19: JBoss Is Down Log entry with ID 391: Process space-000c29d796f5 stopped. Timestamp: 3/27/14 12:13:01. Background color suggests alert.

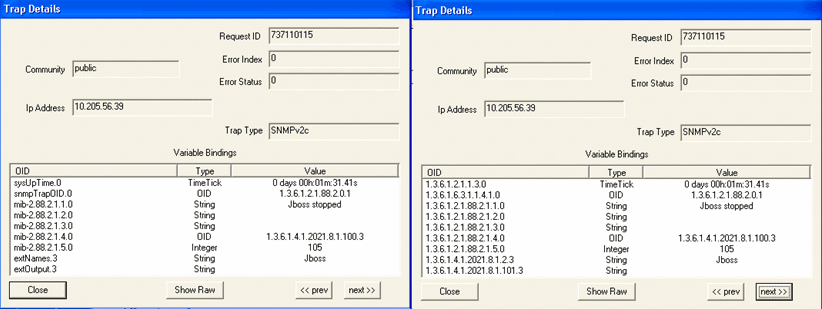
Figure 20 shows the OID details for the trap generated when JBoss is down.

Figure 20: Trap Details When JBoss Is Down Trap Details window showing SNMP trap information including Request ID 737110115, Community public, Error Index and Status 0, IP Address 10.205.56.39, Trap Type SNMPv2c, and Variable Bindings with OIDs like sysUpTime.0 and snmpTrapOID.0.
Parameter: Mysql

When the Mysql process is up, the trap shown in Figure 21 is generated:

Figure 21: Mysql Is Up Log entry showing MySQL process started on 3/27/14 at 12:13:07 with ID space-000c29d796f5 and number 392.

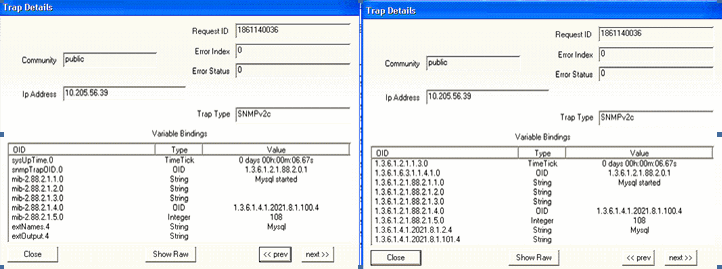
Figure 22 shows the OID details for the trap generated when the Mysql process is up.

Figure 22: Trap Details When Mysql Is Up Network monitoring tool with SNMP trap details: Trap Details Window showing Request ID, Community, Error Index, Error Status, IP Address, Trap Type, and Variable Bindings with OIDs, types, and values.
When the Mysql process is down, the trap shown in Figure 23 is generated:

Figure 23: Mysql Is Down Log entry 398 shows space-000c29d796f5 with status 1 at 3/27/14 12:21:44. MySQL process stopped, red background indicates critical event.

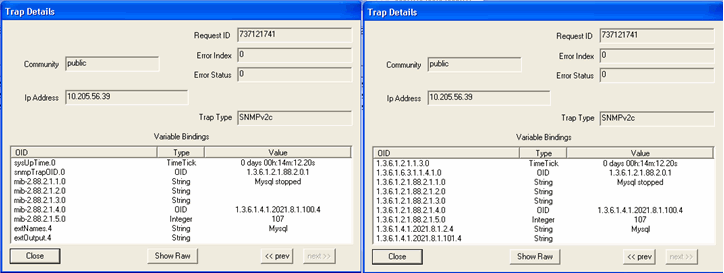
Figure 24 shows the OID details for the trap generated when the Mysql process is down.

Figure 24: Trap Details When Mysql Is Down Screenshots of SNMP monitoring tool showing Trap Details with Request ID 73712741, Community public, no errors, IP 10.205.56.39, Trap Type SNMPv2c, and OIDs with values like MySQL stopped.
Parameter: Postgresql

When the Postgresql process is up, the trap shown in Figure 25 is generated:

Figure 25: Postgresql Is Up Log entry showing row 393, identifier space-000c29d796f5, count 1, timestamp 3/27/14 12:13:48, and message Process Postgresql started.

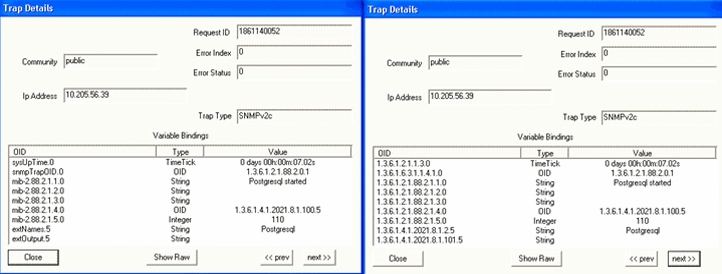
Figure 26 shows the OID details for the trap generated when the Postgresql process is up.

Figure 26: Trap Details When Postgresql Is Up Screenshots of a network monitoring tool displaying SNMP trap details with request ID, community as public, no errors, source IP 10.205.56.39, SNMPv2c trap type, OIDs with values like PostgreSQL started, and navigation buttons for traps.
When the Postgresql process is down, the trap shown in Figure 27 is generated:

Figure 27: Postgresql Is Down Log entry 389: Resource space-000c29d796f5, status 1, timestamp 3/27/14 12:12:53. Process Postgresql stopped.

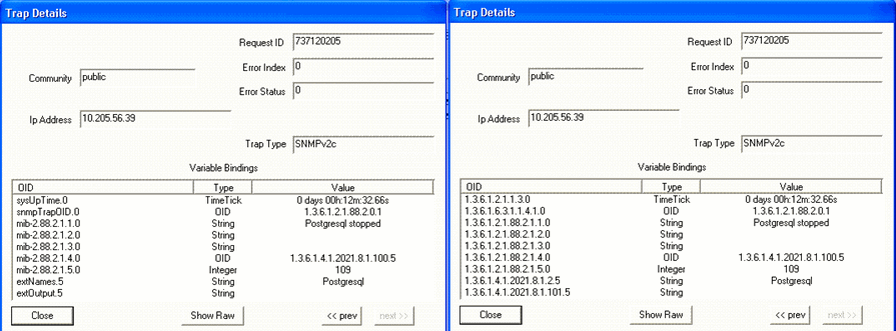
Figure 28 shows the OID details for the trap generated when the Postgresql process is up.

Figure 28: Trap Details When Postgresql Is Down Two panels of SNMP monitoring showing trap details: Request ID 737120205, SNMP community public, no errors, IP 10.205.56.39, SNMPv2c version. Variable bindings include system uptime and PostgreSQL stopped status.
Parameter: Free swap memory

When the free swap memory is greater than the upper threshold limit, the trap shown in Figure 29 is generated:

Figure 29: Swap Memory Usage Is Normal System monitoring log entry 405 with resource ID space-000c29d796f5, timestamp 3/27/14 12:28:43, and status message Swap memory usage is normal.

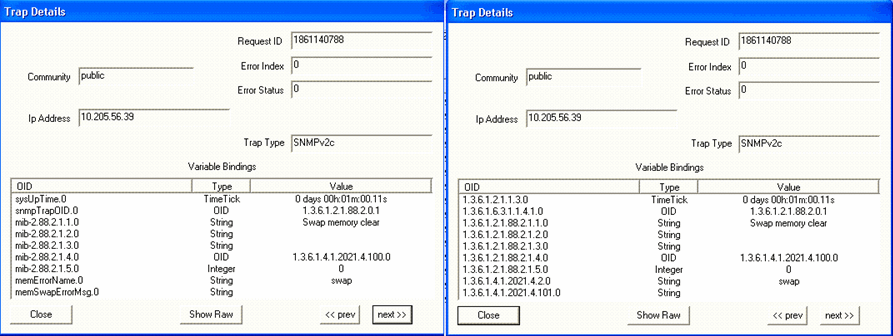
Figure 30 shows the OID details for the trap generated when swap memory usage is normal.

Figure 30: Trap Details When Swap Memory Is Normal Two panels of a software interface labeled Trap Details for SNMP traps. Key elements: Request ID, Community set to public, Error Index and Status at 0, IP Address 10.205.56.39, Trap Type SNMPv2c. Variable Bindings table with OIDs and values; left panel shows Swap memory clear, right panel shows different OID structure. Used for network monitoring.
When the free swap memory is less than the upper threshold limit, the trap shown in Figure 31 is generated:

Figure 31: Swap Memory Usage Threshold Exceeds Upper Limit Alert log entry: Critical issue with swap memory usage on space-000c29d796f5 ID 410. Threshold exceeded, running low on swap space.

Figure 32 shows the OID details for the trap generated when swap memory usage is exceeds upper limit.

Figure 32: Trap Details When Swap Memory Usage Exceeds Upper Limit SNMP trap details showing Request ID, community string, error index, error status, source IP address, trap type, and variable bindings with OIDs like sysUpTime.0 and memSwapErrorMsg.0 indicating system uptime and a memory swap error message about running out of swap space.
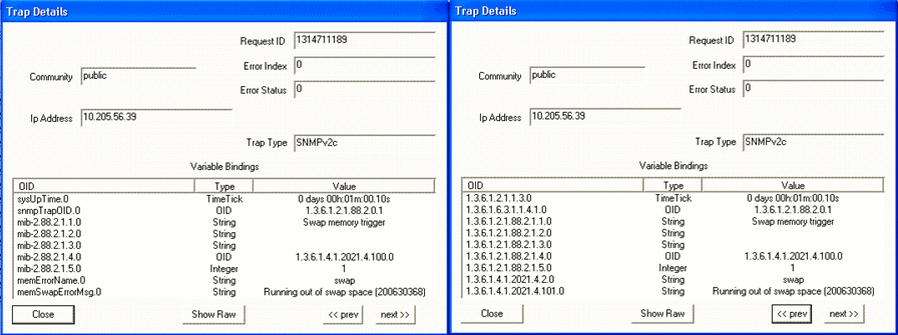
Table 5 shows the configuration parameters for monitoring Junos Space Network Management Platform hardware.

Table 5: SNMP Configuration Parameters: Monitoring Linux Hardware

Monitoring Linux Hardware

Note:

LM-SENSORS-MIB is not supported by the Junos Space Virtual Appliance, but only by the Junos Space Appliance. Therefore the threshold settings of CPU Max Temp (mC), CPU Min Fan (RPM) and CPU Min Voltage (mV) will not trigger any traps in the virtual appliance.

Parameter: CPU min FAN (rpm)

Default Threshold Value: 1500

When the CPU fan speed is greater than the configured threshold (minimum fan speed), the trap shown in Figure 33 is generated:

Figure 33: CPU Fan Speed Normal Log entry: Row 41, identifier space-025610201100007, value 1, timestamp 3/27/14 12:44:58, status CPU fan is normal.

Figure 34 shows the OID details for the trap generated when CPU fan speed is normal.

Figure 34: Trap Details When CPU Fan Speed Is Normal Screenshots of SNMP Trap Details window with Request ID, Community as public, IP 10.205.56.39, using SNMPv2c. Left: variable bindings for CPU fan clear. Right: similar data with varied OIDs and values.
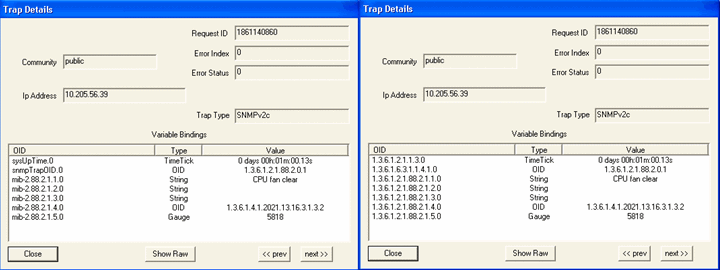
When the CPU fan speed is less than the configured threshold (minimum fan speed), the trap shown in Figure 35 is generated:

Figure 35: CPU Fan Speed Is Below the Configured Threshold Log entry with row number 280 reporting CPU fan speed issue. Identifier space-025604201200014. Timestamp 3/28/14 12:33:16. RPM 5625.

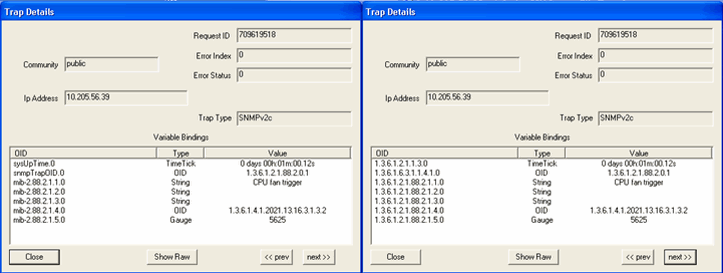
Figure 36 shows the OID details for the trap generated when CPU fan speed lower than the configured threshold.

Figure 36: Trap Details When CPU Fan Speed Is Below the Configured Threshold Trap Details window displays SNMP trap info: Request ID, Community, Error Index, Error Status, IP 10.205.56.39, SNMPv2c, Variable Bindings with OIDs and metrics.
Parameter: CPU min Voltage (mV)

When the CPU voltage is greater than the configured value, the trap shown in Figure 37 is generated:

Figure 37: CPU Voltage Normal Log entry 42 from space-0256102011000007 on 3/27/14 12:44:58. Status: CPU voltage is normal.

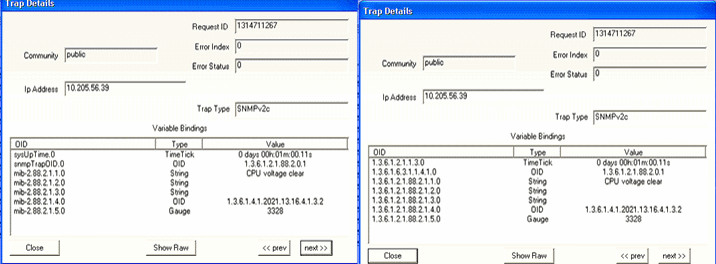
Figure 38 shows the OID details for the trap generated when CPU voltage is normal.

Figure 38: Trap Details When CPU Voltage Is Normal Two screenshots of Trap Details windows displaying SNMP trap info; Request ID 1314711267, Community public, Error Index 0, Error Status 0, IP 10.205.56.39, Trap Type SNMPv2c, and Variable Bindings table with OIDs, Types, and Values like CPU voltage clear.
Default Threshold Value: 1000

When the CPU voltage is lower than the configured value, the trap shown in Figure 39 is generated:

Figure 39: CPU Voltage Is Lower Than Configured Threshold CPU voltage issue log entry with ID 60 space identifier space-025610201100007 date 3/27/14 time 12:58:20 voltage 3328 mV.

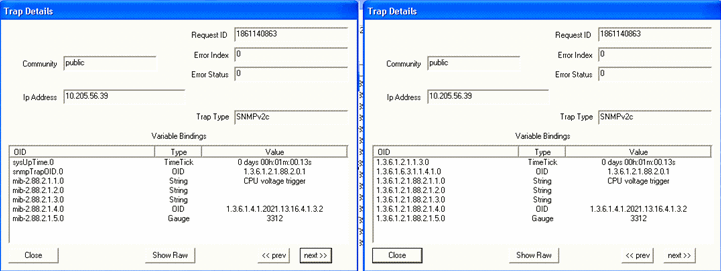
Figure 40 shows the OID details for the trap generated when CPU voltage is lower than the configured threshold.

Figure 40: Trap Details When CPU Voltage Is Lower Than Configured Threshold Trap Details interface for SNMP traps showing Request ID, Community, Error Index, Error Status, IP Address, Trap Type SNMPv2c, and Variable Bindings table with OIDs, types, and values. Includes navigation buttons for viewing raw data.
Parameter: CPU Temperature

When the CPU temperature is lower than the configured threshold, the trap shown in Figure 41 is generated:

Figure 41: CPU Temperature Normal Table showing checkbox, number 260, string space-0256042012000014, number 4, date 3/28/14 12:33:16, message CPU temperature is normal.

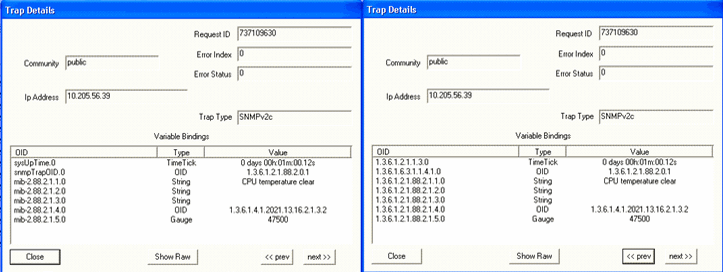
Figure 42 shows the OID details for the trap generated when CPU temperature is normal.

Figure 42: Trap Details When CPU Temperature Is Normal Trap Details window showing SNMP traps with fields: Request ID 737109630, Community public, Error Index 0, Error Status 0, IP Address 10.205.56.39, and Trap Type SNMPv2c. Variable Bindings include sysUpTime.0 and CPU temperature clear. Navigation buttons: prev, next, and Show Raw.
When the CPU temperature exceeds the configured threshold, the trap shown in Figure 43 is generated:

Figure 43: CPU Temperature Exceeds The Configured Threshold Log entry alert: ID 40, Space ID space-025610201100007, CPU temperature too high at 51 degrees Celsius, Timestamp 3/27/14 12:44:58.

Figure 44 shows the OID details for the trap generated when CPU temperature is higher than the configured threshold.

Figure 44: Trap Details When CPU Temperature Exceeds The Configured Threshold Two software windows display SNMP trap details, including request ID, community string public, error index and status 0, IP 10.205.56.39, SNMPv2c version, and variable bindings. Navigation options include prev, next, and show raw.
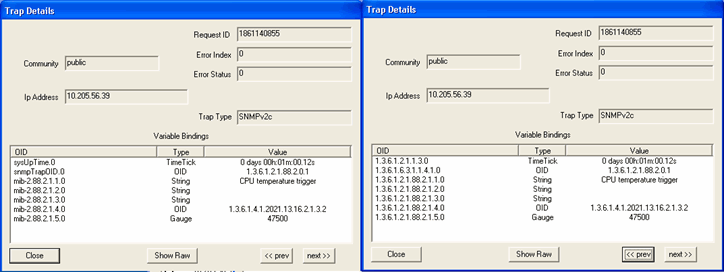
Table 6 shows the configuration parameters for monitoring fabric health.

Table 6: SNMP Configuration Parameters: Monitoring Fabric Health
Monitoring Fabric Health

Parameter: Junos Space Node

When a Junos Space node is up, the trap shown in Figure 45 is generated:

Figure 45: Junos Space Node is Up Checkbox for selection, ID 642, Node: space-000c294ed8bc, Status: 1, Timestamp: 6/14/17 19:54:41, Description: Node operational.

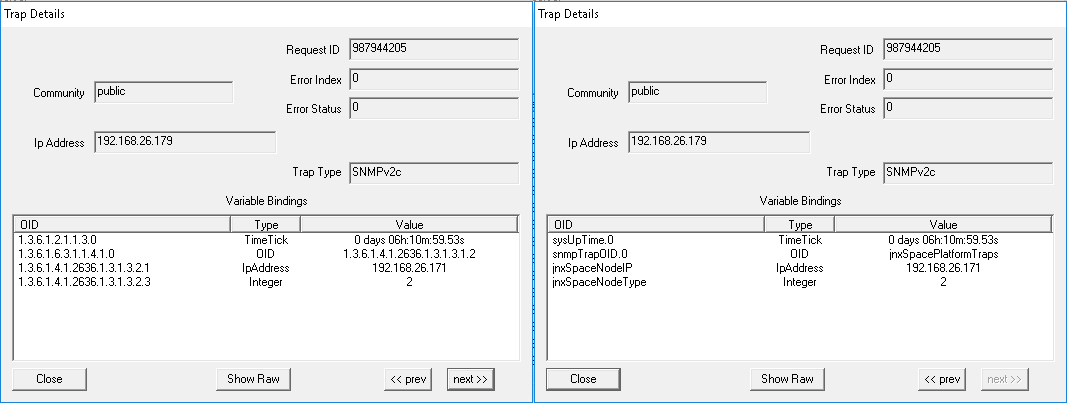
Figure 46 shows the OID details for the trap generated when a Junos Space node is up.

Figure 46: Trap Details When Junos Space Node Is Up SNMP trap details interface with two panels showing Request ID 987944205, IP 192.168.26.179, Trap Type SNMPv2c, and Variable Bindings.
When a Junos Space node is down, the trap shown in Figure 47 is generated:

Figure 47: Junos Space Node is Down Log entry showing status code 204 for space-000c295d757a. Timestamp 6/23/17 22:45:29. Message: The space node referred by jnxSpaceNodeIP is currently down.

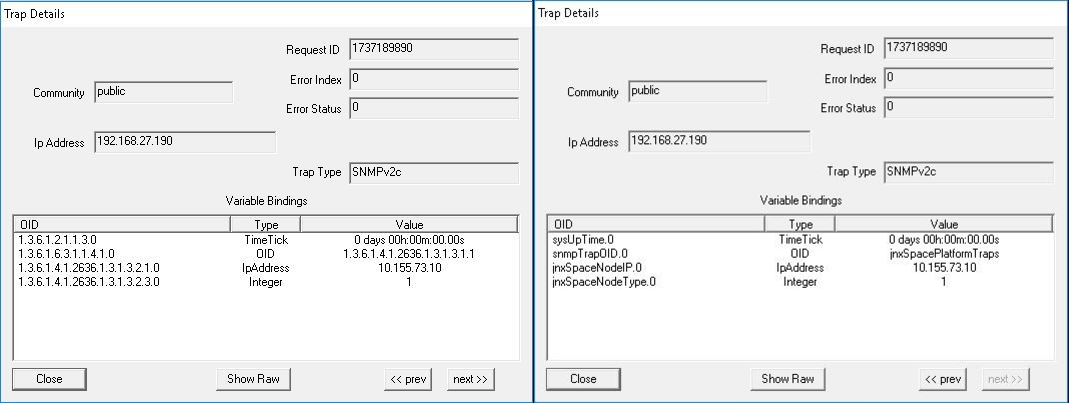
Figure 48 shows the OID details for the trap generated when a Junos Space node is down.

Figure 48: Trap Details When Junos Space Node is Down SNMP trap details with Request ID 1737189890 from IP 192.168.27.190 using SNMPv2c. Variable bindings include sysUpTime at 0 days, snmpTrapOID as jnxSpacePlatformTraps, node IP 10.155.73.10, and node type 1.
Parameter: Junos Space Node Removal

When a Junos Space node is removed from the fabric, the trap shown in Figure 49 is generated:

Figure 49: Junos Space Node Is Removed System log entry with ID 1076 shows space-000c2990f597 removed from fabric at 6/21/17 15:33:04.

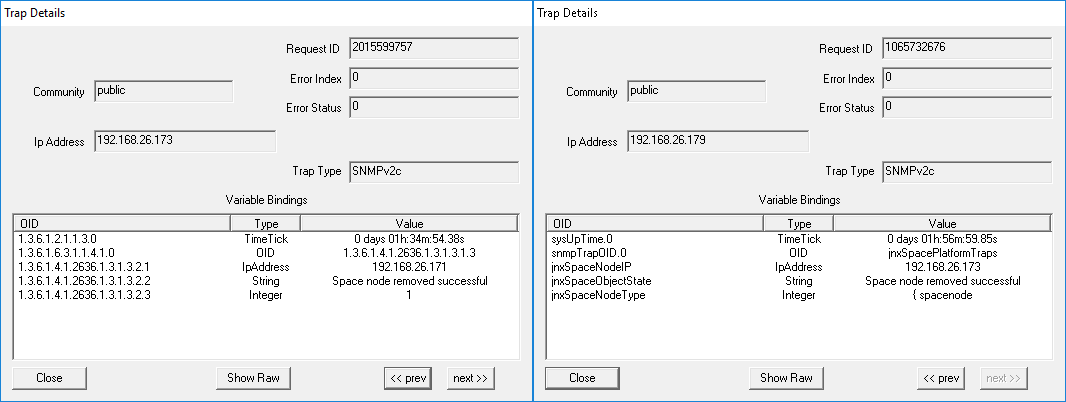
Figure 50 shows the OID details for the trap generated when a Junos Space node is removed..

Figure 50: Trap Details When Junos Space Node Is Removed SNMP trap details show successful removal of space nodes from IPs 192.168.26.173 and 192.168.26.179 with uptime and OID info.
Parameter: JBoss Multi-Primary Detected

When there is more than one JBoss AppLogic primary node detected in the cluster, the trap shown in Figure 51 is generated:

Figure 51: JBoss Multi-Primary Detected ID 846: Multi-master issue observed in cluster on 6/15/17 at 14:58:43.

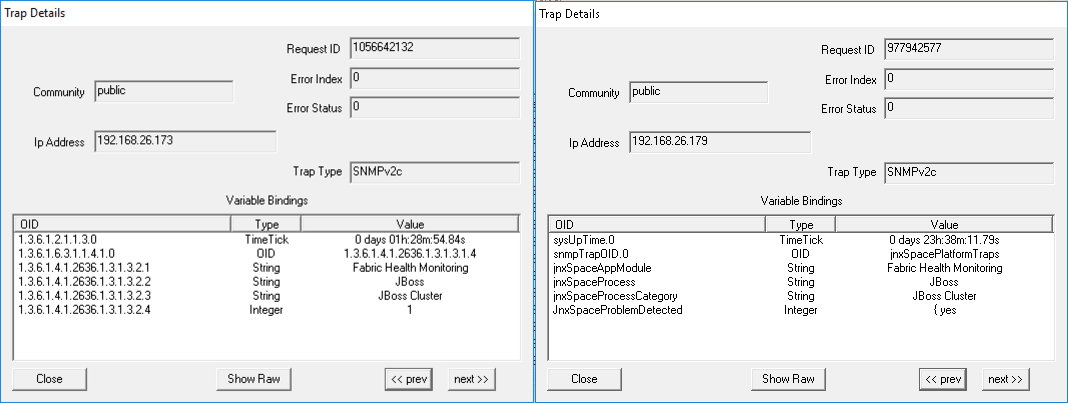
Figure 52 shows the OID details for the trap generated when there is more than one JBoss AppLogic primary node detected in the cluster.

Figure 52: Trap Details When JBoss Multi-Primary Is Detected Two SNMP Trap Details windows showing request IDs, community set to public, source IPs 192.168.26.173 and 192.168.26.179, SNMPv2c trap type, and variable bindings with OIDs and values.
Parameter: VIP Bind Issue Detected in JBoss Node(s)

When VIP Bind issue is detected in JBoss node(s), the trap shown in Figure 53 is generated:

Figure 53: VIP Bind Issue Detected In JBoss Node(s) Checkbox, number 217, code space-000:294edb9c, number 7, date 6/14/17 14:58:18, message VIP bind issue detected in Jboss nodes.

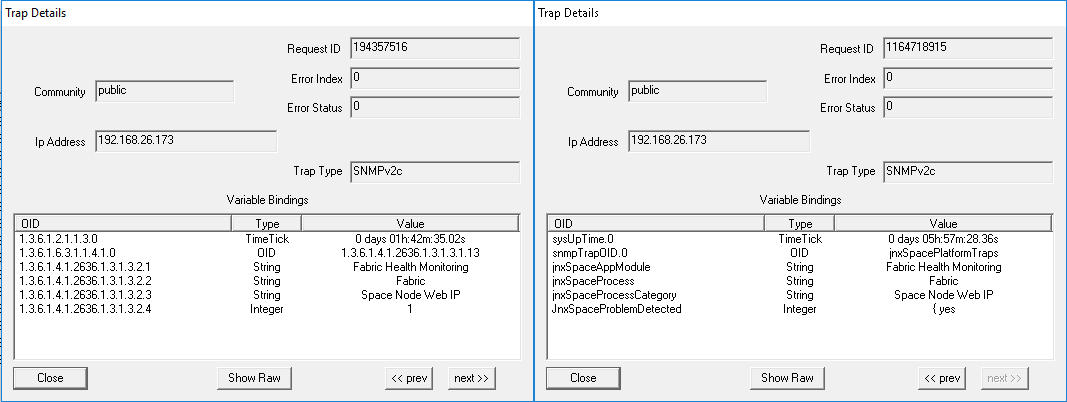
Figure 54 shows the OID details for the trap generated when VIP Bind issue is detected in JBoss node(s).

Figure 54: Trap Details When VIP Bind Issue Is Detected In JBoss Node(s) SNMP trap details from device 192.168.26.173 with SNMPv2c. Request IDs 194357516 and 1164718915. OIDs report TimeTick and Fabric Health Monitoring.
Parameter: Fabric Monitoring Process Inactive

When fabric monitoring process is inactive, the trap shown in Figure 55 is generated:

Figure 55: Fabric Monitoring Process Inactive Log entry: ID 706, space-000c29555936, status 1, timestamp 6/20/17 18:59:08, message Fabric monitoring process inactive for node jb1.

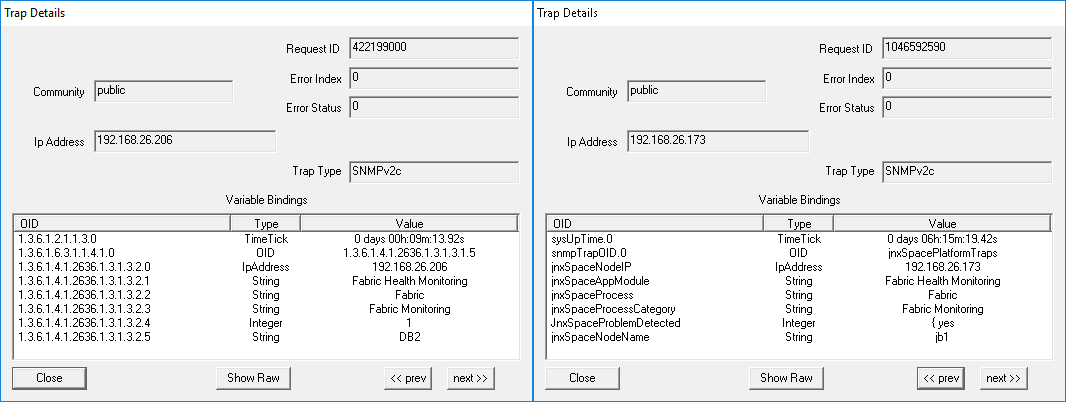
Figure 56 shows the OID details for the trap generated when fabric monitoring process is inactive.

Figure 56: Trap Details When Fabric Monitoring Process Is Inactive SNMP Trap Details showing two panels with request IDs, public community, IPs 192.168.26.206 and 192.168.26.173, SNMPv2c, and variable bindings.
Parameter: Tables Exceed Size Limit

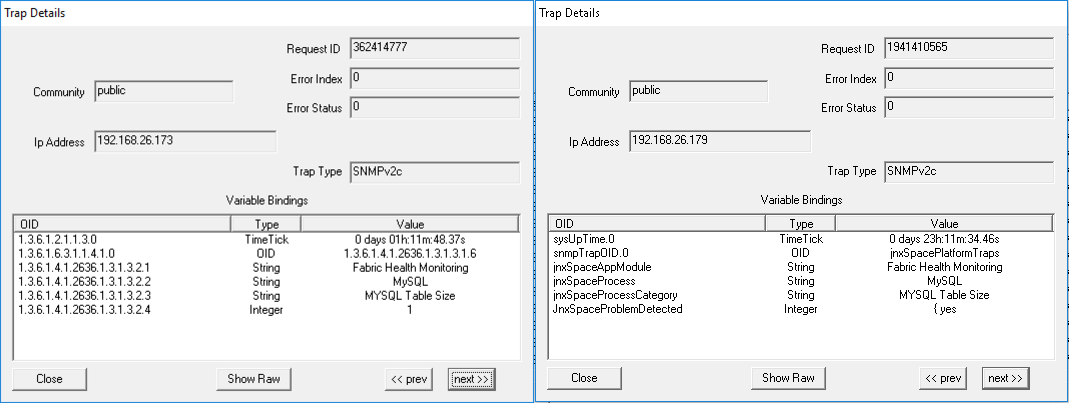
When one or more tables in the MySQL database exceed the size limit of 10 GB, the trap shown in Figure 57 is generated:

Figure 57: Tables Exceed Size Limit Checkbox for selecting row, ID 838, space-000c294ed8bc, count 1, timestamp 6/15/17 14:41:36, warning about database table size exceeding 10GB.

Figure 58 shows the OID details for the trap generated when one or more tables in the MySQL database exceed the size limit of 10 GB.

Figure 58: Trap Details When Tables Exceed Size Limit SNMP trap details for two devices: Left panel - IP 192.168.26.173, Request ID 362414777, event Fabric Health Monitoring, MySQL; Right panel - IP 192.168.26.179, Request ID 1941410555, event Fabric Health Monitoring, MySQL.
Parameter: Device Session Count Exceeds Threshold Limit

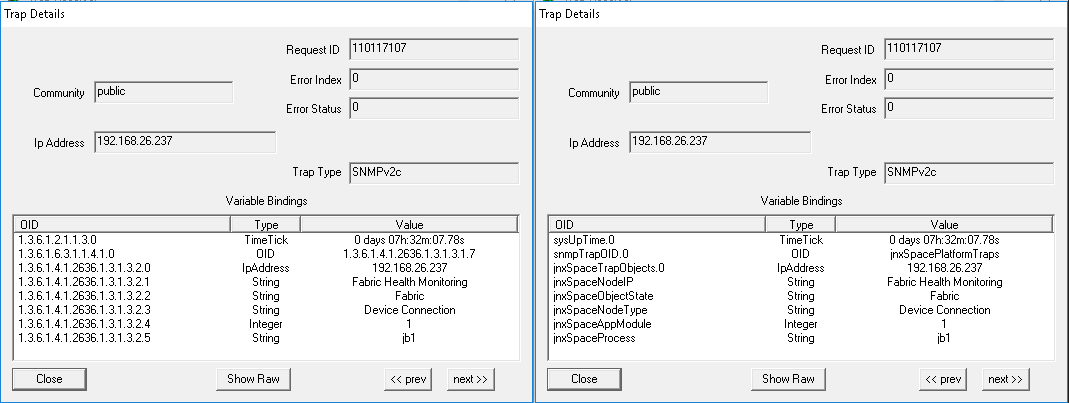
When the device session count exceeds the threshold limit, the trap shown in Figure 59 is generated:

Figure 59: Device Session Count Exceeds Threshold Limit Entry 844 with checkbox shows space-00c29118aa47, count 1, timestamp 6/15/17 14:58:26, alert for session threshold in node jb2.

Figure 60 shows the OID details for the trap generated when the device session count exceeds the threshold limit.

Figure 60: Trap Details When Device Session Count Exceeds Threshold Limit Two SNMP Trap Details panels showing network trap info: Request ID 110171107, Community public, IP Address 192.168.26.237, Trap Type SNMPv2c, Error Index 0, Error Status 0. Variable Bindings list OIDs, data types, and values for Fabric Health Monitoring and Device Connection.
Parameter: HPROF Availability

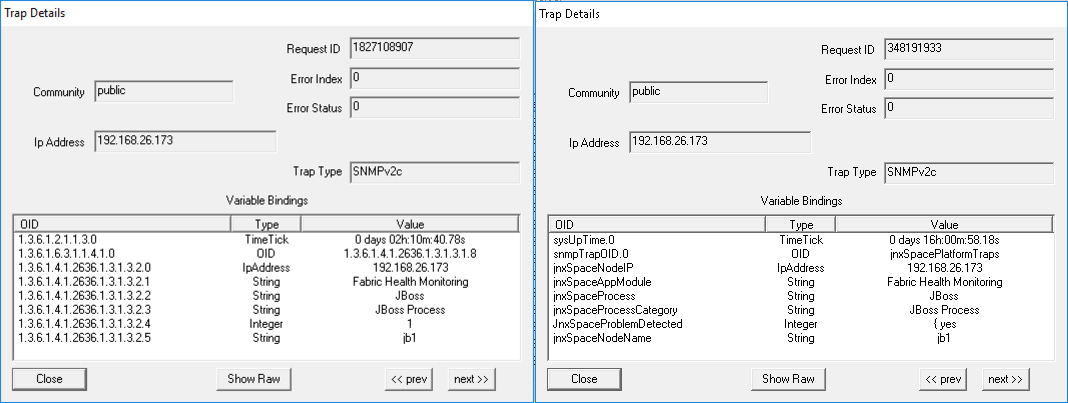
When Heap and CPU Profiling Agent (HPROF) files are detected on a Junos Space node, the trap shown in Figure 61 is generated:

Figure 61: HPROF Availability Event log entry: Warning detected on 6/15/17 from source space-000c294ed8bc IP 192.168.26.173 related to JBoss Hprof.

Figure 62 shows the OID details for the trap generated when HPROF files are detected on a Junos Space node.

Figure 62: Trap Details When HPROF Files Are Available SNMP trap details displayed in two panels showing request ID, community string public, IP address 192.168.26.173, SNMPv2c version, error index 0, error status 0, and variable bindings with OIDs and values for network monitoring.
Parameter: JGroup Membership Issue Detected

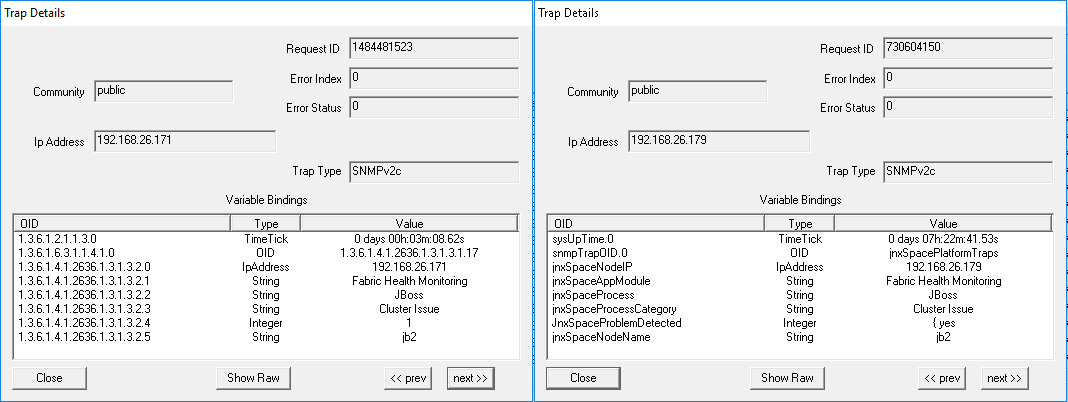
When the removal of a JBoss node from JGroup is detected in the cluster, the trap shown in Figure 63 is generated:

Figure 63: JGroup Membership Issue Detected Log entry with ID 644 for space space-0002911aa47 shows Jgroup Membership issue detected on 6/14/17 at 19:56:49.

Figure 64 shows the OID details for the trap generated when the removal of a JBoss node from JGroup is detected in the cluster.

Figure 64: Trap Details When JGroup Membership Issue Detected Two panels display SNMP trap details with unique Request IDs, community 'public,' IP addresses 192.168.26.171 and 192.168.26.179, SNMPv2c, and variable bindings for system uptime and cluster issues in JBoss.
Parameter: MySQL In Out Of Sync State

When a MySQL database synchronization issue is detected between nodes running the MySQL database, the trap shown in Figure 65 is generated:

Figure 65: MySQL In Out Of Sync State MySQL database out of sync on node DB1; ID 343; Resource space-00506938252; Status 1; Timestamp 12/11/17 11:09:55.

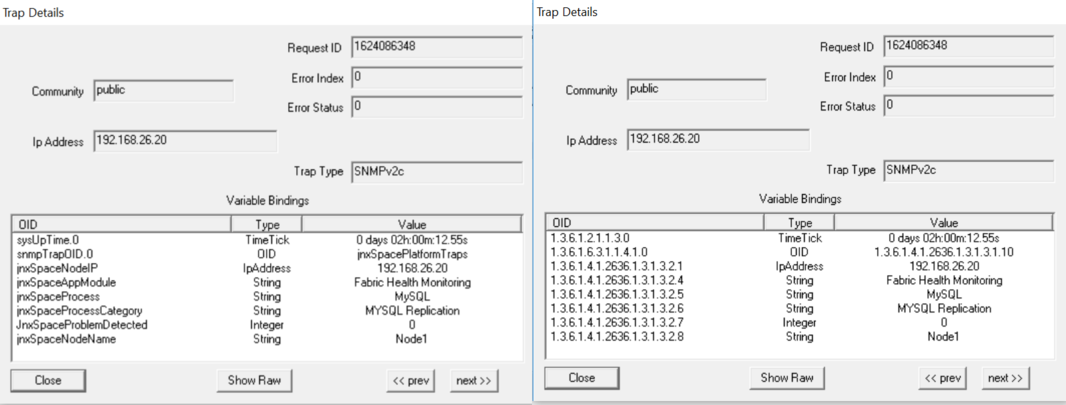
Figure 66 shows the OID details for the trap generated when a MySQL database synchronization issue is detected between nodes running the MySQL database.

Figure 66: Trap Details When MySQL Is In Out Of Sync State Trap Details window showing SNMP trap data with Request ID 1624086348, Community public, IP Address 192.168.26.20, Trap Type SNMPv2c, and Variable Bindings. Left window lists OIDs descriptively; right window lists numerical OIDs. Includes navigation buttons for prev, next, Show Raw, and Close.
Parameter: File Intrusion Detection Monitoring

When changes in files or file permissions are detected, the trap shown in Figure 67 is generated.

Figure 67: File Intrusion Detection Monitoring Log entry showing filesystem changes detected in node jboss by Aide with timestamp 12/16/17 18:26:17.

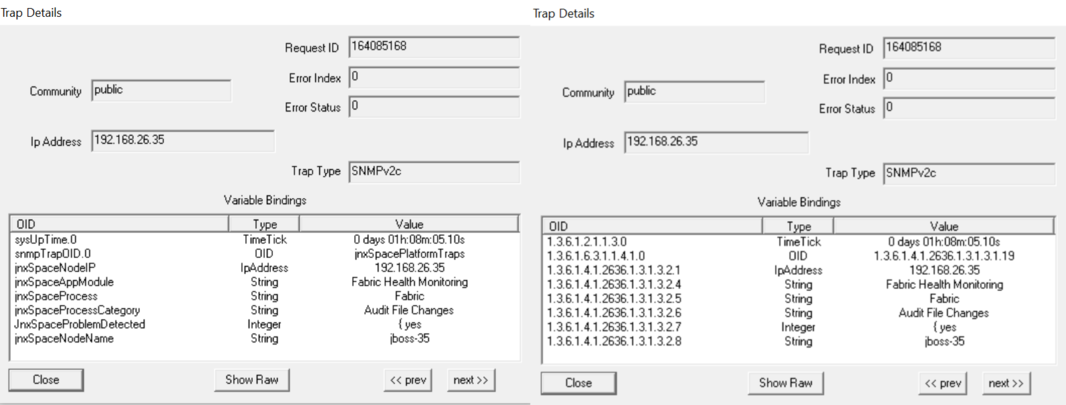
Figure 68 shows the OID details for the trap generated when file or file permission changes are detected in the system.

Figure 68: Trap Details for File Intrusion Detection Monitoring Trap Details panels displaying SNMP trap info: Request ID 164085168, Community public, IP 192.168.26.35, Trap Type SNMPv2c. Left shows descriptive OIDs, right shows numerical OIDs, detailing uptime, node IP, monitoring data.
Parameter: Audit Logs Forwarding Failed

When the system fails to forward audit logs to the configured system log server, the trap shown in Figure 69 is generated:

Figure 69: Audit Logs Forwarding Failed Log entry with ID 622; space identifier space-000294ed8bc; status code 27; timestamp 6/14/17 19:56:17; message Audit Log Forwarding process failed.

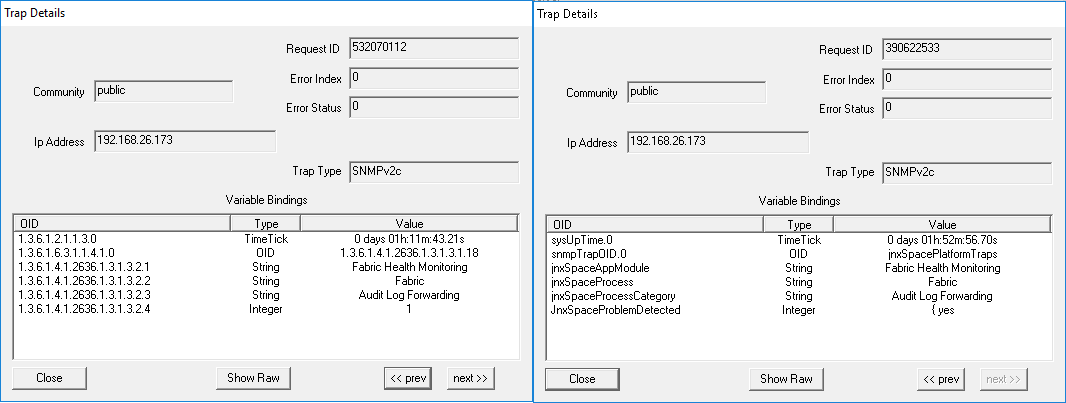
Figure 70 shows the OID details for the trap generated when the system fails to forward audit logs to the configured system log server.

Figure 70: Trap Details When Audit Logs Forwarding Fails SNMP trap details with two panels: Left panel shows Fabric Health Monitoring and Audit Log Forwarding OIDs; right panel indicates Problem Detected with value yes. Use navigation buttons to switch traps or view raw data.
Parameter: One Or More Expected Process Are Inactive

Junos Space monitors critical process like JBoss. If any of these expected processes are inactive, the trap shown in Figure 71 is generated:

Figure 71: One or More Expected Processes Are Inactive Log entry with ID 104 for process space-000c295d757a. Status 2. Timestamp 6/23/17 18:58:03. Issue: Inactive processes in node Juniper_Slave.

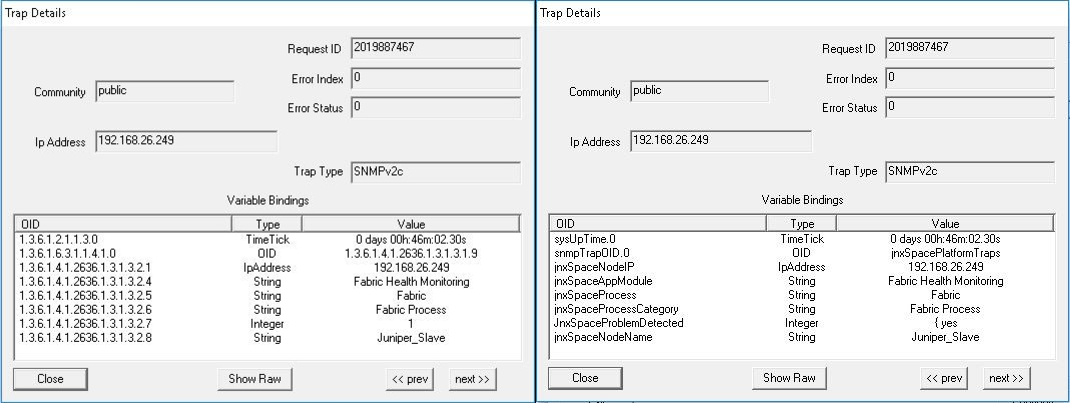
Figure 72 shows the OID details for the trap generated when one or more expected processes are inactive.

Figure 72: Trap Details When One or More Expected Processes Are Inactive Network monitoring tool panels showing SNMP trap details with Request ID 2019887467, community string public, IP 192.168.26.249, and SNMPv2c. Left panel includes OIDs for Fabric Health Monitoring and Juniper_Slave; right panel includes sysUpTime.0 and jnxSpaceNodeName. Navigation buttons for trap details.
Note:

LM-SENSORS-MIB is not supported by the Junos Space virtual appliance, but only by the Junos Space Appliance. Therefore the threshold settings of CPU Max Temp (mC), CPU Min Fan (RPM) and CPU Min Voltage (mV) will not trigger any traps in the virtual appliance.

Note:

Junos Space supports RAID-related traps on a Junos Space appliance. The following is a sample trap:

Starting SNMP Monitoring on Fabric Nodes

To start SNMP monitoring on one or more fabric nodes:

  1. Select Network Management Platform > Administration > Fabric.

    The Fabric page appears.

  2. Select the check box for each fabric node on which you want to start SNMP monitoring.
  3. From the Actions menu, select SNMP Start.

    The Confirm Start SNMP Agent dialog box is displayed.

  4. Click Yes.

    Junos Space begins SNMP monitoring on the selected fabric nodes.

    Note:

    This process might take a while.

  5. To view the status of SNMP monitoring on the selected fabric nodes, select Network Monitoring > Node List.

    The Network Monitoring > Node List page appears.

  6. Select the node on which you started the SNMP monitoring.

    The Junos Space node is represented as space-<number> .

    Figure 73 shows a sample view of network monitoring details for the selected fabric node.

    Figure 73: Network Monitoring Details for the Selected Fabric Node Screenshot of a network monitoring tool showing node `space-0256042012000017` details. Availability is 94.751 percent. IP `10.205.56.40` has 92.126 percent availability and `10.205.57.40` has 100 percent. Node status is active. Logs show SNMP issues.
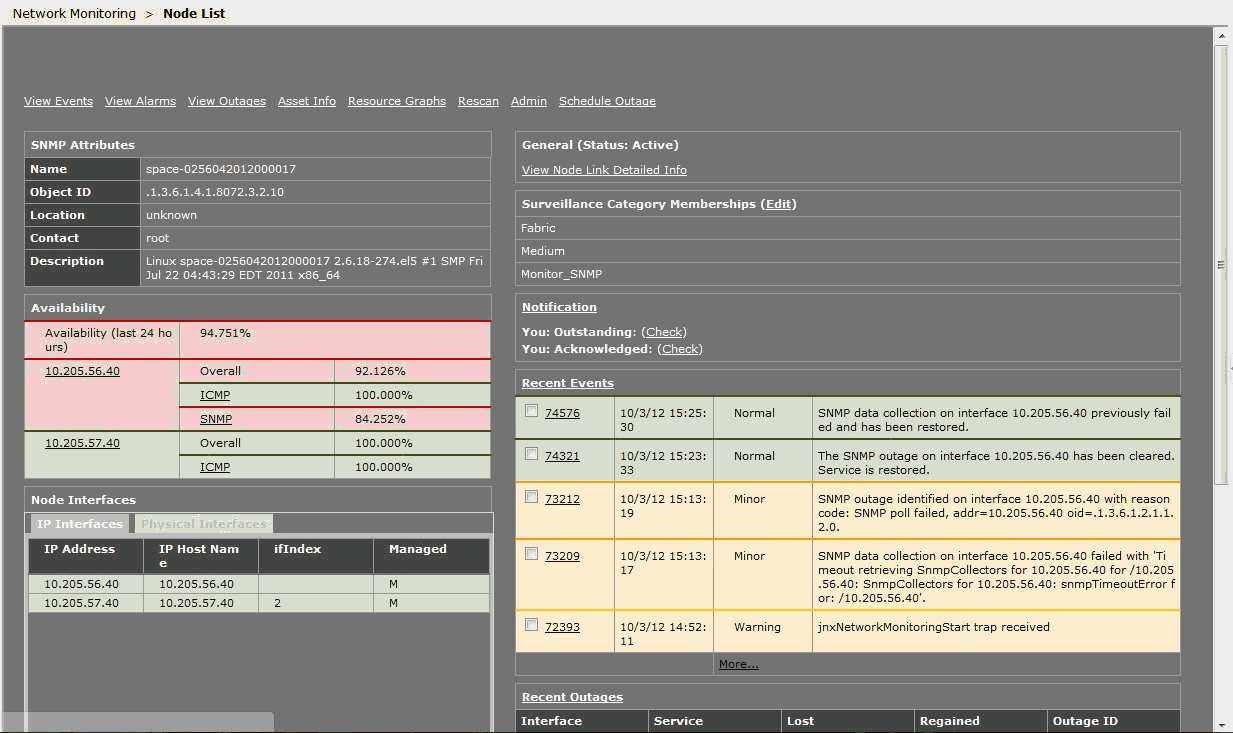
    Under Notification / Recent Events on the right of the Node List page, you see the results of the SNMP monitoring operation.

Stopping SNMP Monitoring on Fabric Nodes

To stop SNMP monitoring on one or more fabric nodes:

  1. Select Network Management Platform > Administration > Fabric.

    The Fabric page appears.

  2. Select the check box for each fabric node on which you want to stop SNMP monitoring.
  3. From the Actions menu, select SNMP Stop.

    The Confirm Stop SNMP Agent dialog box is displayed.

  4. Click Yes.

    Junos Space stops SNMP monitoring on the selected fabric nodes.

Restarting SNMP Monitoring on Fabric Nodes

To restart SNMP monitoring on one or more fabric nodes:

  1. Select Network Management Platform > Administration > Fabric.

    The Fabric page appears.

  2. Select the check box for each fabric node on which you want to restart SNMP monitoring.
  3. From the Actions menu, select SNMP Restart.

    The Confirm Restart SNMP Agent dialog box is displayed.

  4. Click Yes.

    Junos Space restarts SNMP monitoring on the selected fabric nodes.

Adding a Third-Party SNMP V1 or V2c Manager on a Fabric Node

To add a third-party SNMP V1 or V2c manager on a fabric node:

  1. Select Network Management Platform > Administration > Fabric > SNMP Manager.

    The SNMP Manager page appears.

  2. Click the Add SNMP Manager icon.

    The Add 3rd Party SNMP Manager dialog box is displayed.

  3. In the Manager IP field, enter the SNMP manager IP address.
    Note:
    • Depending on whether the Junos Space fabric is configured with only IPv4 addresses or both IPv4 and IPv6 addresses, Junos Space Platform allows you to enter an IPv4 address or either an IPv4 or IPv6 address respectively for the SNMP Manager.

    • The IPv4 and IPv6 addresses that you use must be valid addresses. Refer to http://www.iana.org/assignments/ipv4-address-space for the list of restricted IPv4 addresses and http://www.iana.org/assignments/ipv6-address-space for the list of restricted IPv6 addresses.

  4. In the Version field, select the SNMP version (V1 or V2c) .
  5. In the Community field, enter the community string.

    Any alphanumeric string (up to 254 characters) is acceptable, including spaces and symbols.

  6. Click OK.

    The newly added SNMP v1 or v2c Manager is displayed on the SNMP Manager page.

Adding a Third-Party SNMP V3 Manager on a Fabric Node

To add a third-party SNMP V3 manager on a fabric node:

  1. Select Platform > Administration > Fabric > SNMP Manager.

    The SNMP Manager page appears.

  2. Click the Add icon.

    The Add 3rd Party SNMP Manager dialog box displays.

  3. In the Manager IP field, enter the SNMP manager IP address.
    Note:
    • Depending on whether the Junos Space fabric is configured with only IPv4 addresses or both IPv4 and IPv6 addresses, Junos Space Platform allows you to enter an IPv4 address or either an IPv4 or IPv6 address respectively for the SNMP Manager.

    • The IPv4 and IPv6 addresses that you use must be valid addresses. Refer to http://www.iana.org/assignments/ipv4-address-space for the list of restricted IPv4 addresses and http://www.iana.org/assignments/ipv6-address-space for the list of restricted IPv6 addresses.

  4. In the Version field, select V3.
  5. In the User Name field, type the user name.

    The user name can contain a maximum of 32 alphanumeric characters including spaces and symbols.

  6. In the Authentication Type field, enter the authentication type (MD5 or SHA).
  7. In the Authentication Password field, enter the authentication password.

    Click the red information icon next to the Authentication Password field for information on the password rules.

  8. In the Confirm Authentication password, enter the authentication password again to confirm the password.
  9. From the Security Level list, select the security level:
    • noAuthNoPriv—Do not specify an authentication or privacy password.

    • authNoPriv—Specify only an authentication password.

    • authPriv—Specify both authentication and privacy passwords.

  10. In the Privacy Type field, enter the privacy type (AES or DES).
  11. In the Privacy Password field, enter the privacy password.

    Click the red information icon next to the Authentication Password field for information on the password rules.

  12. In the Confirm Privacy password field, enter the privacy password again to confirm the password.
  13. Click OK.

    The newly added SNMP Manager entry is displayed on the SNMP Manager page.

Note:

The trap settings for the SNMPv3 manager are not automatically updated in Network Monitoring. Therefore, to ensure that the Network Monitoring receives the traps from Junos Space, you must add the same settings manually in the /opt/opennms/etc/trapd-configuration.xml file. Table 7 displays the mapping between the parameters in the /opt/opennms/etc/trapd-configuration.xml file and the fields in the Add 3rd Party SNMP Manager page.

The following is a sample configuration in the /opt/opennms/etc/trapd-configuration.xml file.

Table 7: Mapping of SNMP V3 Settings

Parameter in trapd-configuration.xml File

Field in Add 3rd Party SNMP Manager Page

security-name

User Name

auth-passphrase

Authentication Password

privacy-passphrase

Privacy Password

privacy-protocol

Privacy Type

Deleting a Third-Party SNMP Manager from a Fabric Node

To delete a third-party SNMP manager configuration from a fabric node:

  1. Select Platform > Administration > Fabric > SNMP Manager.

    The SNMP Manager page appears.

  2. Select the SNMP manager configuration that you want to remove.
  3. Click the Delete SNMP Manager icon.
  4. To confirm the deletion of the SNMP manager, click Yes.

    The deleted SNMP manager is removed from the SNMP Manager page.

Installing StorMan RPM for Monitor RAID Functionality

To install StorMan RPM:

From Junos Space Platform CLI, run the following command: