Traffic-Drop Alerts
Learn how to use the Marvis Actions dashboard to detect traffic blackholes in the router's forwarding plane.
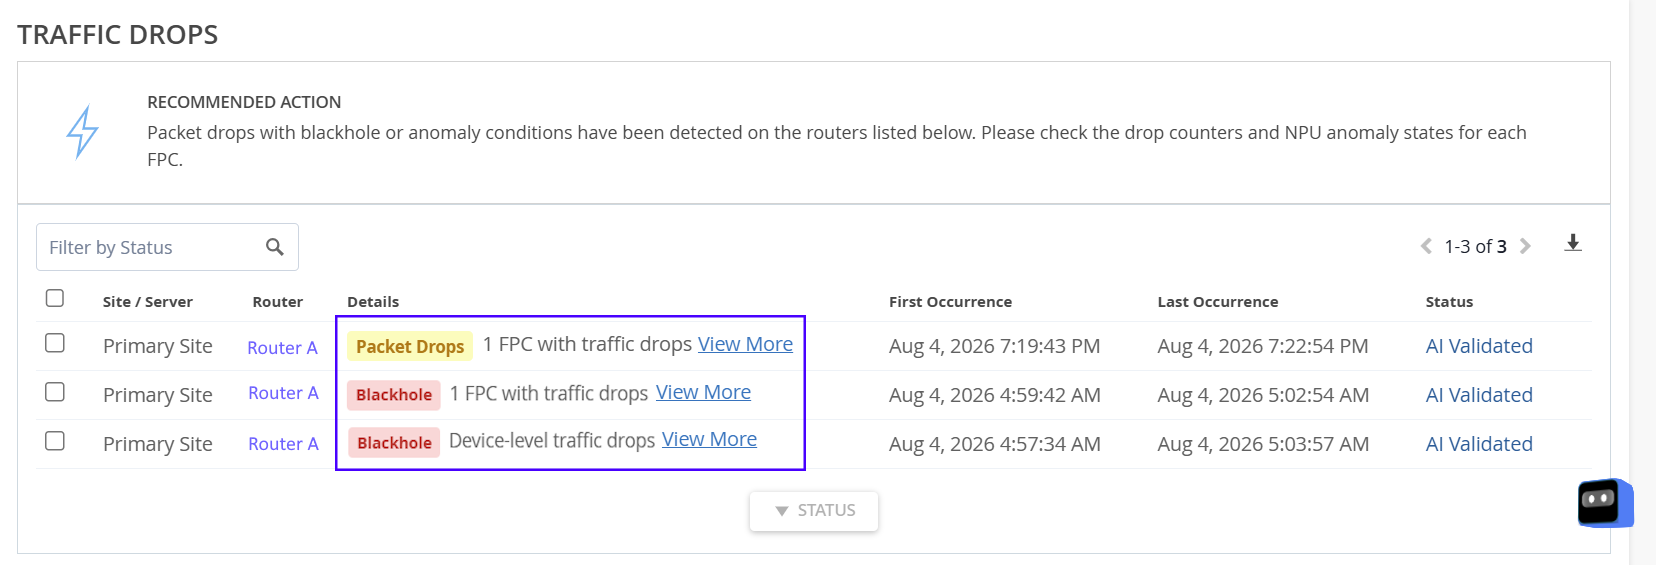
To view the traffic drops event, click Marvis > Forwarding > Traffic Drops.
A traffic blackhole occurs when transit traffic is consistently or intermittently dropped before reaching the egress interface. Packet drops in Junos OS and Junos OS Evolved routers can result from:
-
Hardware failures or resource constraints
-
Software defects
-
Operational events such as BFD session flaps or line-card restarts
-
Configuration issues such as filtering policies, QoS misconfiguration, and routing errors
Packet drops within a router's forwarding path can significantly impact service availability and user experience. Although occasional packet loss might occur during normal network operation, persistent or excessive packet drops often indicate underlying forwarding, routing, queuing, congestion, or hardware-related issues that require investigation. A traffic blackhole can be persistent or transient and is often difficult to diagnose because packet drops occur deep within the forwarding pipeline.
Identifying the source of packet drops can be challenging in large networks. Administrators often need to run multiple commands, analyze forwarding statistics, examine packet forwarding engine counters, and correlate events across different time intervals to determine whether packet loss is isolated or part of an ongoing problem.
Traffic Drops event in Marvis Actions automates the detection and analysis of packet-loss conditions. Marvis continuously monitors router telemetry and applies detection algorithms to identify sustained packet-loss conditions and presents the findings as actionable insights. When a traffic-drop condition is detected, Marvis generates a Traffic Drops issue that includes the affected router, forwarding component, drop duration, packet rates, drop counters, and contextual information to help identify the root cause.
Benefits of Traffic-Drops Detection
-
Faster problem identification─Marvis continuously monitors telemetry to identify abnormal packet-loss conditions, eliminating the need for manual inspection of forwarding statistics or drop counters. This approach reduces detection time for issues that might otherwise go unnoticed until users experience service degradation.
-
Reduced troubleshooting time─Traditional troubleshooting of packet drops involves correlating data from multiple Junos OS and Junos OS Evolved operational commands. Traffic drops event consolidates this data into a single Marvis Action event, enabling administrators to quickly assess issue severity, identify the affected forwarding component, and analyze relevant counters.
-
Improved Network Reliability─Continuous monitoring of forwarding behavior and identification of persistent packet-loss conditions supports organizations in maintaining network stability, minimizing service disruptions, and enhancing the overall user experience.
Prerequisite
Marvis analyzes traffic drops by evaluating telemetry data collected from routers. Ensure gNMI telemetry is enabled on the router so that Marvis receives the sensor data required to detect and analyze traffic-drop events.
To enable gNMI Telemetry, see Configure gNMI Telemetry. For additional information about gNMI telemetry support in Juniper Routing Assurance, see gNMI Telemetry Overview.
How Marvis Detects Traffic Drops
Marvis uses the following detection mechanisms to identify traffic drops:
-
Device-level traffic drop detection (or catch-all traffic drop detection)
-
Drop counter-based traffic drop detection
These detection methods are not mutually exclusive. Marvis detects traffic drops through both methods simultaneously. For example, a router might exceed the device-level traffic drop threshold while also showing elevated drop counts in one or more exception counters.
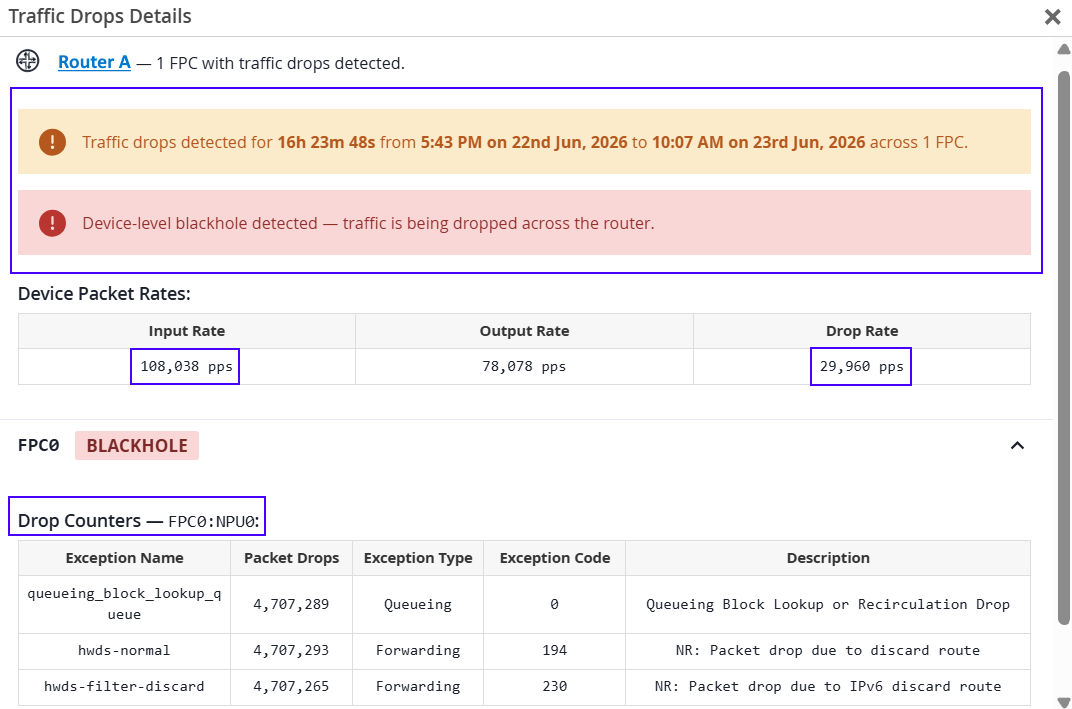
Device-level traffic drop detection and drop counter–based detection can concurrently detect traffic drop events. When both detection methods identify drops during different or overlapping time intervals, Marvis reports the event as a single incident. In such cases, the total drop duration reflects the combined duration of traffic drops detected across both methods.
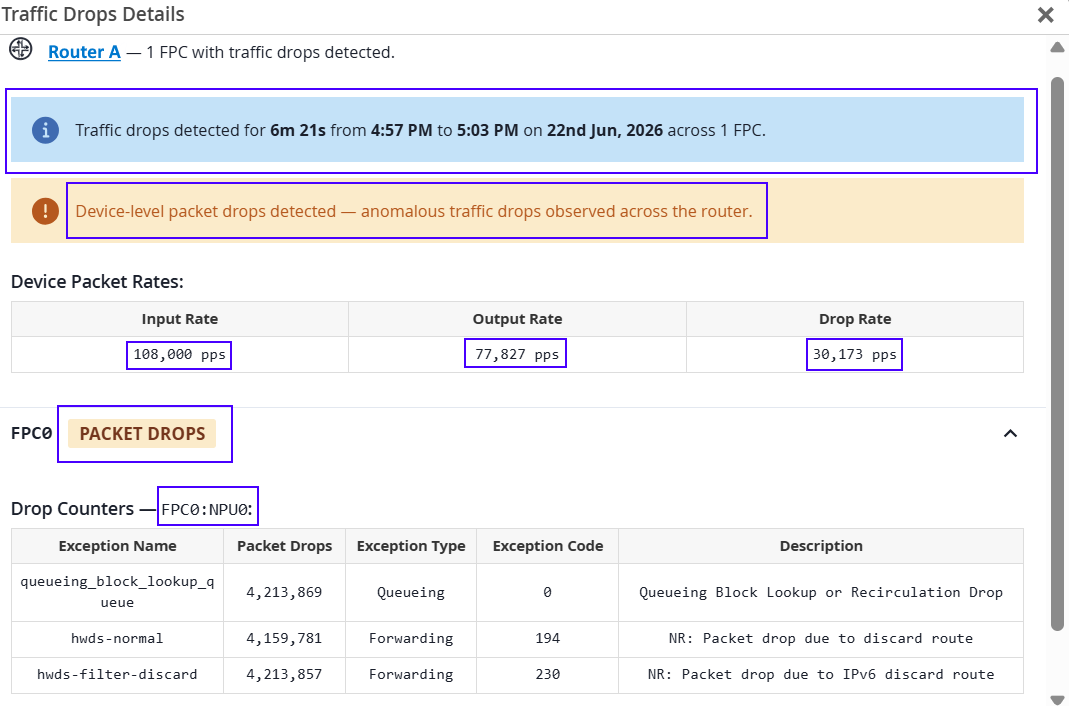
You must review both device-level statistics and the drop counter details to gain a complete understanding of the underlying cause of the traffic drop event. For example, see Figure 4. The reported drop duration represents the cumulative duration of drops detected across both methods.
Device-Level Traffic Drop Detection
Marvis analyzes packet forwarding statistics collected from the packet forwarding engine.
The analysis is based on telemetry data that corresponds to the output of the show
pfe statistics traffic operational command.
The telemetry includes the following metrics:
- Input Packet Rate
- Output Packet Rate
- Packet Drop Rate
Marvis calculates the packet drop rate as follows:
Packet drop rate = Input packet rate − Output packet rate
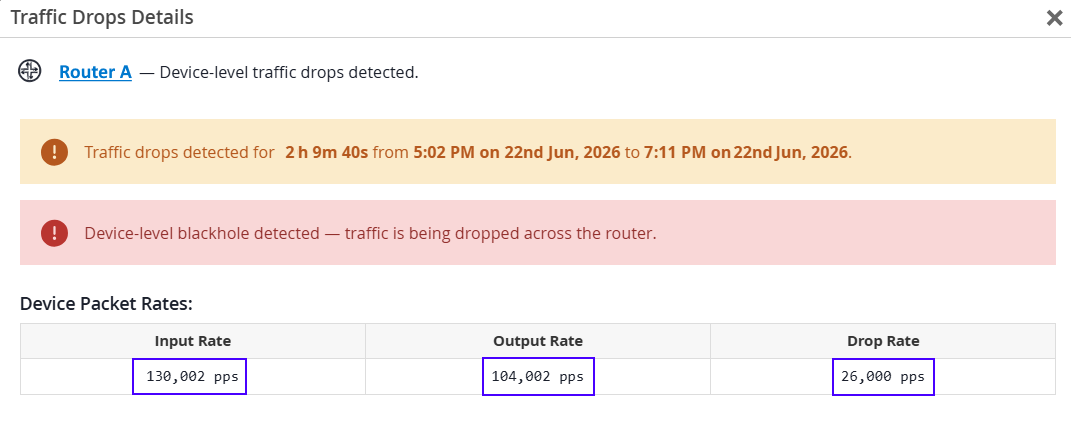
Marvis considers packet loss significant when a router receives a high volume of traffic and a percentage of that traffic consistently gets dropped. Mavis generates a device-level traffic blackhole event when all of the following conditions are met:
-
The input packet rate exceeds 100,000 packets per second (pps).
-
The packet drop rate exceeds 10 percent of the input traffic rate.
-
The condition persists for approximately 10 minutes and must have occured at least once in the last 30 minutes.
For example, if the packet forwarding engine receives traffic at 130,000 pps and forwards 100,000 pps, 30,000 pps are dropped. This represents 23 percent of the incoming traffic. About 23 out of every 100 packets received by the router get dropped, while the remaining 77 packets get forwarded.
In this example:
- Input traffic exceeds 100K pps.
- Packet drop rate exceeds 10 percent of the input traffic.
Because the thresholds are met, Marvis identifies this condition as a traffic blackhole and generates a Traffic Drop Blackhole event.
Marvis collects and analyzes data at regular sampling intervals within a 30‑minute correlation window. If subsequent traffic drops are detected during this window, Marvis correlates them with the existing event instead of creating another event.
Marvis calculates the event duration as follows:
Last detected drop timestamp − First detected drop timestamp.
The event remains active as long as additional qualifying packet drops are detected within the correlation window. Once no further drops occur, the event becomes inactive. After 30 minutes of inactivity, Marvis moves the event to the AI Validated state.
Drop Counter-Based Traffic Drop Detection
Many packet-loss conditions cannot be detected by comparing input and output packet rates on interfaces. In many cases, drops occur because packets are discarded within the forwarding pipeline. To identify these conditions, you must use platform-specific telemetry tools to analyze low-level drop counters maintained by the packet forwarding engine.
In Junos OS, packet forwarding engine counters are low-level hardware counters that provide visibility into packet forwarding, drops, lookup failures, and interface health. The packet forwarding engine statistics sensor tracks these counters and provides visibility into forwarding errors and drop statistics. The traffic sensor data is exported through gRPC.
Junos OS operational commands that report these counters include:
show
          pfe statistics traffic
show pfe statistics traffic detail
These commands report traffic, discard, exception, and hardware-drop statistics that can be correlated to packet-loss conditions in the forwarding plane.
Marvis analyzes counters through gRPC telemetry. It focuses on forwarding and exception counters from:
-
/components/component/integrated-circuit/pipeline-counters/
-
/junos/system/linecard/packet/usage/
From these paths, Marvis monitors counters that represent specific forwarding or packet-processing conditions, such as:
-
Hardware discard (
hwds_*) -
Lookup block (
lookup_block_*) -
Interface-related (
interface_*) -
Fabric-drop
-
Exception
See Table 1 for example counters and their descriptions. Each counter increments by the number of packets discarded for the specific reason associated with that counter. This allows Marvis to detect forwarding-plane drops that are invisible in standard interface statistics.
The drop counters increment whenever packets are dropped within the corresponding forwarding subsystem. A counter increases by the number of packets discarded for the specific reason associated with that counter.
Marvis collects telemetry from monitored drop counters at three-minute intervals. During each evaluation cycle, it calculates the change (delta) in the counter value.
For example, assume that the queuing_block_lookup_queue counter value is
6,200 at time T1 and 8,250 at time T2. Marvis calculates the delta as follows:
Delta = Counter value at time T2 - Counter value at time T1 = 8,250 - 6,200 = 2,050.
Because the delta exceeds 1,000 packets, the interval is considered as a qualifying drop interval. When the delta for a monitored drop counter exceeds 1,000 packets and the condition remains consistent for approximately 10 minutes across consecutive evaluation intervals, Marvis generates a Blackhole traffic-drop event.
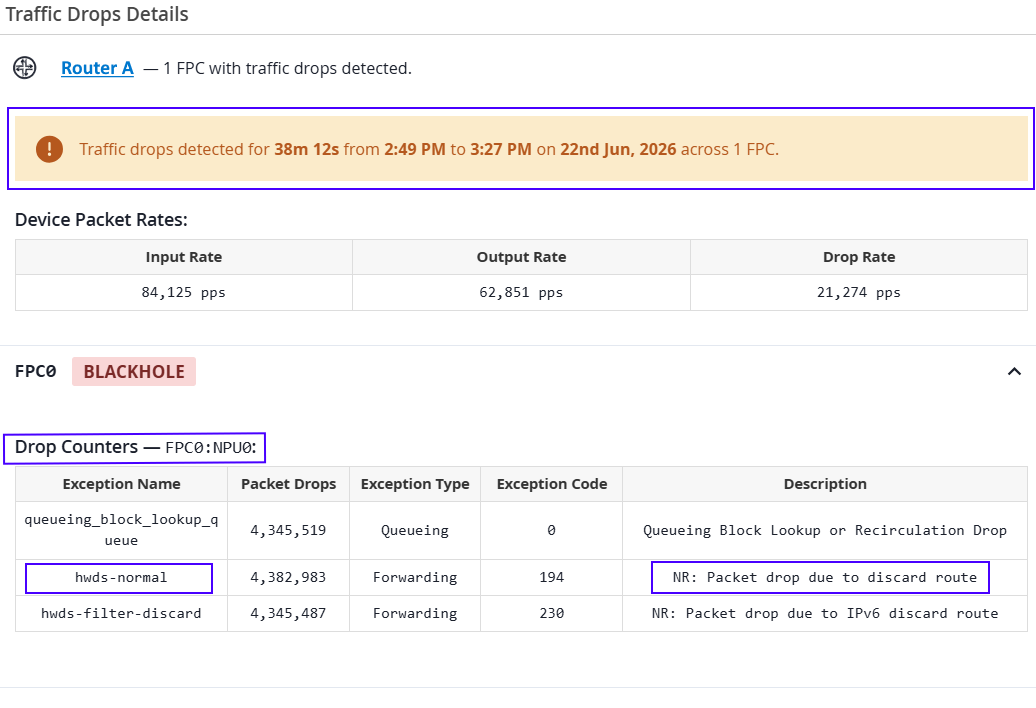
In Figure 3, the router input packet rate is 84, 125 pps, which is below the 100, 000 threshold pps required to trigger device-level traffic-drop detection. Despite the low traffic volume, Marvis detected traffic-drop anomalies by analyzing drop counters on the forwarding plane.
Marvis identified the following conditions:
-
Traffic drops on NPU 0 of FPC 0.
-
Increased drop counts in the following exception counters:
-
queuing_block_lookup_queue -
hwds-normal -
hwds-filter-discard
-
-
Persistent traffic drops for 38 minutes and 12 seconds, from 2:49 PM to 3:27 PM on June 22, 2026.
The Drop Counters table provides contextual information about the reason for each packet drop, enabling administrators quickly narrow down the scope of investigation. In this example, the counters indicate that packets were dropped because they matched discard routes, suggesting that legitimate traffic might have been affected by a discard route or filtering policy.
To further investigate the issue, administrators can review:
-
Hardware trap and exception registers.
-
Routing entries that resolve to discard or reject next hops.
-
Configured firewall filters, ACLs, or policy-based forwarding rules.
-
Route advertisements and route policy configurations that might have resulted in unintended discard routes.
If the root cause cannot be determined through local troubleshooting, contact an HPE Networking representative for additional assistance. Click the help icon (?) at the top right of the page and select Support Tickets to create a support request or to track your existing requests.
Packet Drops Classification
Packet Drops represent transient packet-loss conditions that exceed thresholds during one or a few telemetry intervals, but do not persist long enough to qualify as a traffic blackhole.
Marvis continuously analyzes device-level forwarding statistics and packet forwarding engine drop counters to decide whether a condition is a sustained traffic drop (traffic blackhole), or a transient anomaly (packet drops) event.
A temporary spike in packet drops can exceed detection thresholds during a telemetry interval but recover before it can be classified as a sustained forwarding anomaly. In such cases, Marvis reports the condition as a Packet Drops event.
Device-Level Packet Drops
For device-level traffic analysis, Marvis monitors the input packet rate, output packet rate, and packet-drop rate. A Packet Drops event is generated when:
- The input packet rate exceeds 100,000 pps.
- The packet-drop rate exceeds 10 percent of the input traffic rate.
- The condition is observed for only one or a few telemetry collection intervals.
Because the condition is not sustained, Marvis classifies it as a Packet Drops event rather than a traffic blackhole event.
Drop Counter-Based Packet Drops
A Packet Drops event is generated when a monitored drop counter shows a temporary increase and the counter delta exceeds 1,000 packets during an evaluation interval, but the counter delta does not remain above the traffic-drop threshold for the consecutive evaluation intervals required to trigger a drop counter-based traffic drop event.
Because the increase is not sustained, Marvis classifies the event as Packet Drops rather than a traffic blackhole event. These events represent transient forwarding anomalies that recover during subsequent telemetry collection intervals.
For example, if a monitored drop counter increases from 6,200 packets to 8,250 packets between two telemetry collection intervals, the delta is 2,050 packets, which exceeds the threshold. However, if subsequent evaluation intervals do not continue to show deltas above the threshold, Marvis reports the condition as a Packet Drops event instead of a traffic blackhole event.
If, during the subsequent evaluation intervals, the counter delta continues to exceed 1,000 packets and the condition persists for approximately 10 minutes, Marvis reclassifies the issue as a traffic blackhole event. A packet drops event can transition into a traffic blackhole event when the packet-loss condition is determined to be sustained rather than transient.
These events represent forwarding anomalies that initially exceed detection thresholds. Marvis classifies them as Packet Drops when they are transient, and as Traffic Blackhole events when the same symptoms persist long enough to indicate a sustained forwarding problem.
|
Drop Counter |
Description |
|---|---|
|
fabric_block_fabric_aggregate |
Packet drops across the fabric block (ingress and egress). |
|
host_interface_block_lost_packets |
Packets lost at the host interface block. |
|
interface_block_in_drops |
Packets dropped on ingress to the interface block. |
|
queueing_block_memory_limit |
Packets dropped because the queueing block exhausted available memory. |
|
lookup_block_incorrect_rate_limit |
Packets dropped due to an incorrect rate-limit condition in the lookup block. |
|
hwds-inet-bad-route |
Packets dropped because the route was rejected. |
|
packet_err_v4_hdr |
Packets dropped due to an invalid IPv4 header. |
|
Field |
Description |
|---|---|
|
Input Rate |
Input packet rate in pps. |
|
Output Rate |
Output packet rate in pps. |
|
Drop Rate |
Packet drop rate in pps. |
|
Exception Name |
Name of the drop counter. |
|
Packet Drops |
Number of packets dropped. |
|
Exception Type |
Forwarding subsystem where the drop occurred. Following are the subsystems:
|
|
Exception Code |
Trap code for the exception. The trap code is used internally for event generation and correlation and does not indicate the counter value or drop reason itself. |
|
Description |
A short description of the issue that caused traffic drops. |