Active (Datacenter Blueprint)
Active Blueprint Overview
When you deploy your network (by committing the staged blueprint), network status and other details are shown in the Active view. From here, you can monitor your network and see any anomalies at-a-glance. You can filter alerts and anomalies by different layers to conduct root cause analysis of problems.
Selection Panel
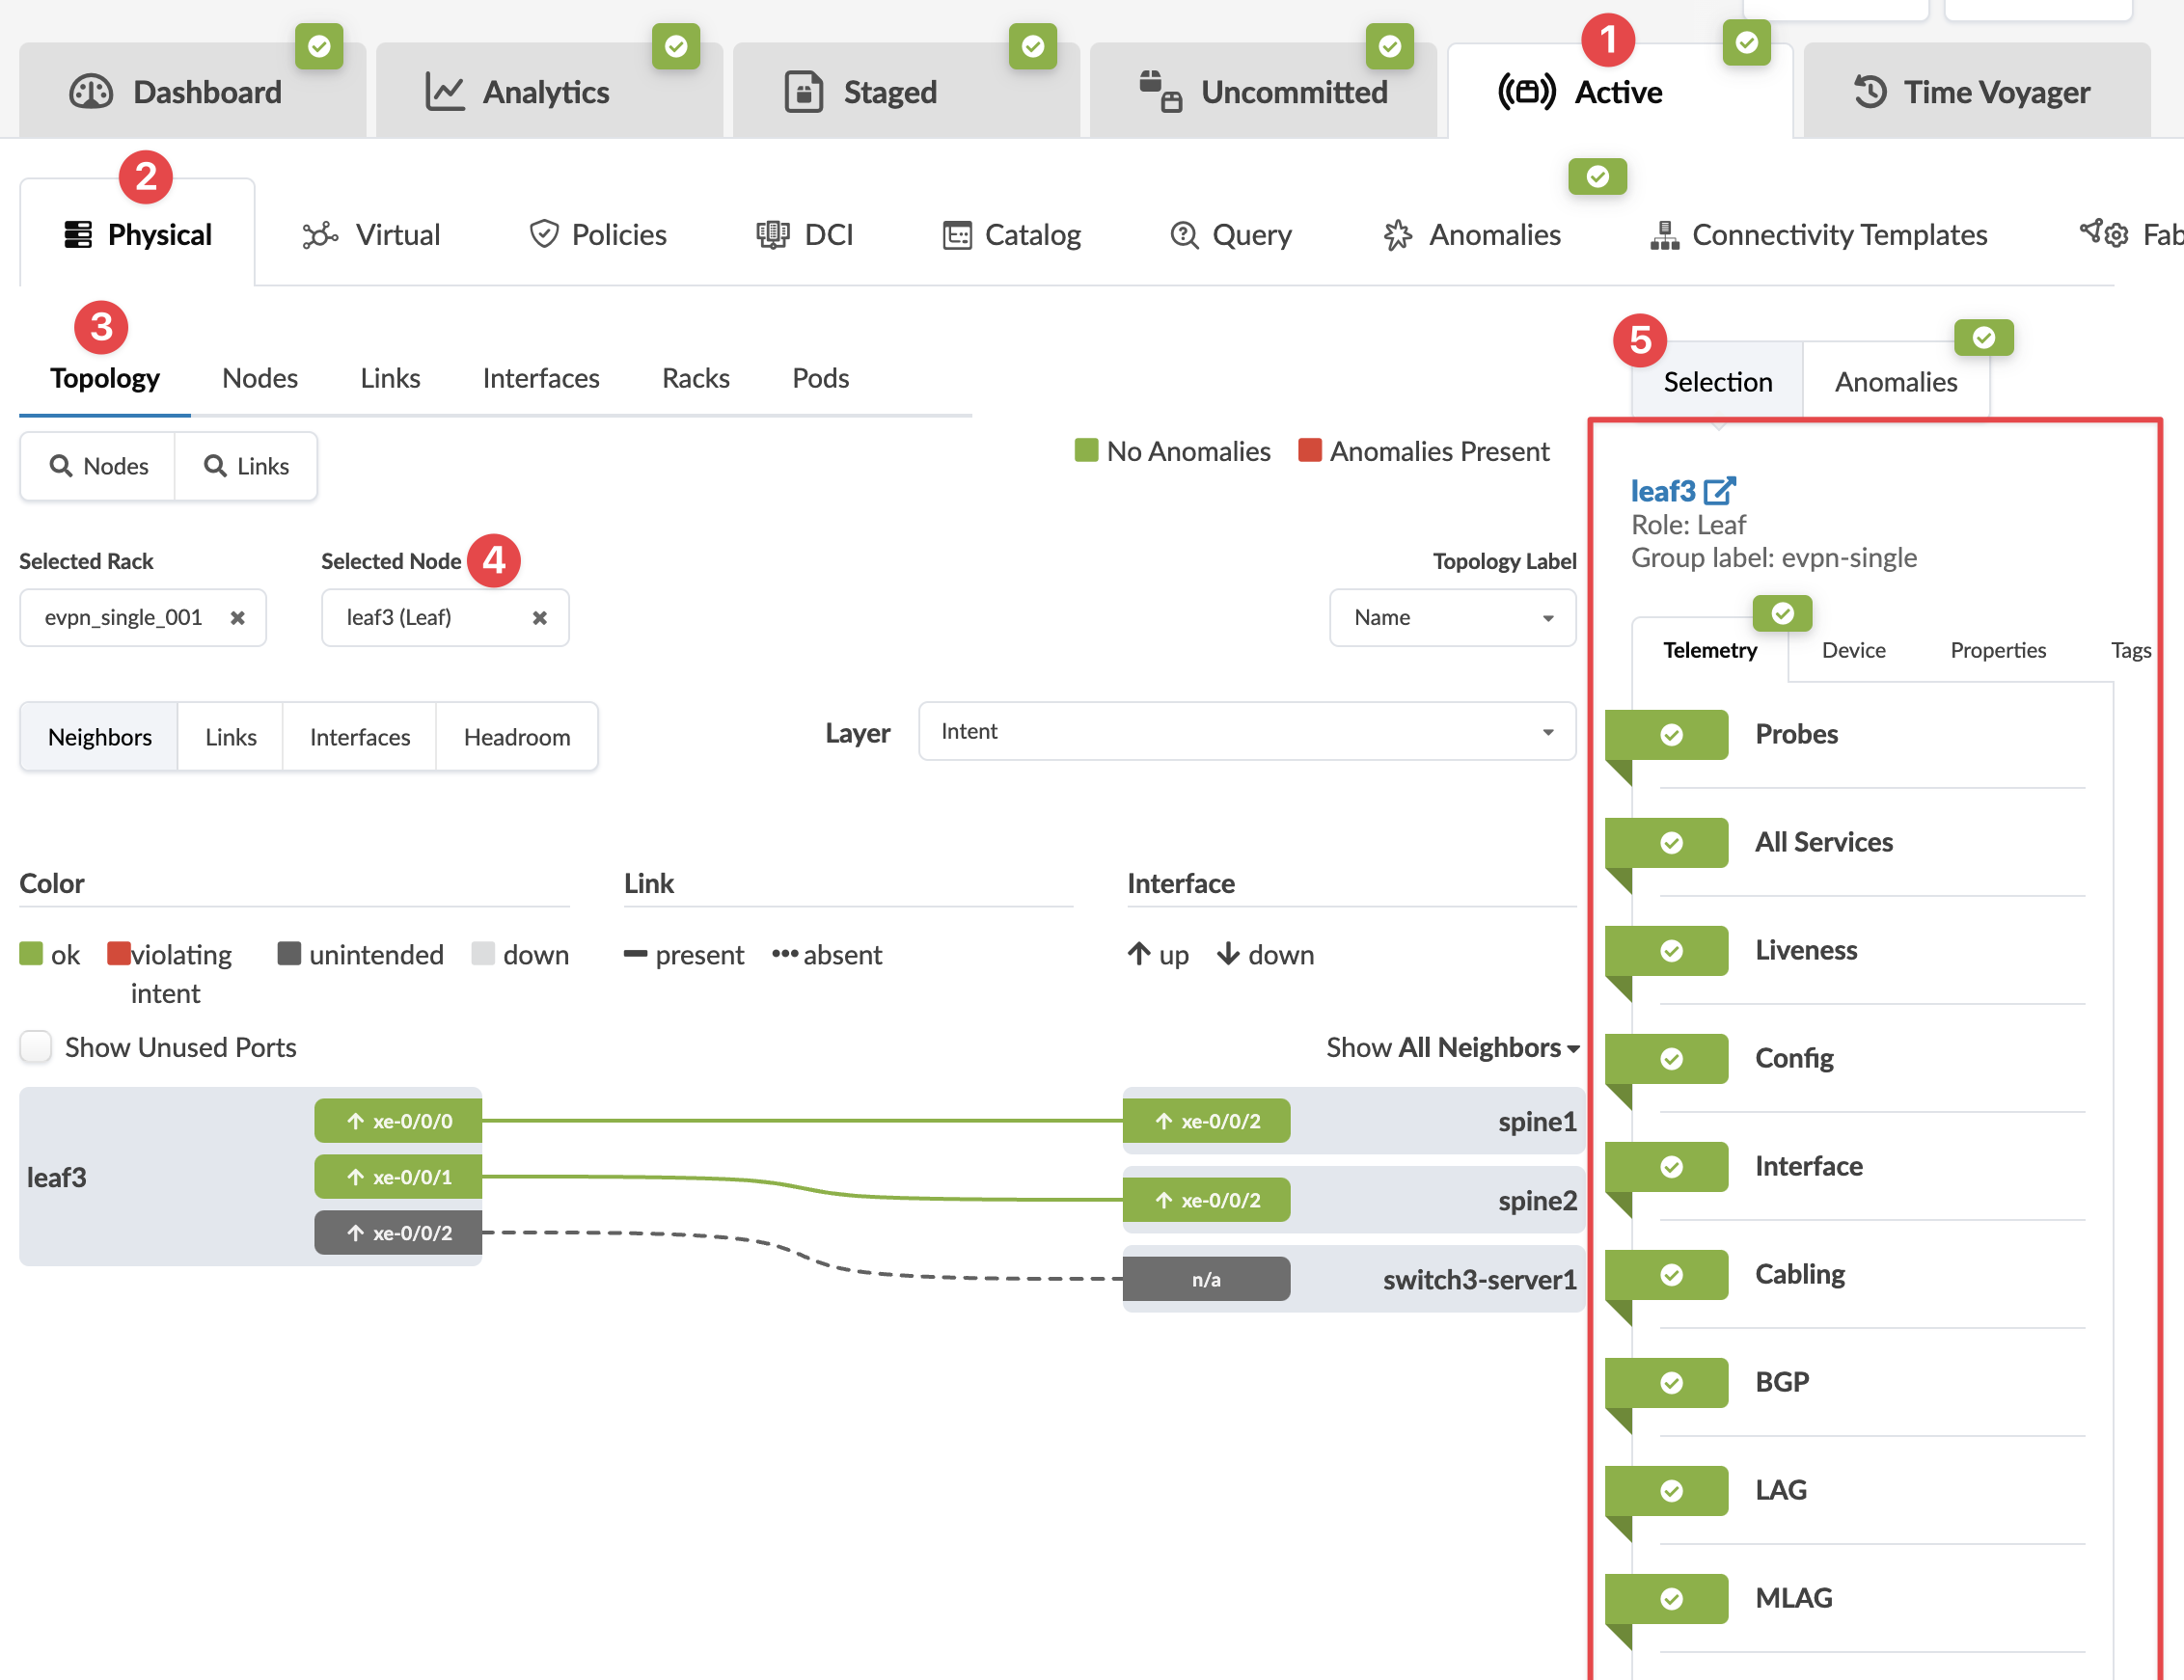
When you select a node in the active Topology or Nodes view, information about telemetry, device, properties, and tags for that node are available in the right Selection panel.
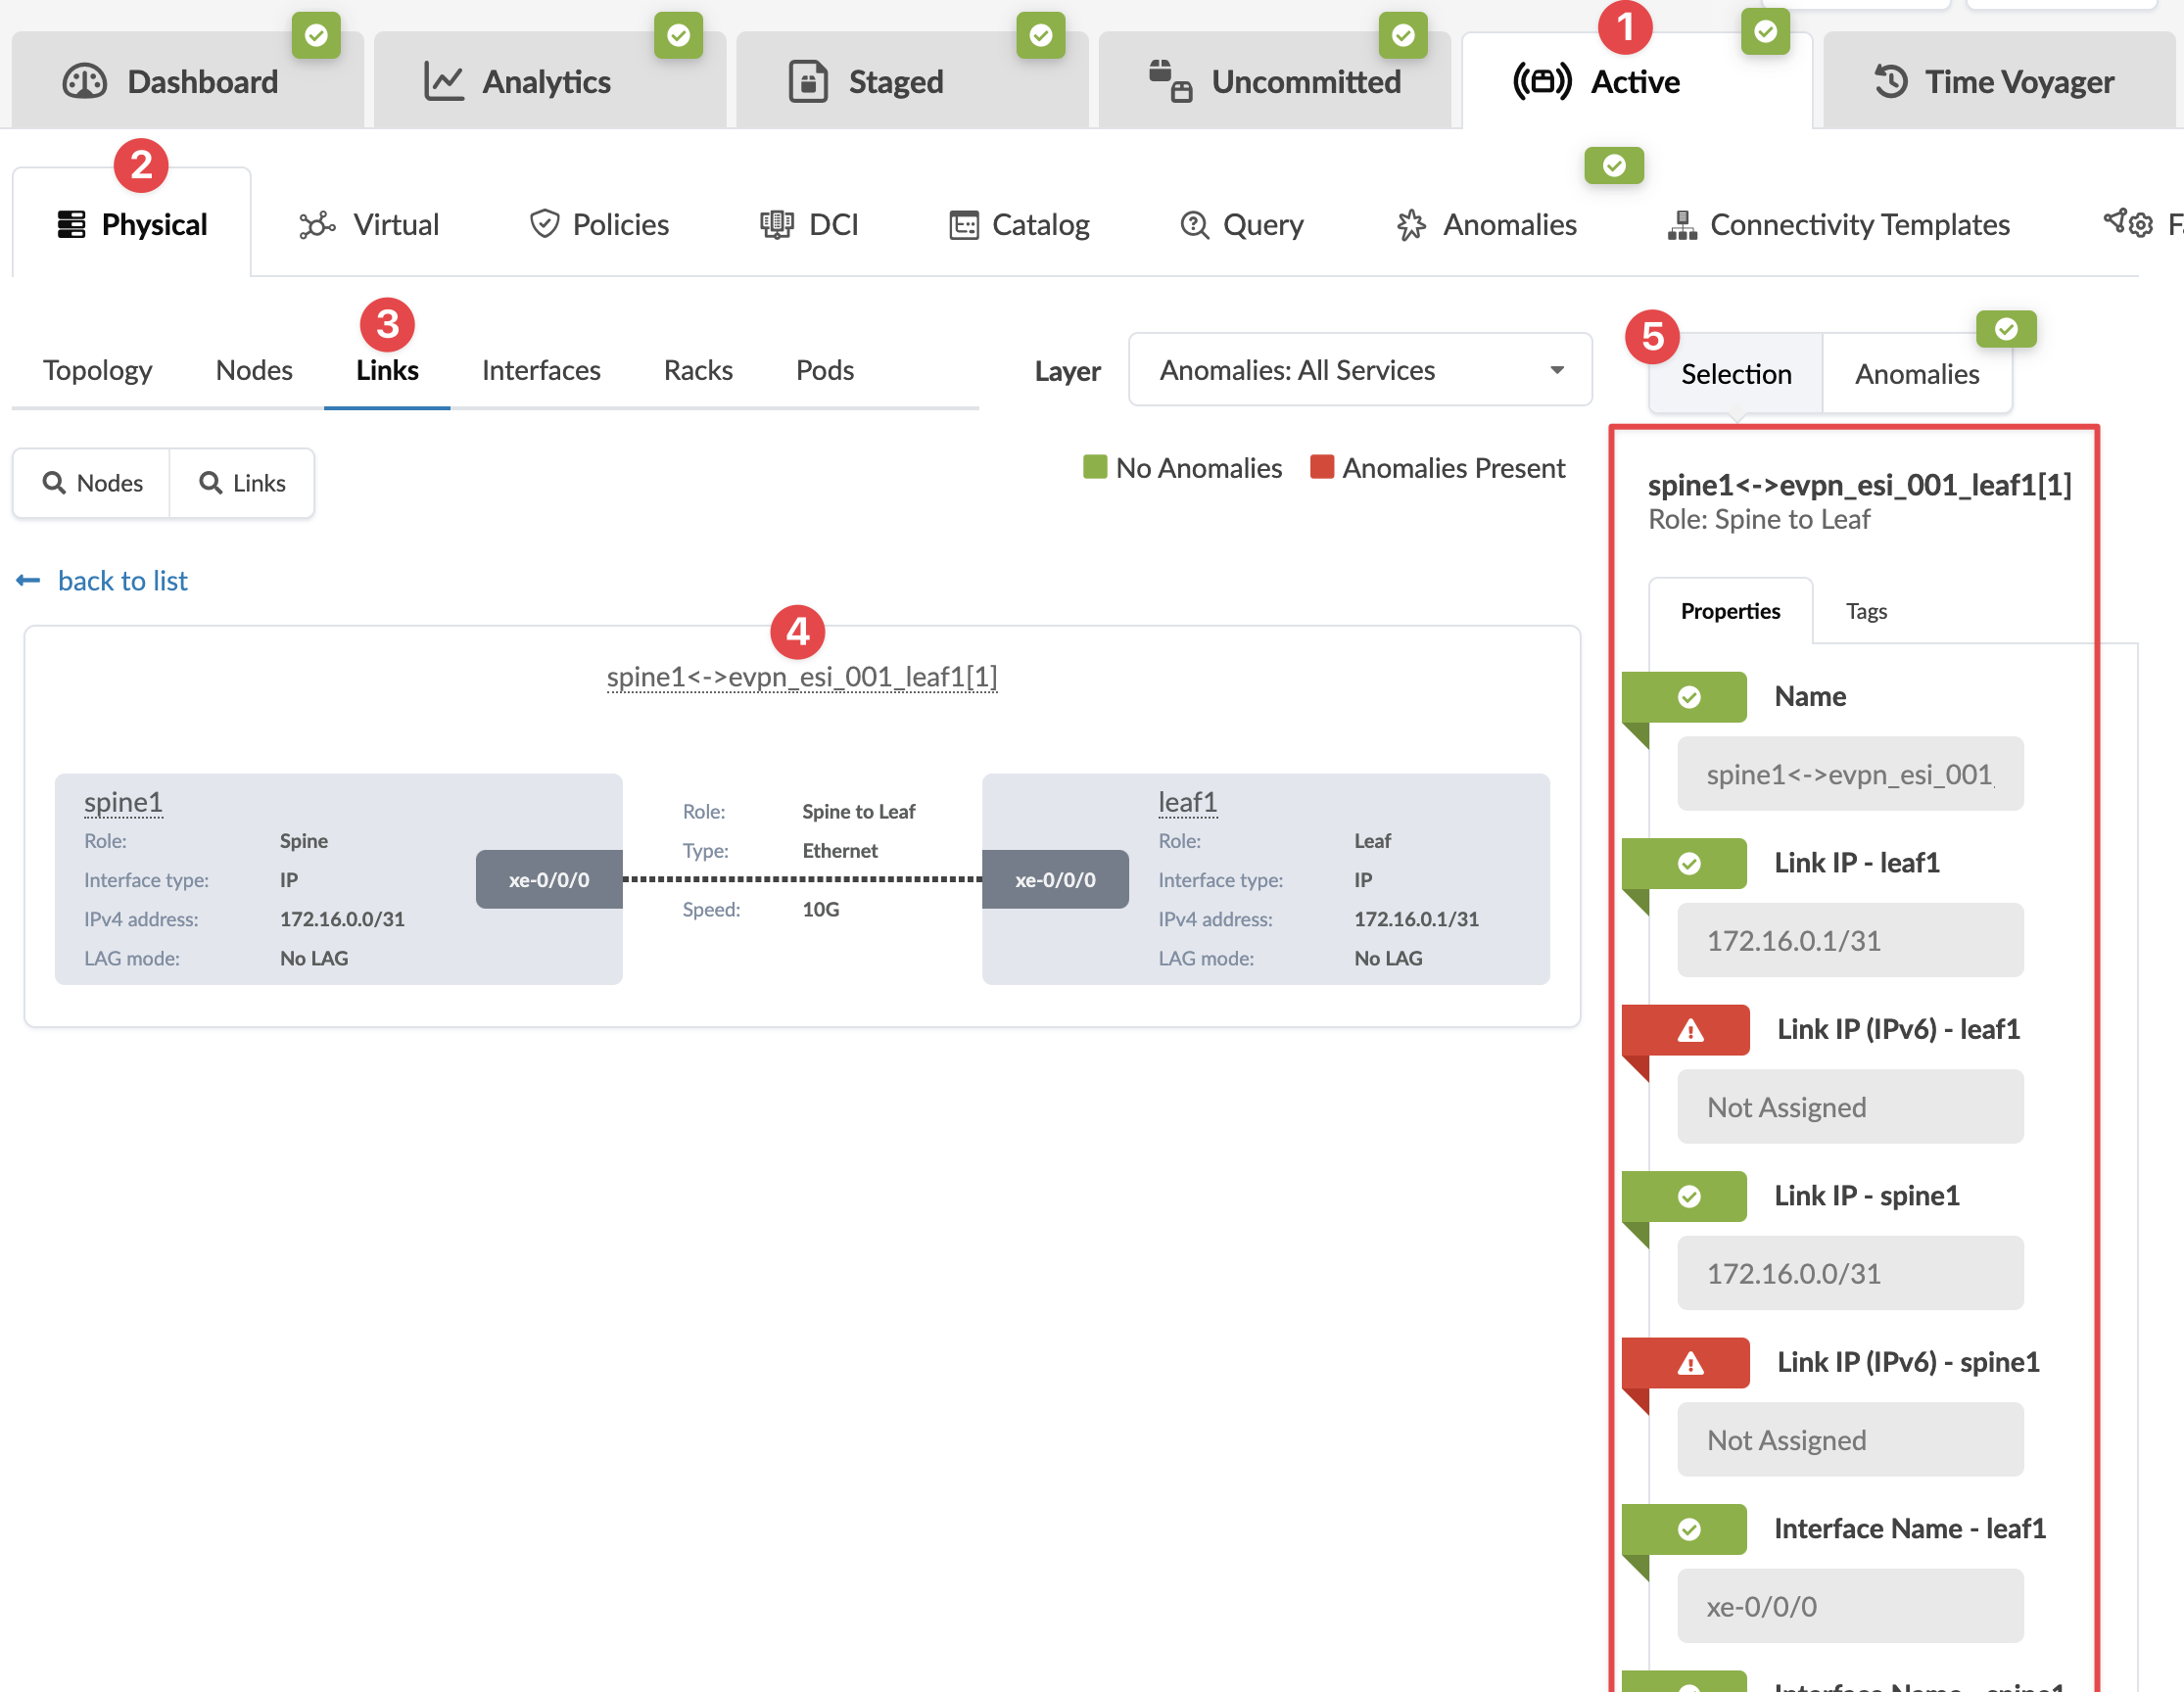
When you select a link in the active Topology or Links view, properties and tags information for that link is available in the right Selection panel.
Status Panel
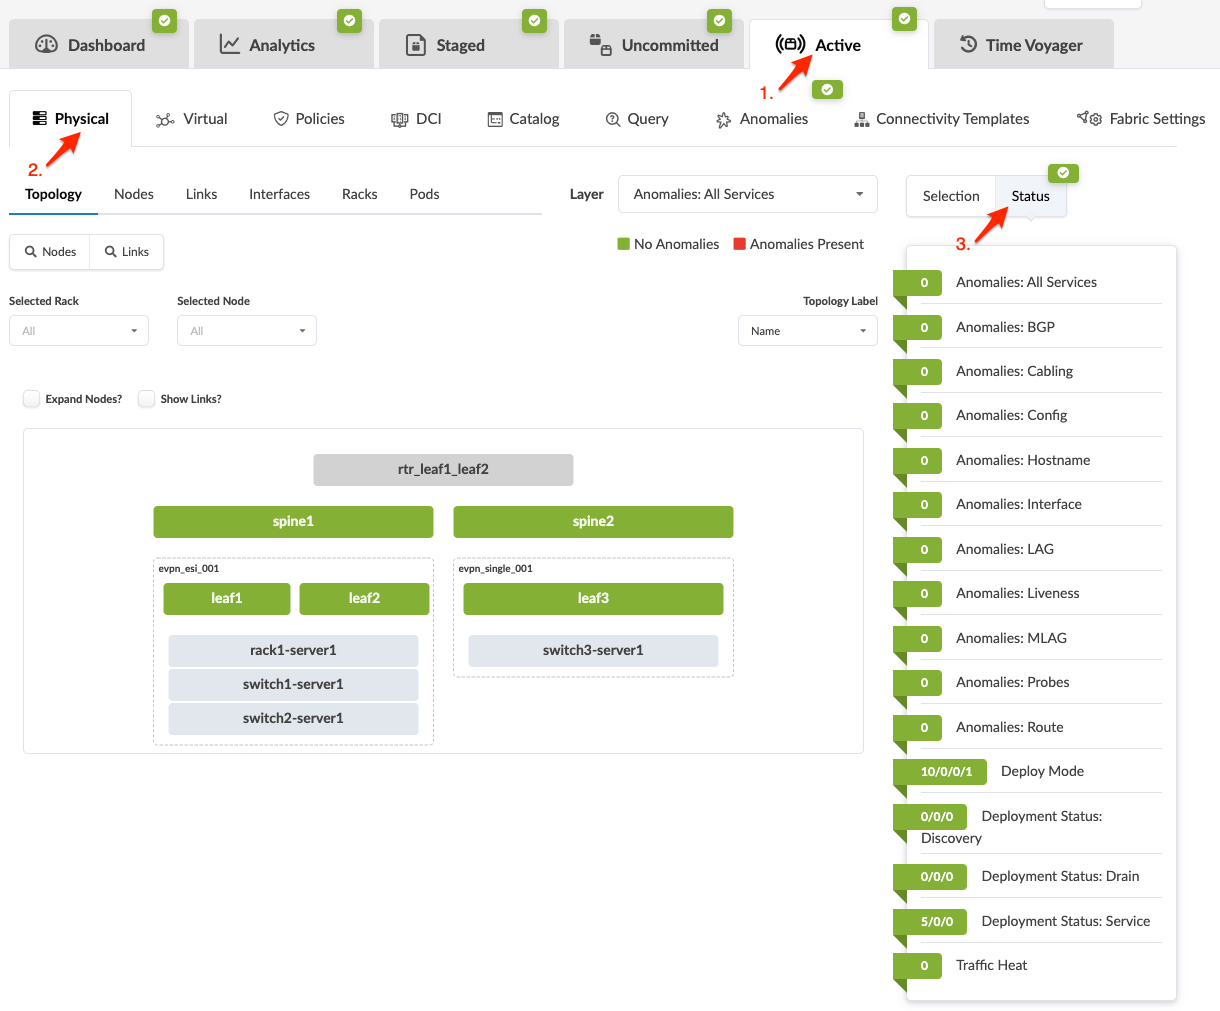
From the blueprint, navigate to Active > Physical to go to the statuses for services and deploy modes, deployment statuses for discovery, drain and service, as well as traffic heat.