Create Blueprint Analytics Dashboard

You can create your own dashboards to display custom information from IBA probes and stages.

Some probes and dashboards are automatically created to give you immediate value. The probes auto-adjust based on the state of the blueprint (examples: undeployed or unassigned device, addition or removal of virtual infra managers). You can also create your own dashboards to display custom information from IBA probes and stages.

You can create a dashboard by manually adding widgets or by cloning an existing dashboard and customizing it.

Create New Dashboard

To create a blueprint analytics dashboard using the GUI:
  1. From the blueprint, navigate to Analytics > Dashboards, click Create Dashboard, then select New Dashboard from the drop-down list.
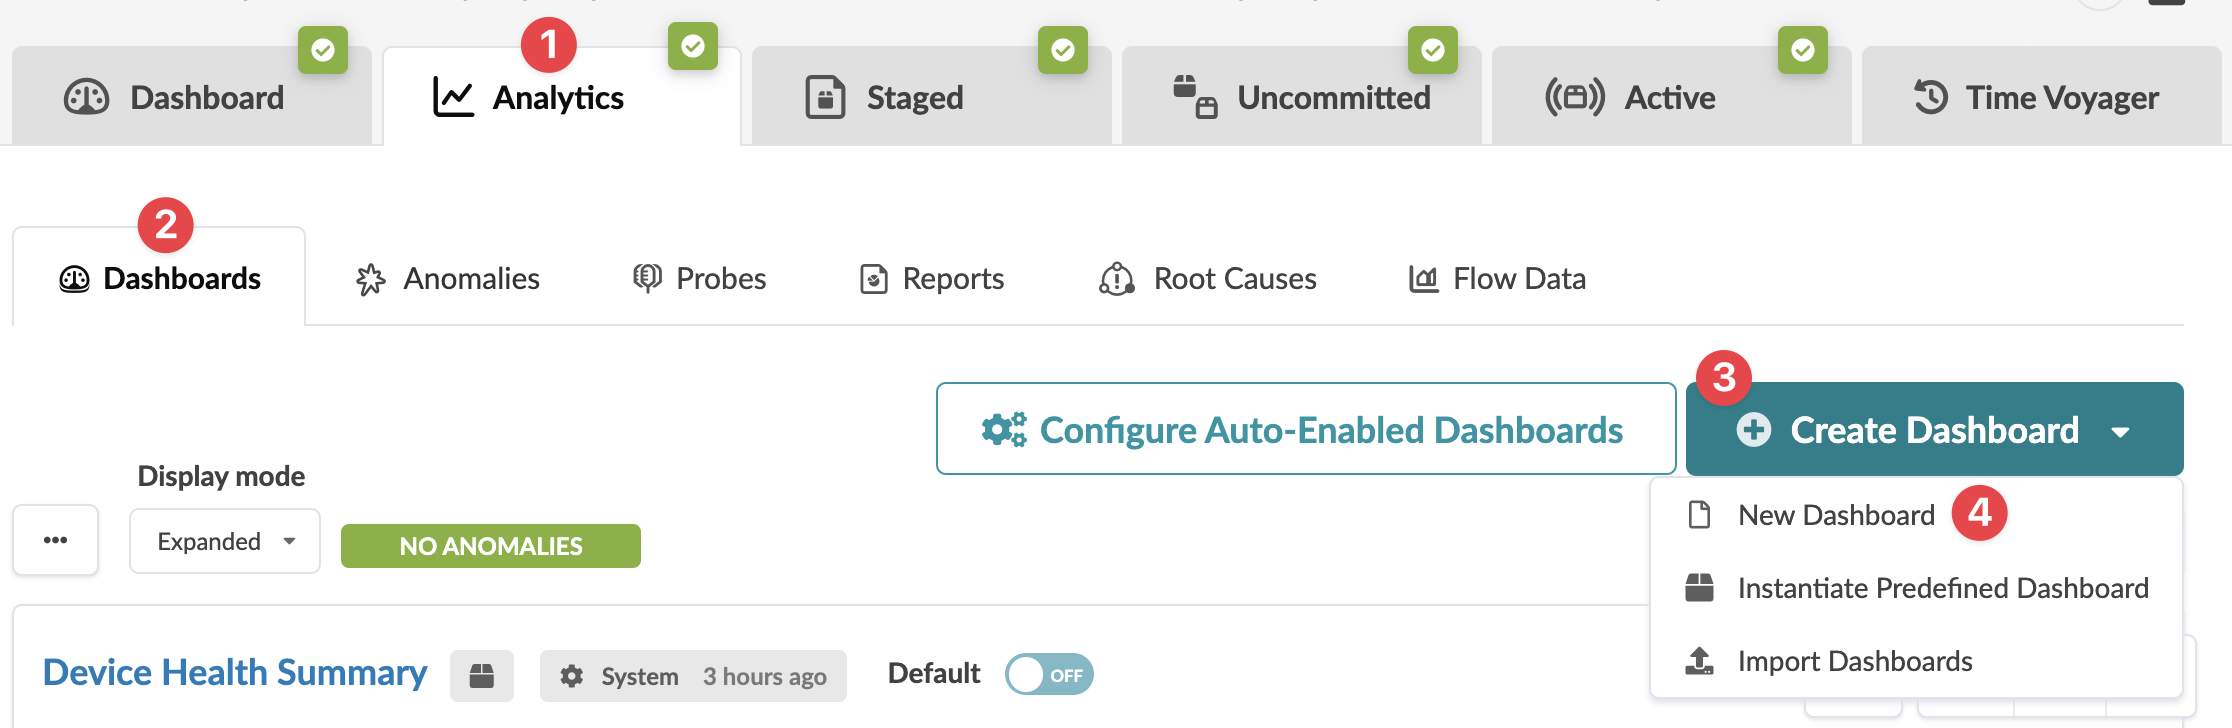
    Dashboard management interface with navigation tabs for Dashboard, Analytics, Staged, Uncommitted, Active, and Time Voyager. Options include Dashboards, Anomalies, Probes, Reports, Root Causes, and Flow Data. Features Create Dashboard button with dropdown, Configure Auto-Enabled Dashboards, and Display mode with Expanded view. Device Health Summary shows System status and toggle set to OFF.
    The New Dashboard page opens.
  2. Enter a unique name and (optional) description.
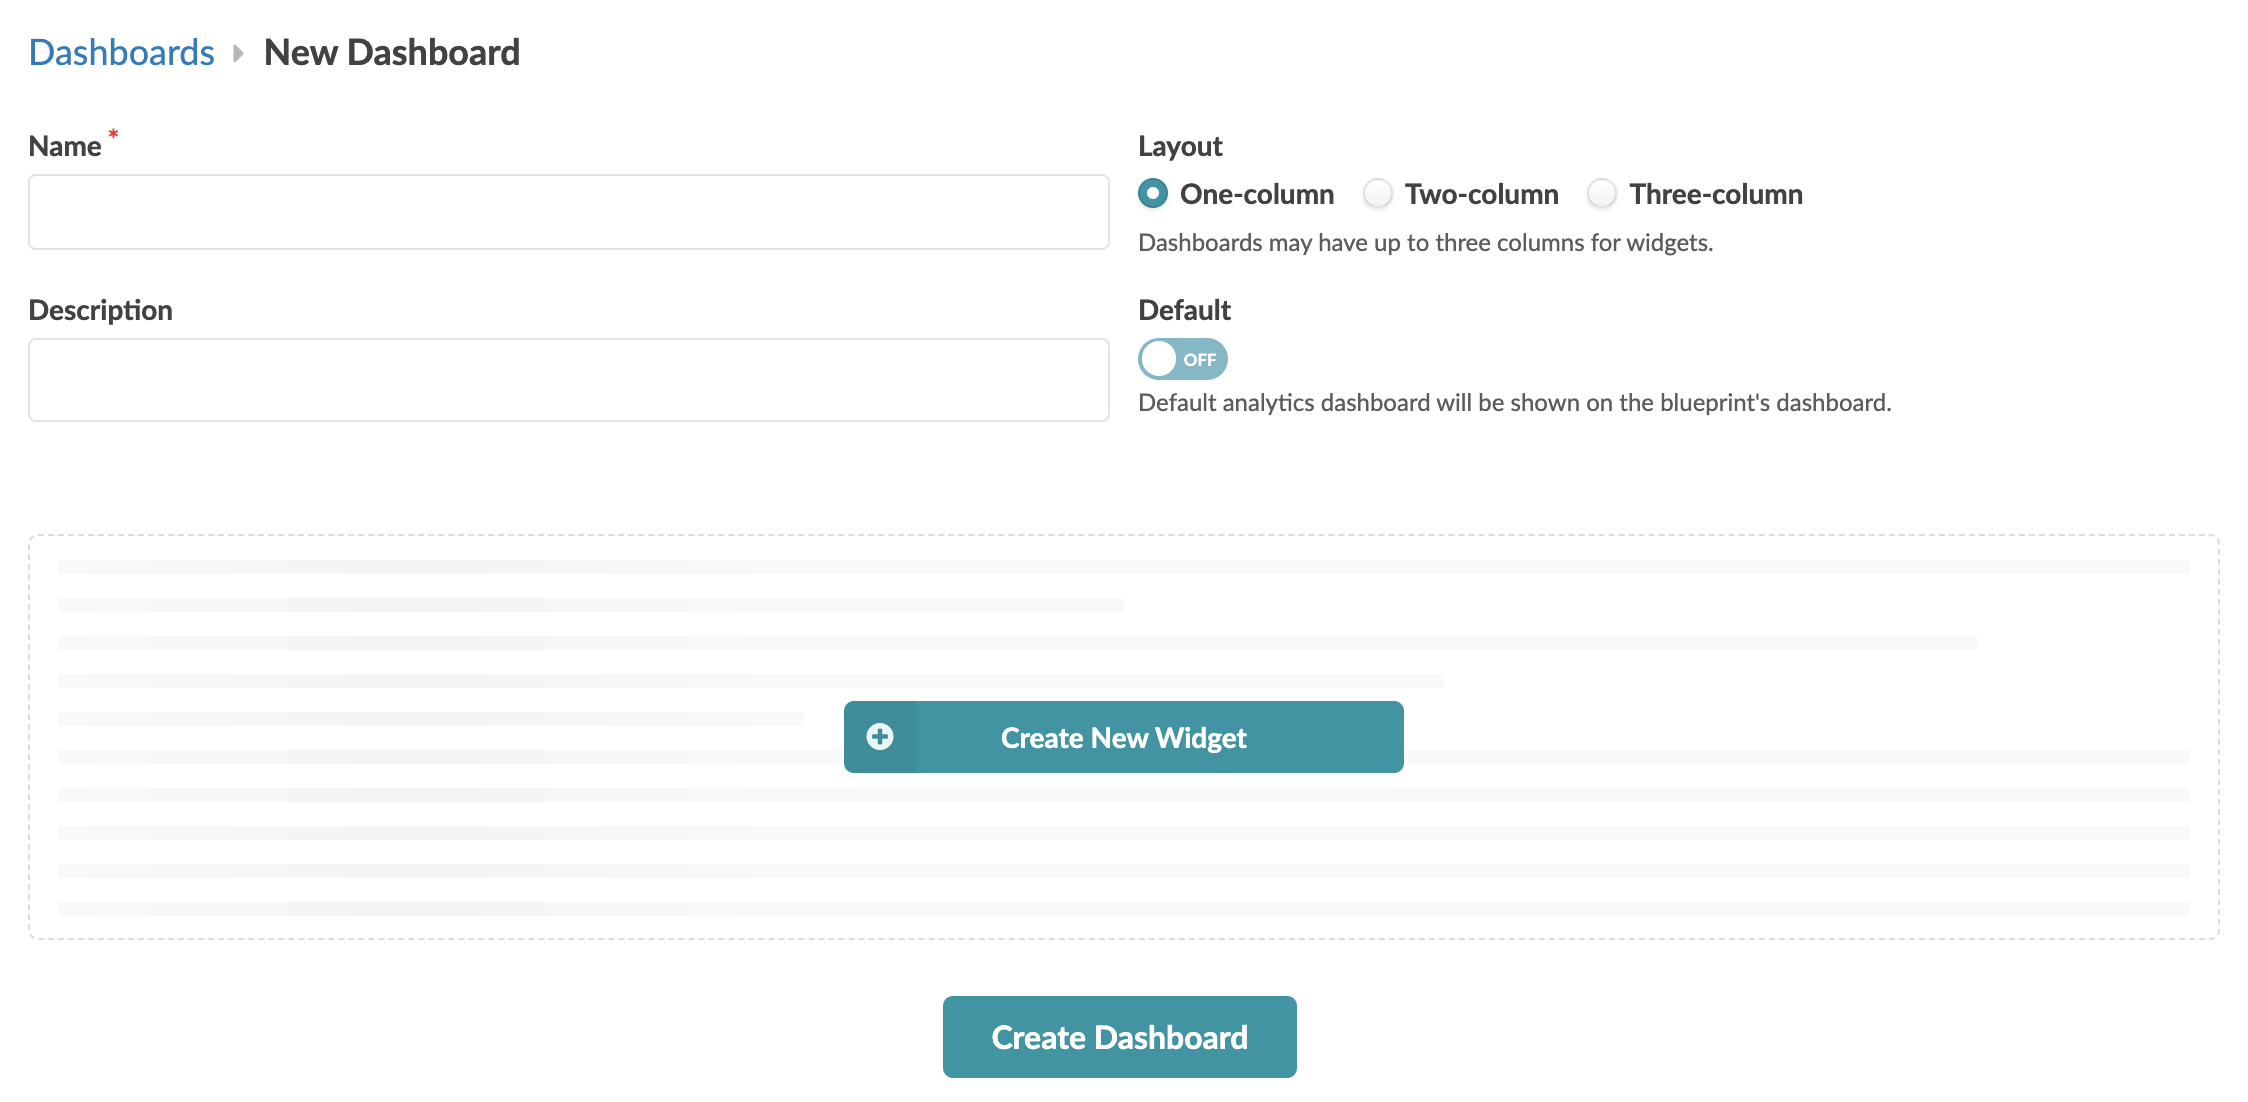
    User interface for creating a new dashboard with fields for name and description, layout options, default toggle, widget creation button, and create dashboard button.
  3. Select a layout (one-column, two-column, three-column) and if you want the dashboard to appear on the blueprint Dashboard tab, toggle on Default.
  4. Click Create New Widget.
    The Create Widget dialog opens.
  5. Enter a widget name, select a probe and one of its stages from the drop-down lists, then customize details as needed.
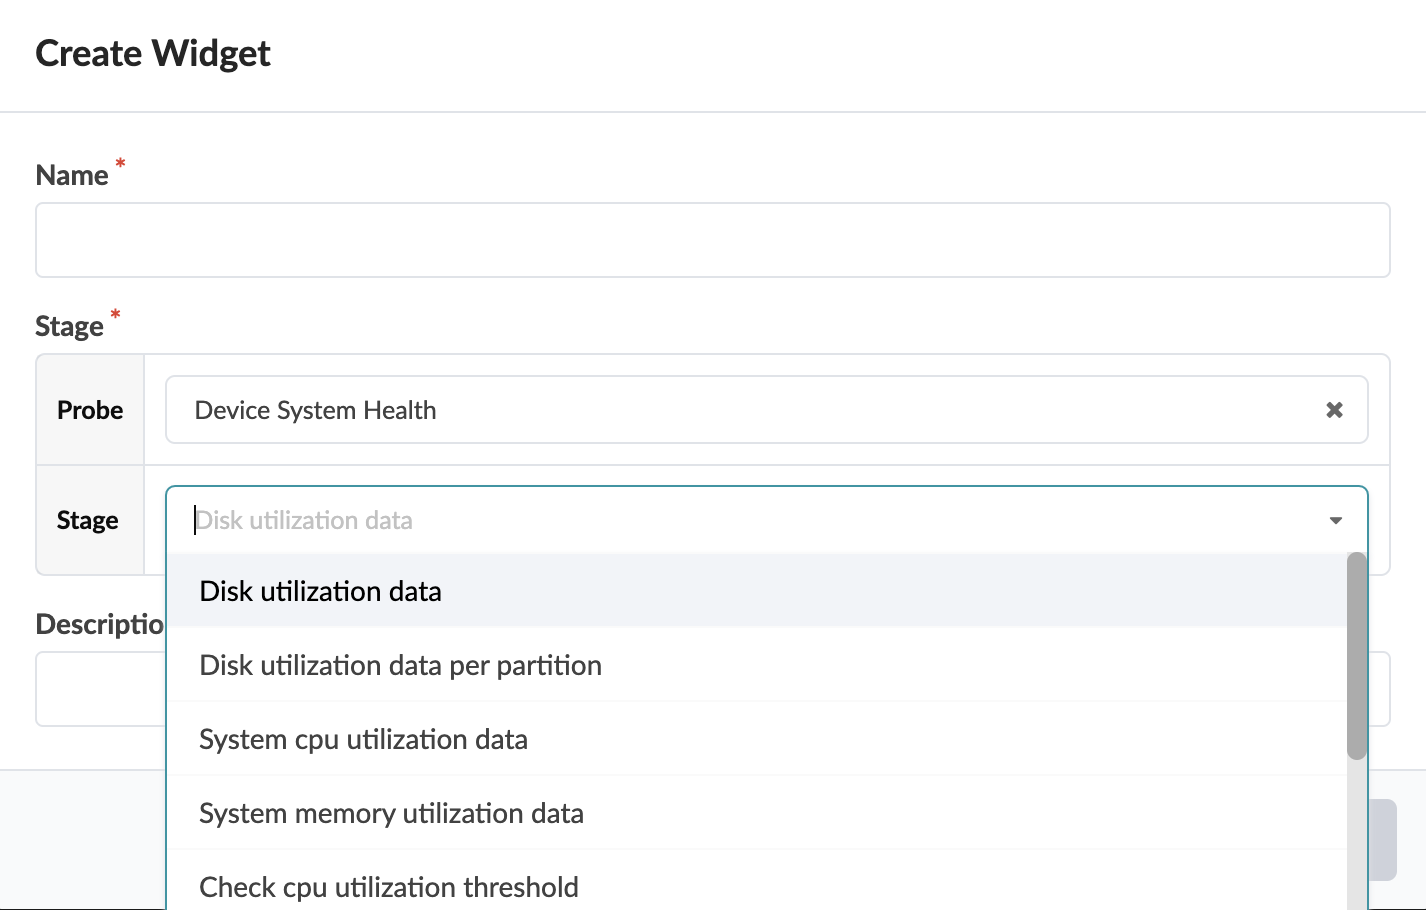
    User interface for creating a widget with fields for name, stage, and description. Stage dropdown shows options like disk utilization, CPU, and memory data. Probe set to Device System Health.
  6. Add additional widgets in the same manner as above, as needed.
  7. Click Create Dashboard.

    A large dashboard may take some time to create. You can monitor the status at the bottom of the screen under Active Tasks.

The dashboard is created and you're taken to the details view of the new dashboard.

Clone Existing Dashboard

To copy an existing dashboard using the GUI:
  1. From the blueprint, navigate to Analytics > Dashboard and click the Clone button (top-right of dashboard) for the dashboard to copy.
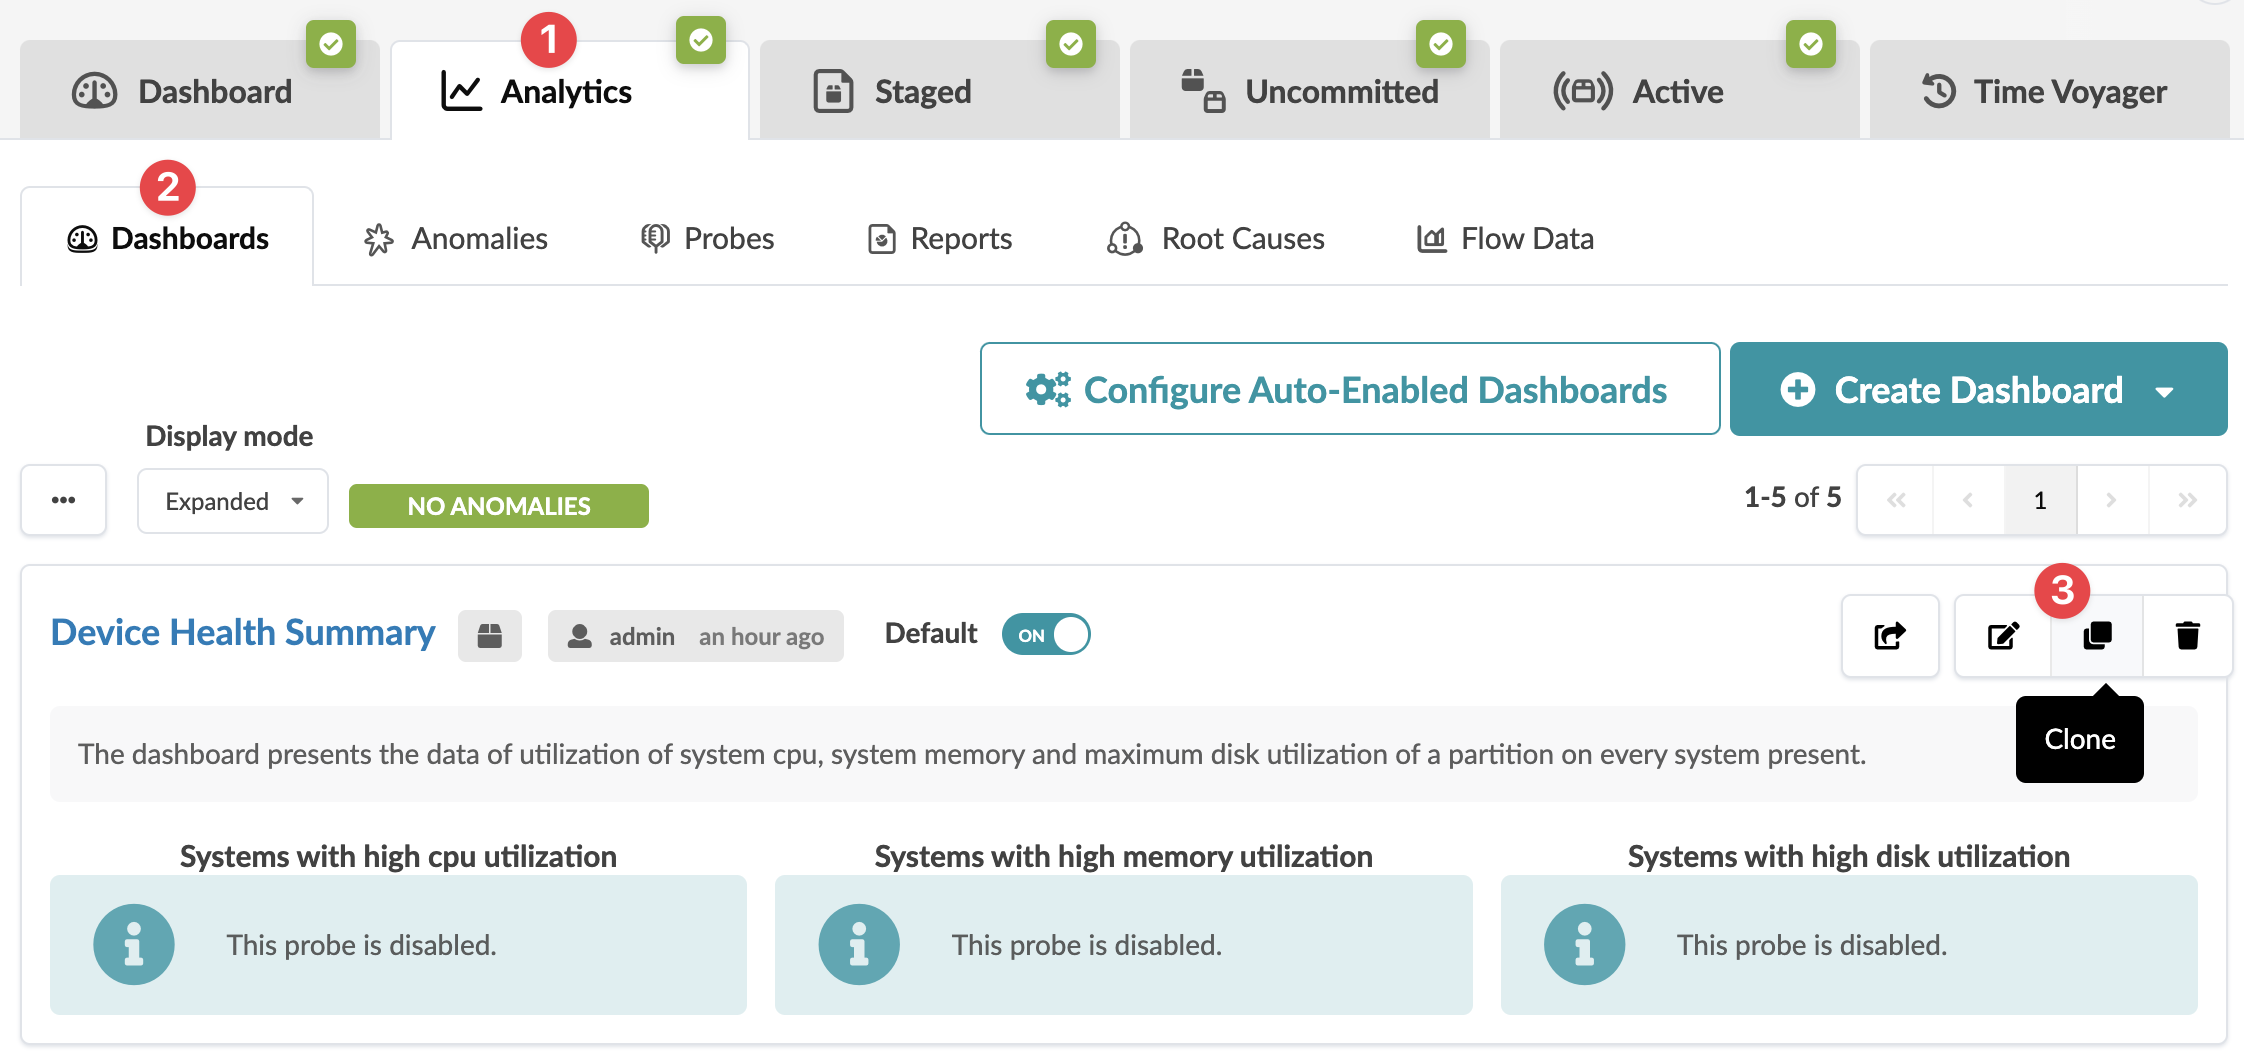
    Dashboard interface showing active Analytics tab with options for Staged, Uncommitted, Active, and Time Voyager. Dashboards section is selected, displaying Device Health Summary with data on CPU, memory, and disk utilization. Clone icon tooltip is visible. Pagination shows 1-5 of 5 dashboards.
    The Clone page for the selected dashboard opens.
  2. The dashboard name must be unique. Make your changes to customize the copied dashboard by creating, editing and/or removing widgets. Various other fields can be changed as well.
  3. Click Create Dashboard.

    A large dashboard may take some time to create. You can monitor the status at the bottom of the screen under Active Tasks.

The dashboard is created and you're taken to the details view of the new dashboard.