Collect Show Tech (GUI)

You can collect the following show tech files from the HPE Networking Apstra Data Center Director GUI:
  • Apstra DC Director controller

  • Apstra DC Director workers (new in Apstra version 5.0.0)

  • Connected device agents (onbox and offbox)

  • Flow Data

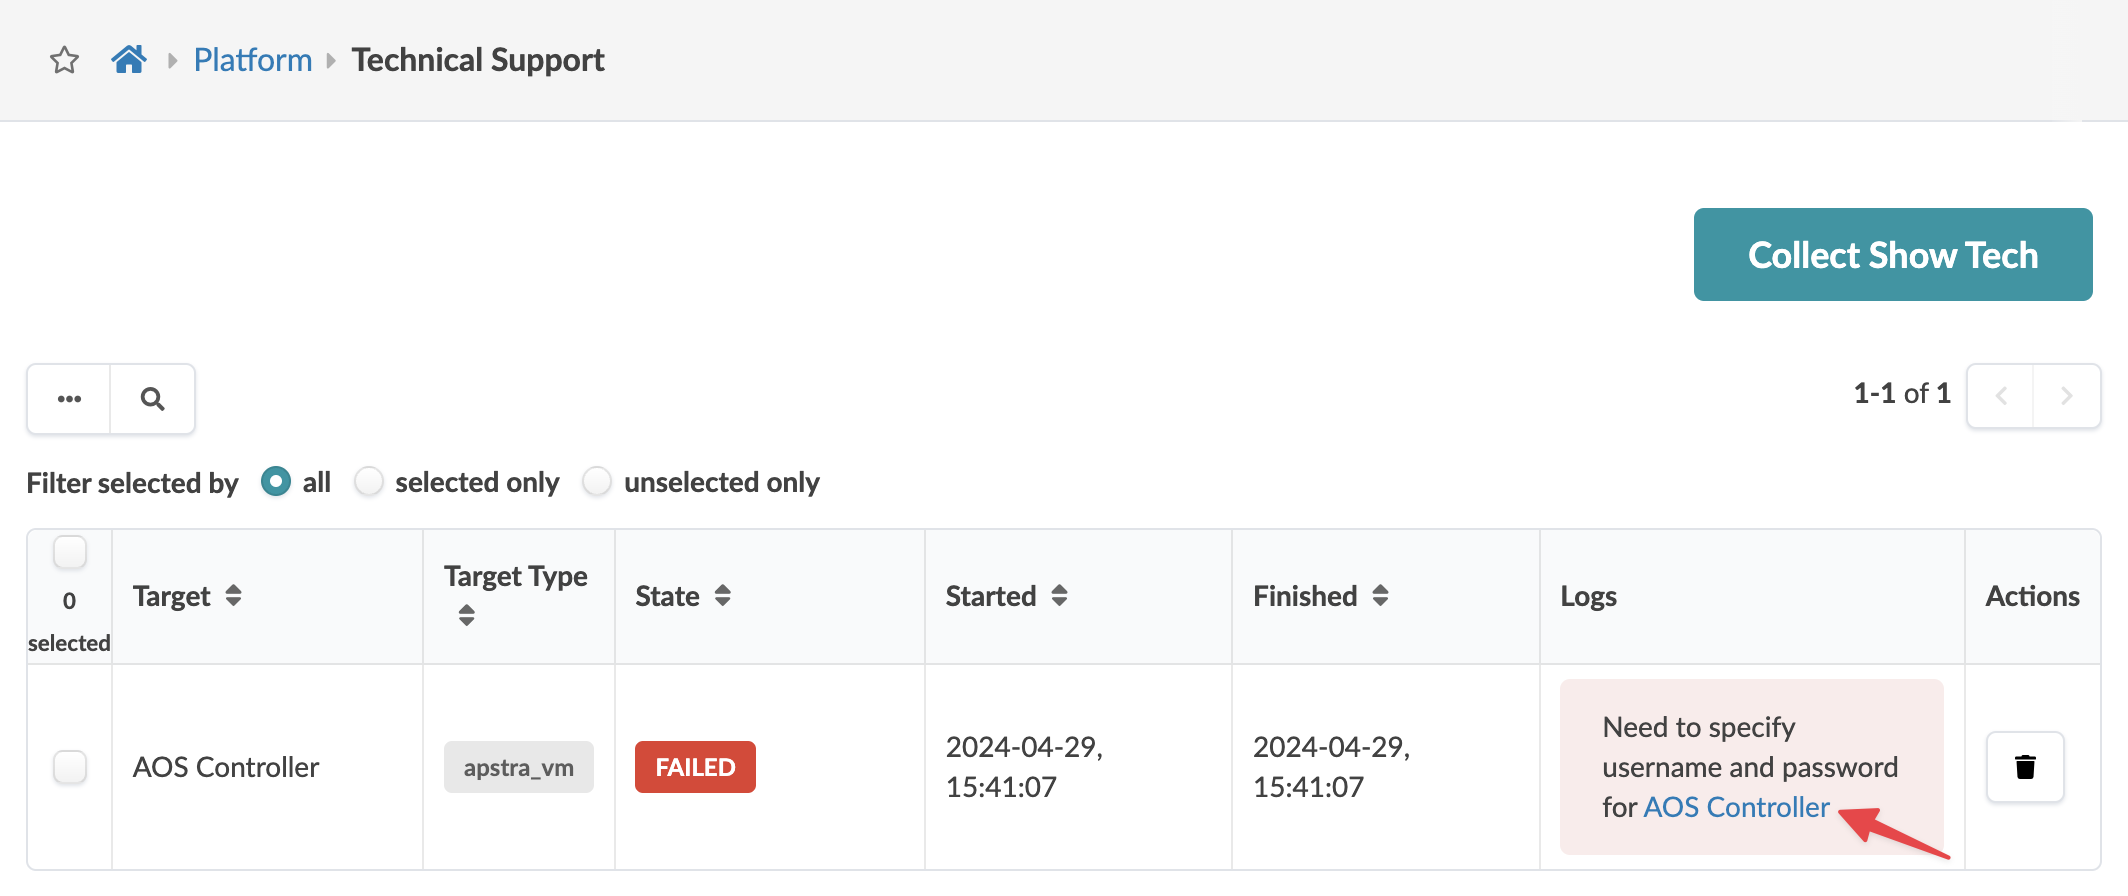
If you haven't configured local credentials for the Apstra DC Director controller, from the left navigation menu, navigate to Platform > Apstra Cluster and edit the controller to configure credentials. (These are the credentials you use for the VM console or SSH.)
  1. From the left navigation menu, navigate to Platform > Technical Support and click Collect Show Tech.
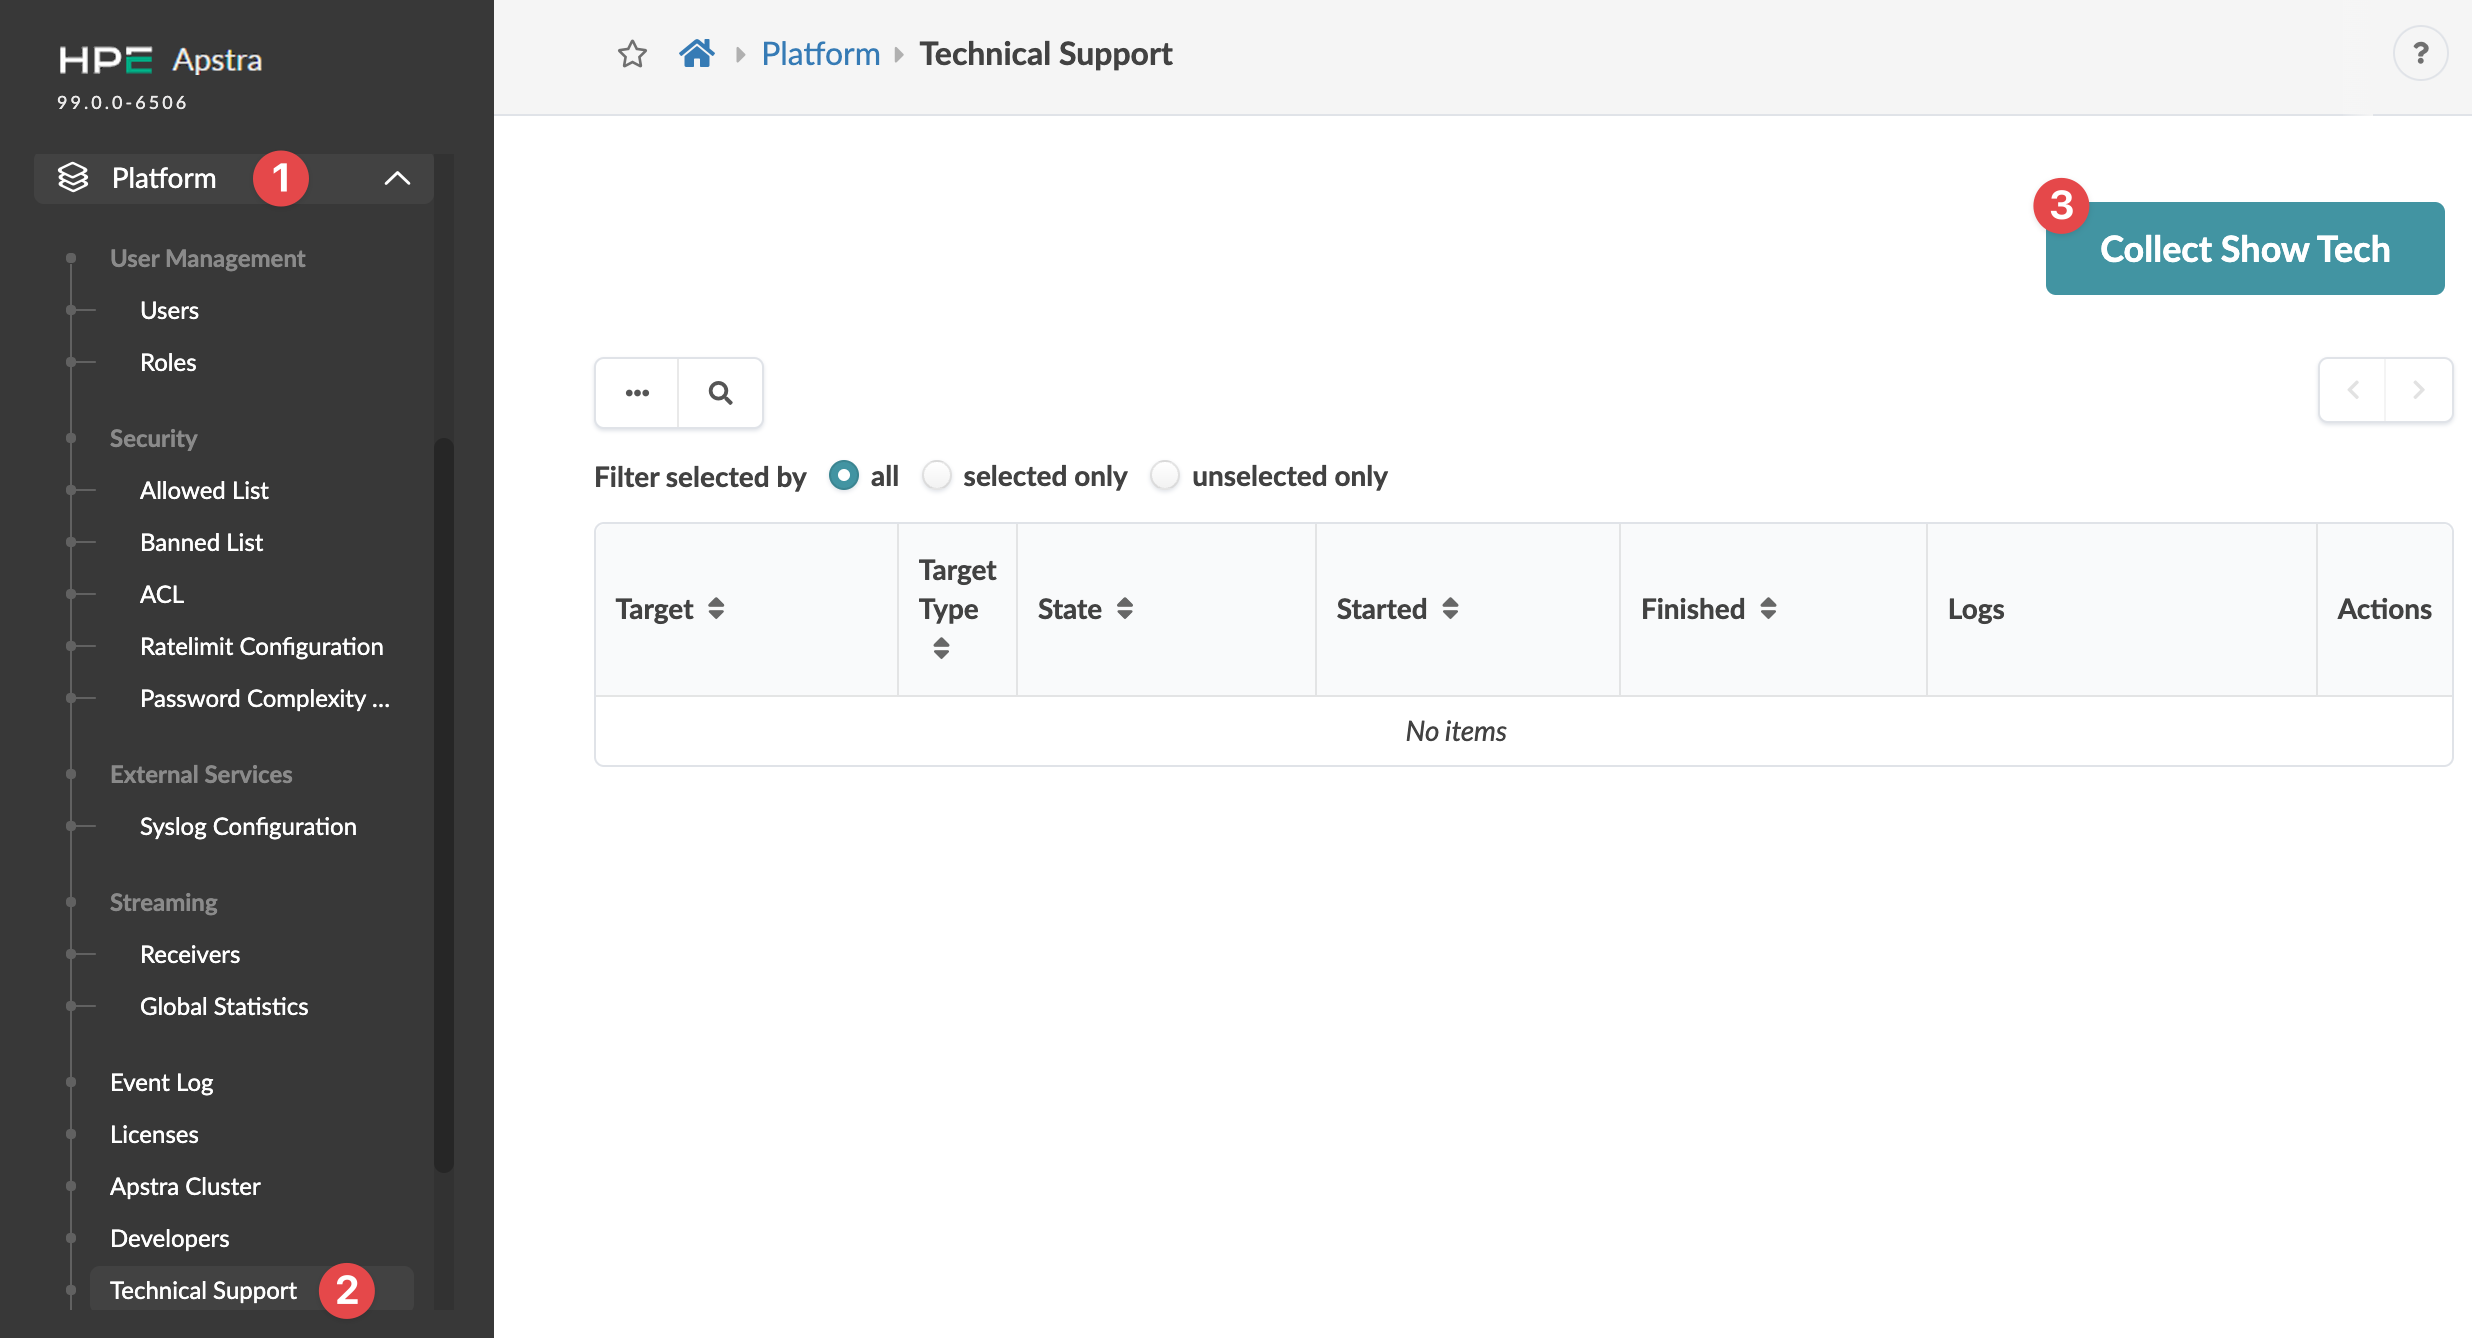
    Juniper Apstra Technical Support section with a navigation menu and a table showing no items. Collect Show Tech button on right.
    The Collect Show Tech dialog opens.
  2. Select the check box for Apstra VMs to see the table of available VMs (the controller and any workers).
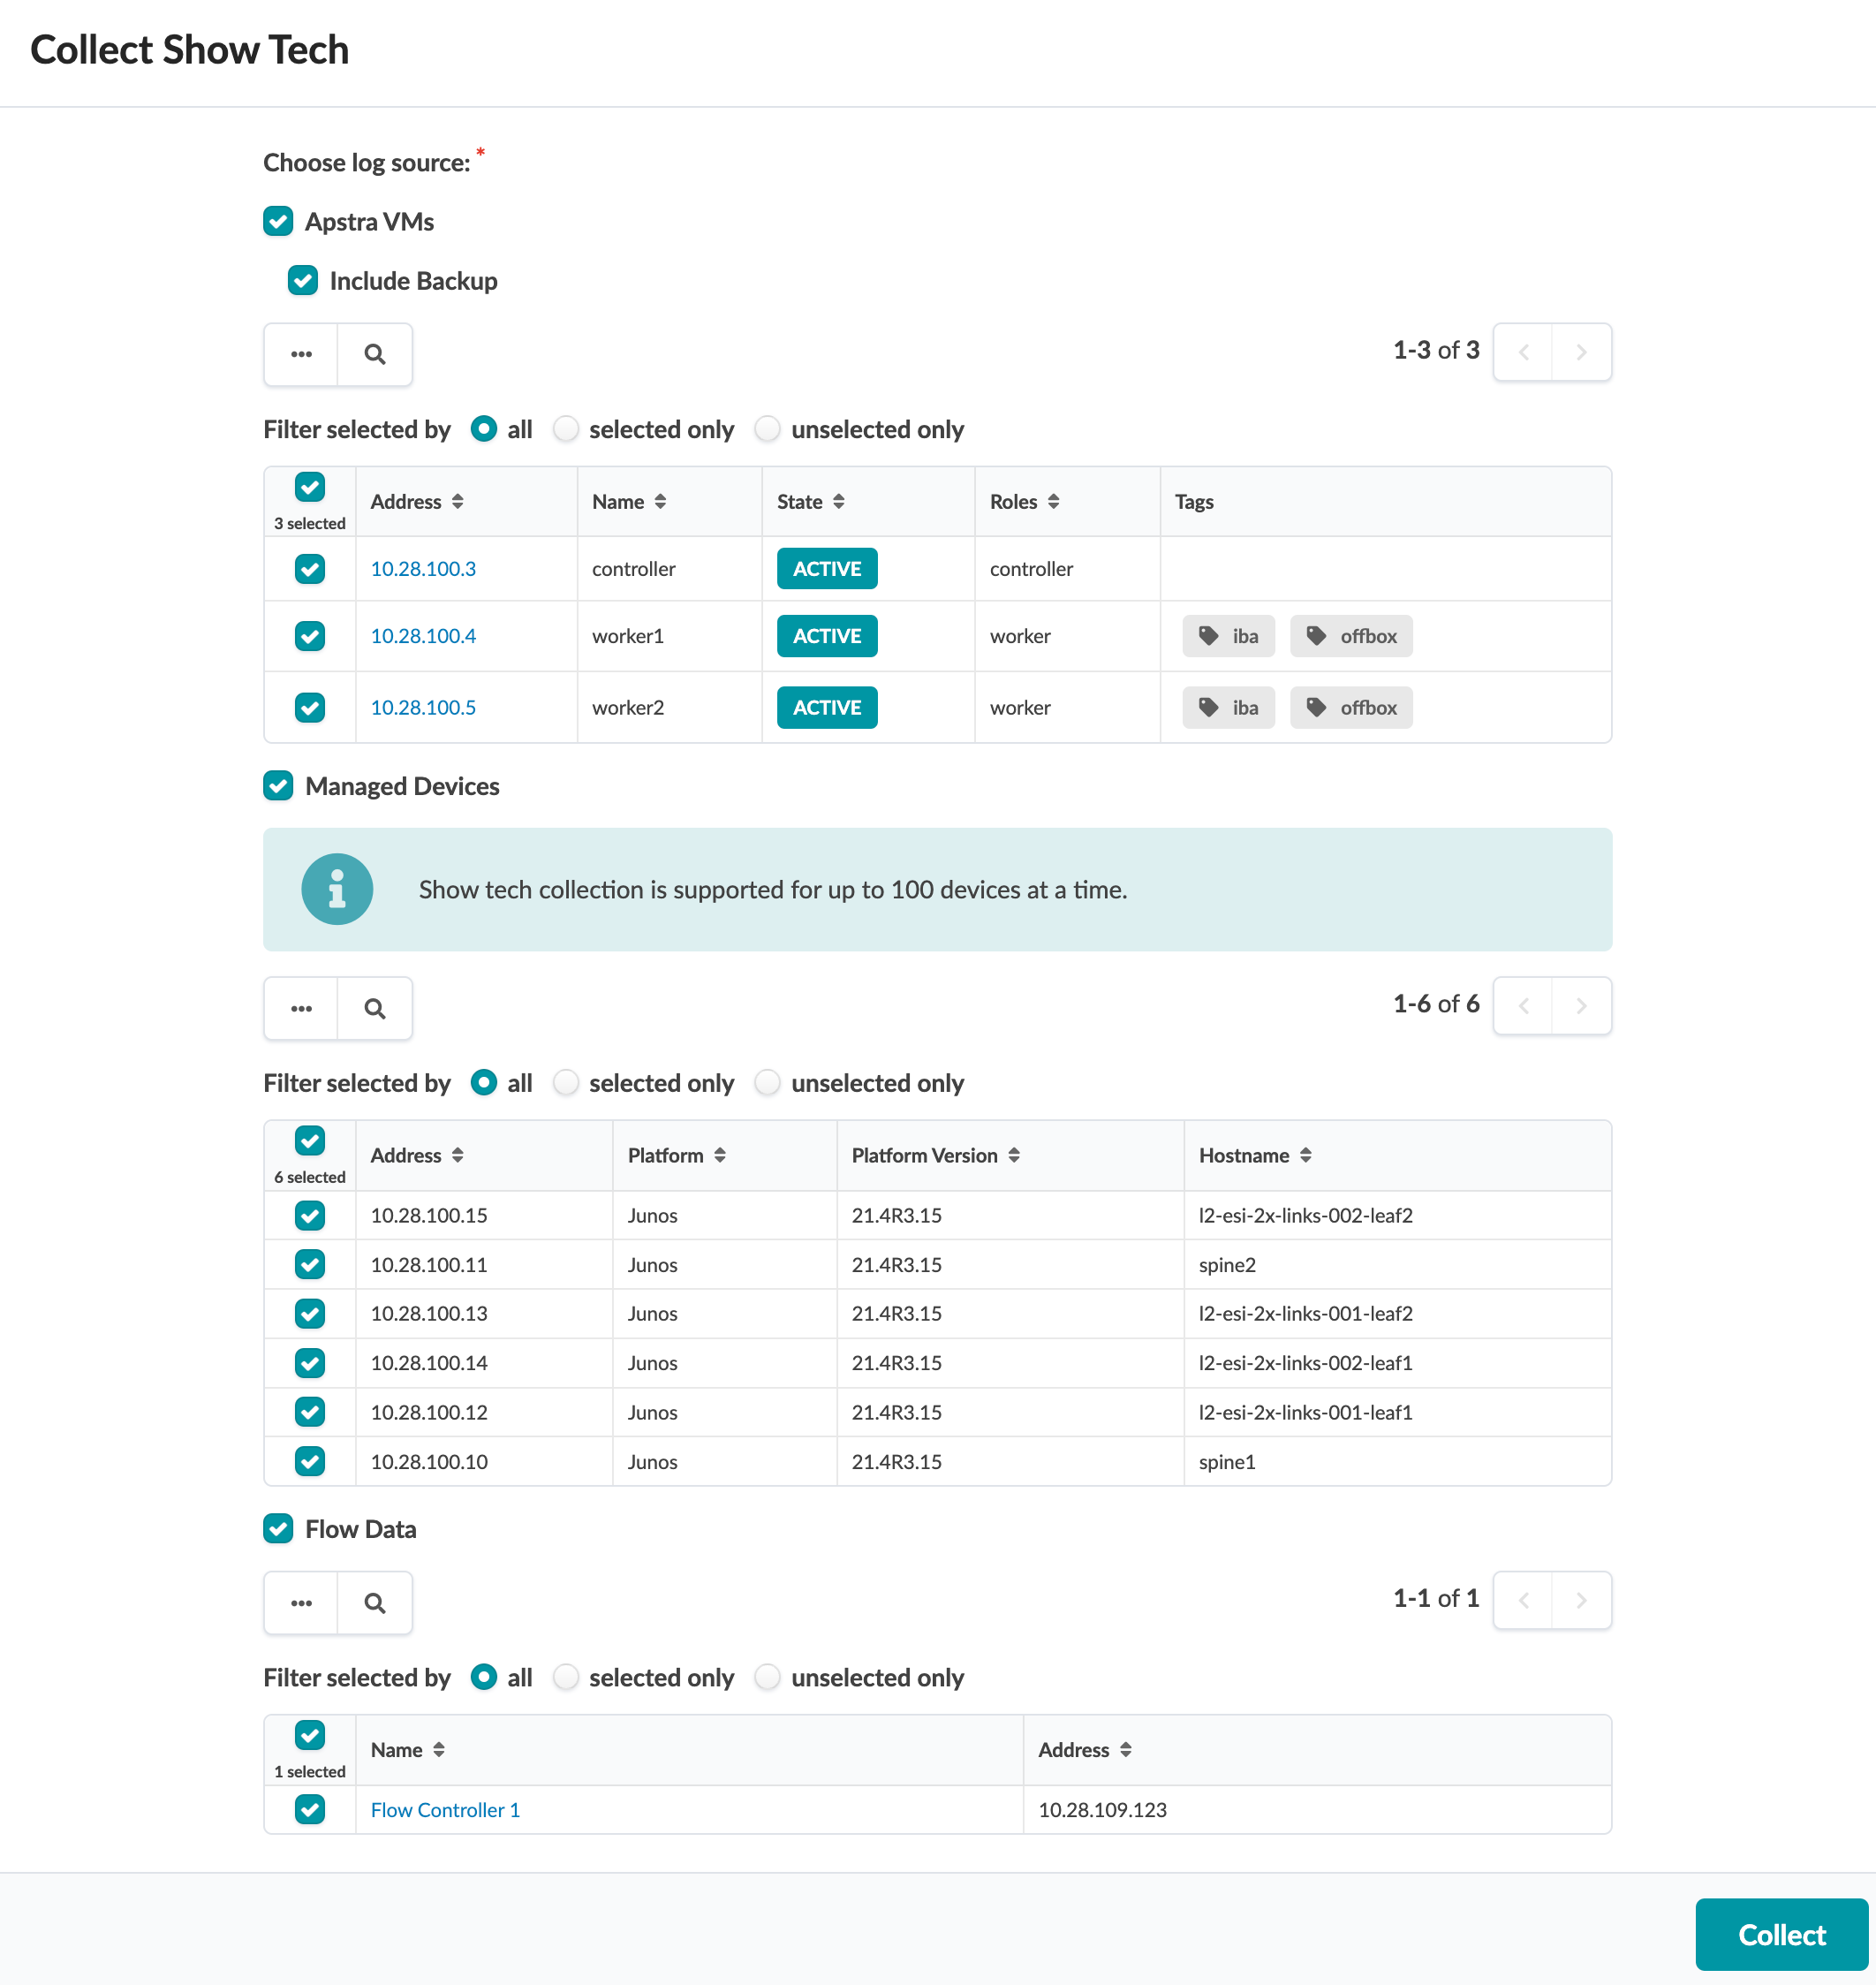
    Collect Show Tech interface for selecting log sources and devices. Options include Apstra VMs, Managed Devices, and Flow Data. Collect button at bottom.
  3. Select the check boxes for the VMs that need show tech collected.
  4. You can collect show_tech from the GUI that includes a copy of the backup. If Juniper Support requests a backup, select the Include Backup check box. This backup provides information for Support and Engineering. It doesn't include credentials, so it's not suitable for restoring your production environment. (Use backups from the Back Up Apstra Database procedure instead.)
  5. Select the check box for Managed Devices to see the list of managed devices (devices with agents that have been acknowledged).
  6. Select the check boxes for the devices that need show tech collected.
    Note:

    When device show tech is collected, the configured device system agent username and password authentication are used. If you've configured the device to use a different authentication (AAA) method with a different username and password (such as RADIUS and TACACS) you can't collect show tech from the GUI. You must collect show tech with CLI.

  7. If you're using Flow Data and would like to collect show tech for it, check the Flow Data check box, then select check boxes for the flow controllers that need show tech collected.
  8. Click Collect to start the collection process.
    Note:

    For Apstra server controllers with large databases, the operation may timeout. If this happens, you must collect show tech using the CLI.

    Tip:

    If the image below appears, you still need to configure local credentials on the node. Click the link to go to the controller node screen, click the Edit button (right side), then enter the username and password you use for the VM console or SSH.Technical support interface showing a table with a failed AOS Controller entry needing username and password.

  9. After the jobs are complete and marked SUCCESS, click the download button for each of the files (under Logs).
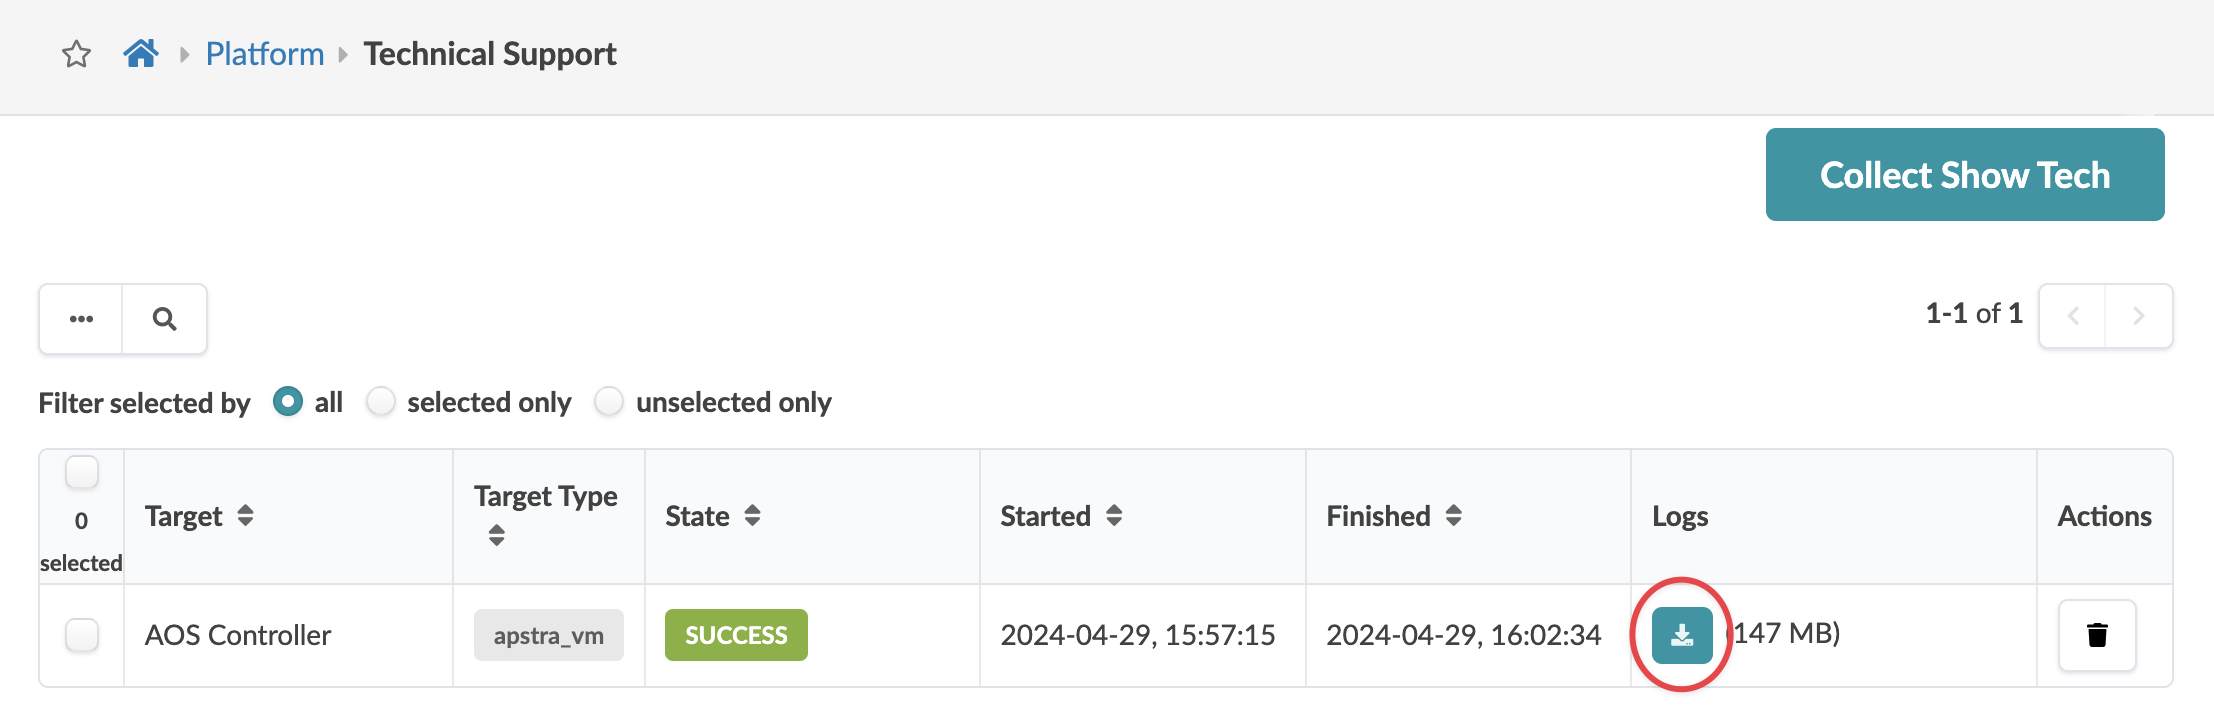
    Technical Support interface showing a log collection table with one entry for AOS Controller, status SUCCESS, logs 147 MB downloadable.
    Tip: After the files have been downloaded, you can free up disk space by deleting jobs.
  10. From a computer with the ability to upload, upload the show tech files to your customer case.