Show Context Patterns

The IBA probes' Show Context value column can be one of five patterns.

The five patterns are described below:

Pattern #1 - Shows outliers of a time series numeric metric

Pipeline
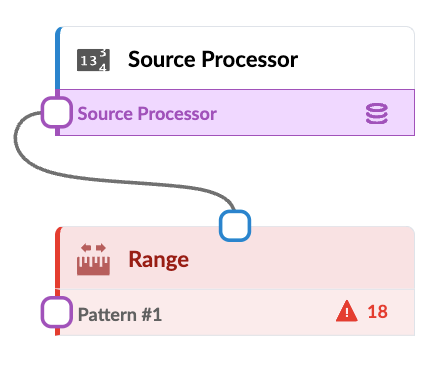
Data processing workflow with Source Processor in purple fetching data and Range in red with warning icon 18.

Output Stage

Network monitoring dashboard showing spine1 switch interface Ethernet3/1/1 with anomaly detected. Value is 7288385 within range 6000000 to 8000000. Graph shows trend with red markers for anomalies. Updated 3 minutes ago.

Pattern #2 - Shows current state and history of sustained outliers of an instantaneous numeric metric.

Pipeline
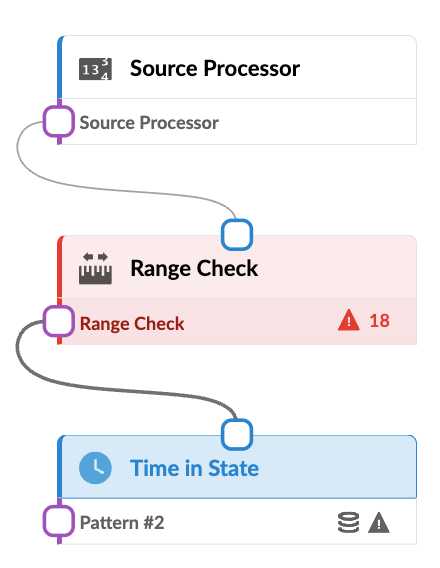
Flow diagram with three components showing data process: Source Processor with blue border, Range Check with red box and warning symbol 18, Time in State with blue box and clock icon. Purple and blue connectors indicate sequence.

Output Stage

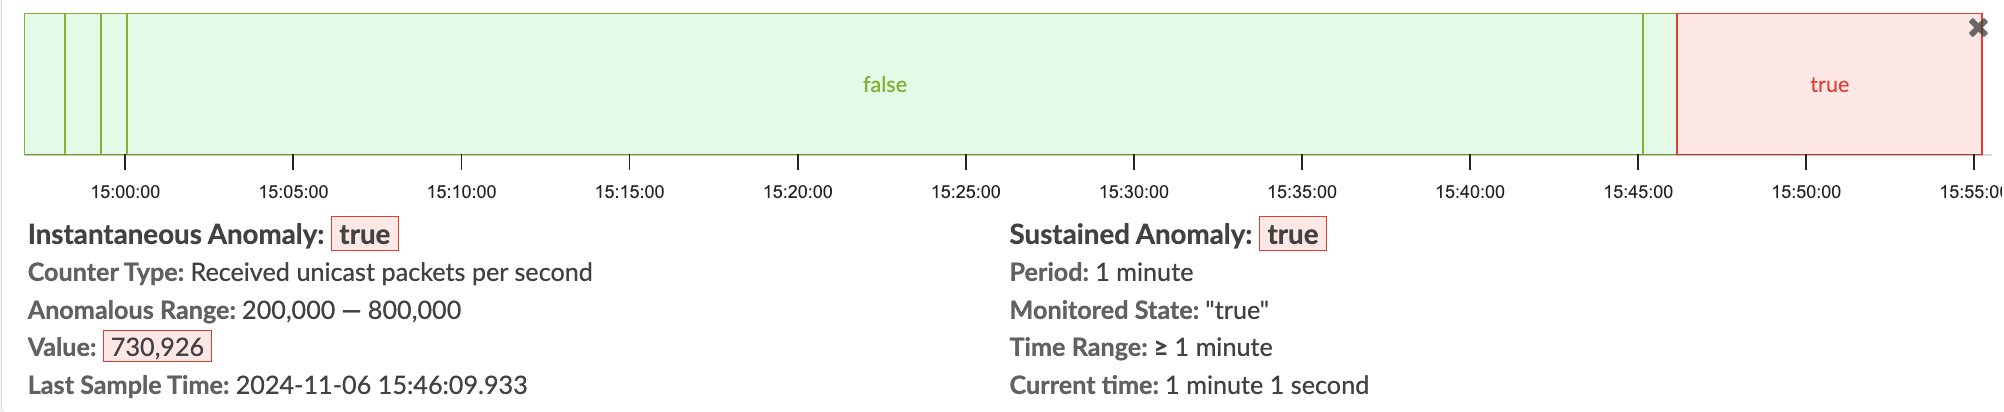
Graph showing anomaly detection in network traffic. Time ranges from 15:00:00 to 15:55:00. Green sections indicate no anomaly; red sections indicate anomalies. Instantaneous anomaly detected with received unicast packets per second in the range 200000 to 800000. Current value is 730926. Last sample time is 2024-11-06 15:46:09.933. Sustained anomaly detected for 1 minute. Monitored state is true.

Pattern #3 - Shows current state and history of sustained outliers of a time series numeric metric.

Pipeline
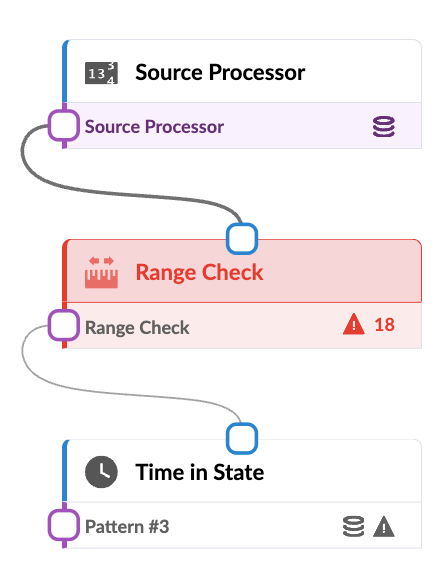
Flow diagram with three components: Source Processor in purple as the starting point; Range Check in red with warning icon and 18 alerts; Time in State with clock icon labeled Pattern 3, no alerts.

Output Stage

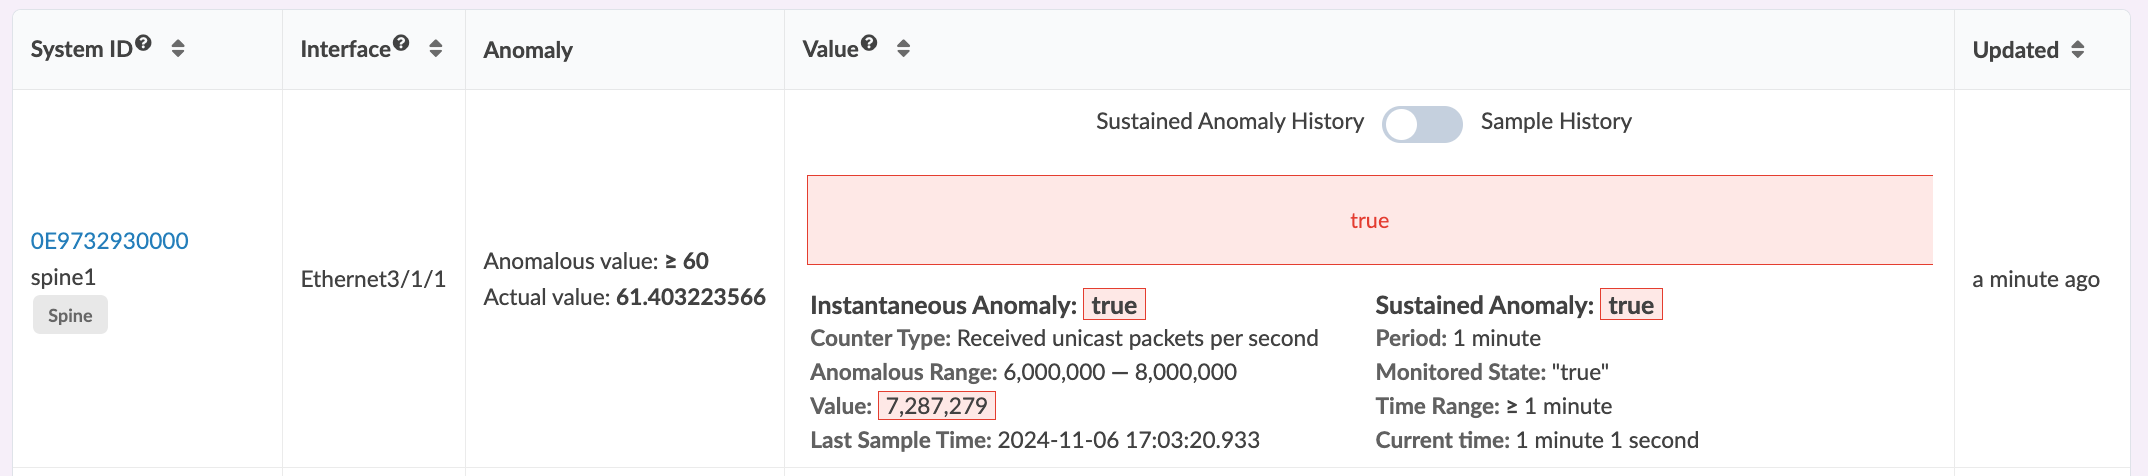
Monitoring dashboard displaying network anomaly detection on system spine1, Ethernet3/1/1. Anomalous unicast packets per second detected. Current value 7,287,279. Anomaly flagged true. Data updated a minute ago.

Pattern #4 - For each group of series show the number of series which instantaneous values are inside/outside of expected ranges.

Pipeline
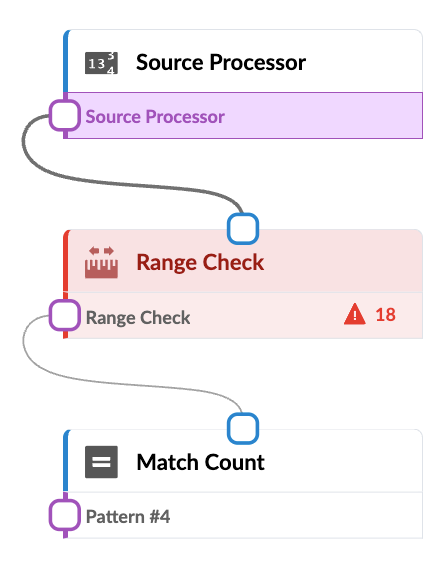
Flow diagram with three blocks: Source Processor, Range Check with 18 errors, and Match Count processing Pattern #4.

Output Stage

Dashboard displaying system ID 0E9732930000 named spine1 with a warning gauge at 1 out of 5 updated 4 minutes ago.

Pattern #5 - For each group of series calculate how many series have anomalous values. If this number exceeds a threshold, the whole group is considered anomalous.

Pipeline
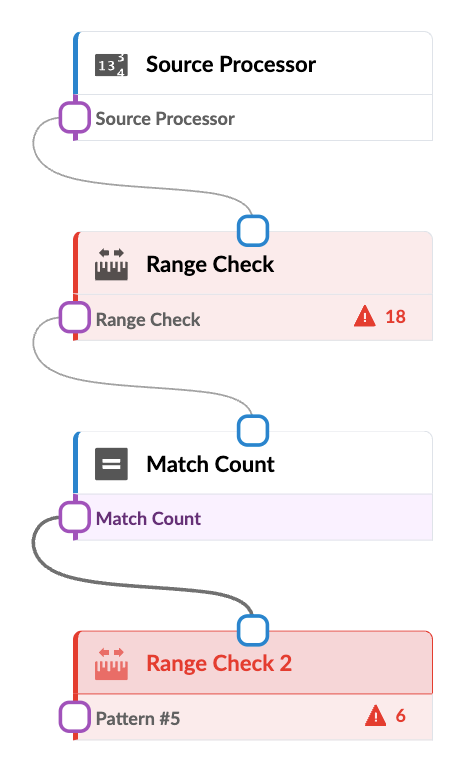
Flowchart showing a data processing pipeline. Source Processor starts, followed by Range Check with 18 alerts, Match Count, and Range Check 2 with 6 alerts.

Output Stage

Dashboard showing anomaly for system ID 0E9732930000 labeled spine1. Anomalous value is less than or equal to 5; actual value is 1. Gauge points to 1 on a scale from 0 to 5. Data updated 4 minutes ago. Background is red.