Stripe and Rail Traffic Visibility Probe

Introduction

In a Rail Optimized Stripe Architecture, a GPU Backend fabric provides the infrastructure for GPUs to communicate within an AI cluster. For more information, see GPU Backend Fabric.

The infrastructure of a GPU Backend fabric makes it ideal for high-demand AI workloads like AI Large Language Model (LLM) training. One of the main goals of a GPU Backend fabric is to provide lossless GPU-to-GPU communication, because this affects the speed and efficiency of AI workload completion. This means that a centralized view of real-time and historical traffic flow data across stripes is essential.

Version 6.0 introduces a stripe-aware, rail-aware probe called the Stripe & Rail Traffic Probe to provide traffic analytics for Rail-Optimized networks.

Stripe and Rail Traffic Probe Overview

The probe performs the following:

  • Collects traffic data for leafs which are part of stripes, divided into two parts:

    • GPU-server-facing interface counters
    • Spine-facing interface counters
  • Computes intra-stripe traffic and inter-stripe traffic, detects traffic imbalances in rails and stripes.

Dashboard: Stripe and Rail Traffic Summary
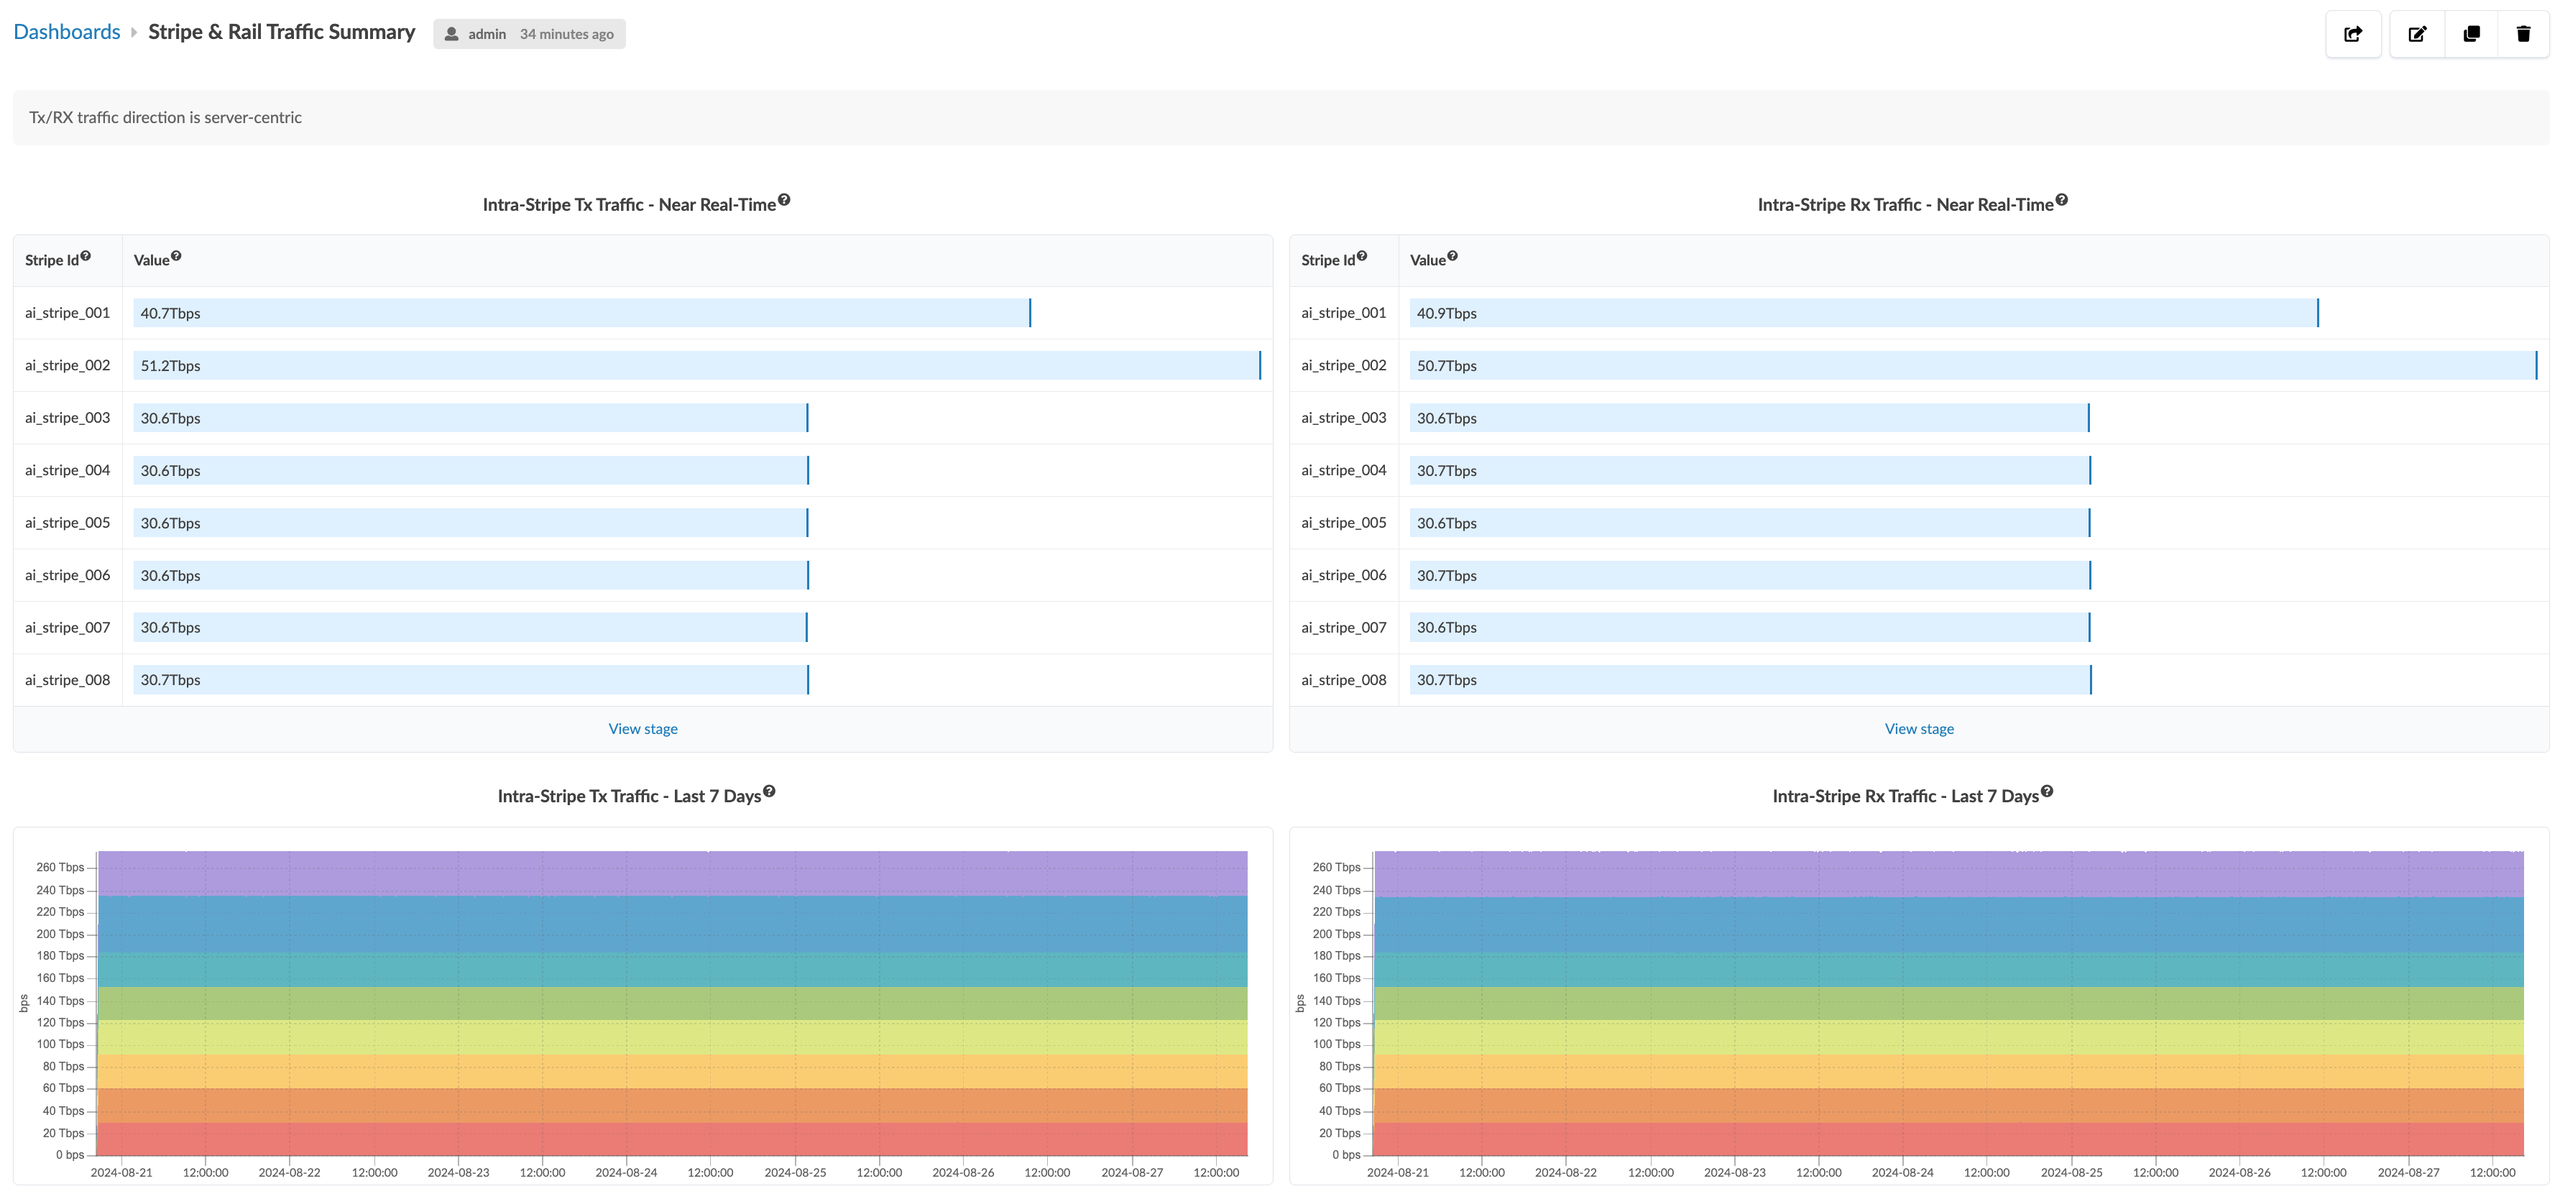
The Stripe & Rail Traffic Summary dashboard and associated probe are automatically created when the system detects a Rail-optimized blueprint. The dashboard instantiates the probe as its data source, and visualizes this information through a real-time, aggregated traffic summary for each stripe. You can view real-time and historical traffic data and traffic anomalies at the stripe and rail level.

Stripe and Rail Traffic Summary dashboard showing server-centric network traffic metrics with near real-time Tx and Rx tables in Tbps and 7-day area charts for trends.
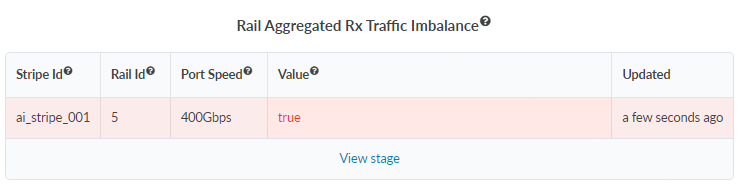
In the image below, we can see that the Rail Aggregated Rx Traffic Imbalance widget is displaying an RX traffic anomaly for "ai_stripe_001" on Rail Id 5. These anomalies are raised when the difference in the amount of traffic transmitted through different links exceeds the “Rail Imbalance Threshold” parameter. You can click the View stage button to view the processor stage for detailed information about the anomalies.

Rail Aggregated Rx Traffic Imbalance table with Stripe Id ai_stripe_001, Rail Id 5, Port Speed 400Gbps, Value true highlighted in red, Updated a few seconds ago, and View stage link below.

Rail Aware Traffic Analytics

Version 6.0 provides rail-aware traffic analytics dashboards. Widgets filter data specifically for the selected rail. The following image shows the filtering condition based on the "properties.stripe_id" property.

This ensures that the dashboard reflects the latest state of the network fabric.
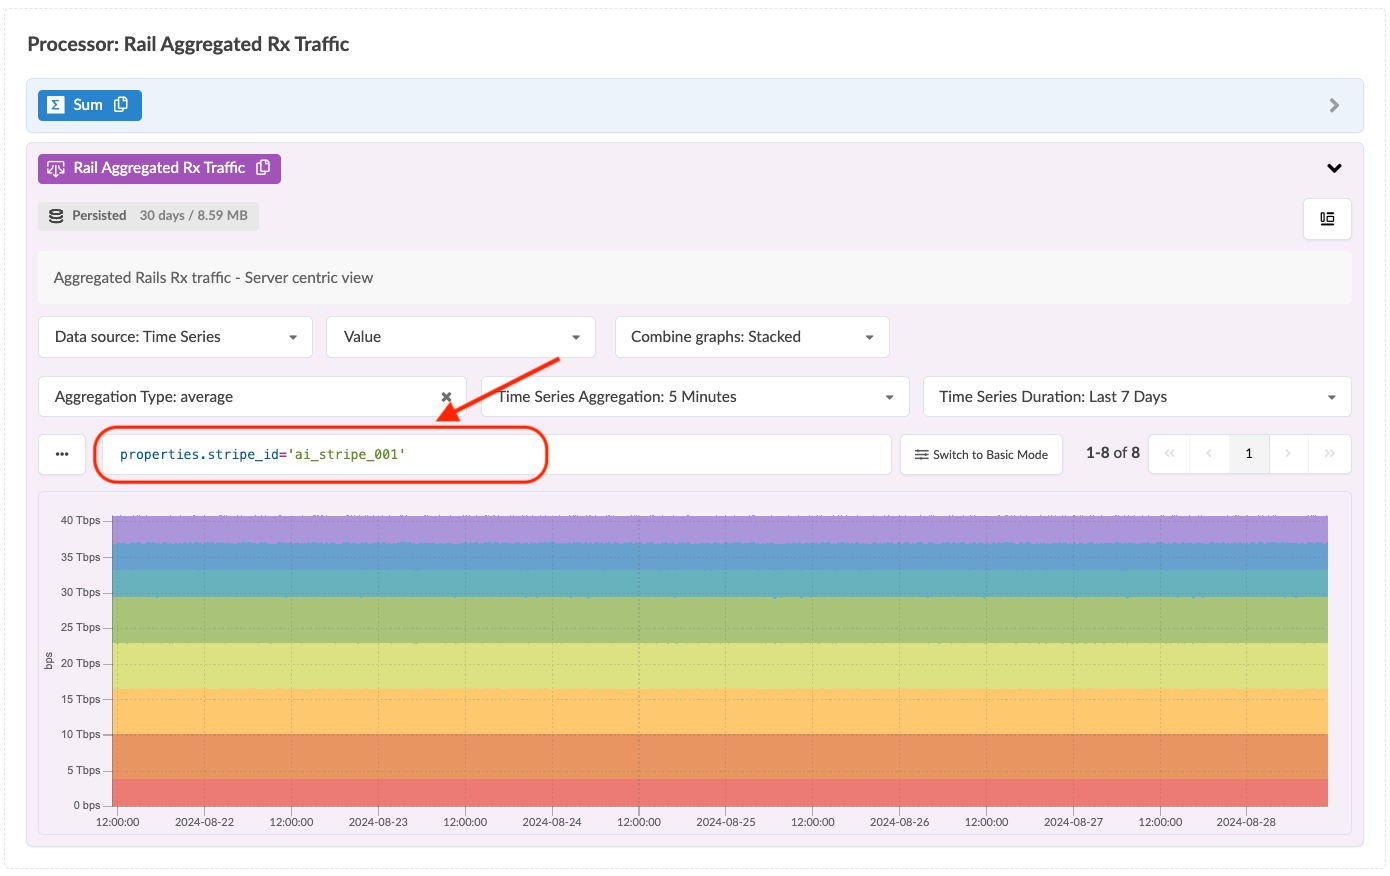

Dashboard for analyzing aggregated rail RX traffic with a stacked area graph showing traffic in Tbps over the past 7 days, filtered by stripe_id ai_stripe_001.
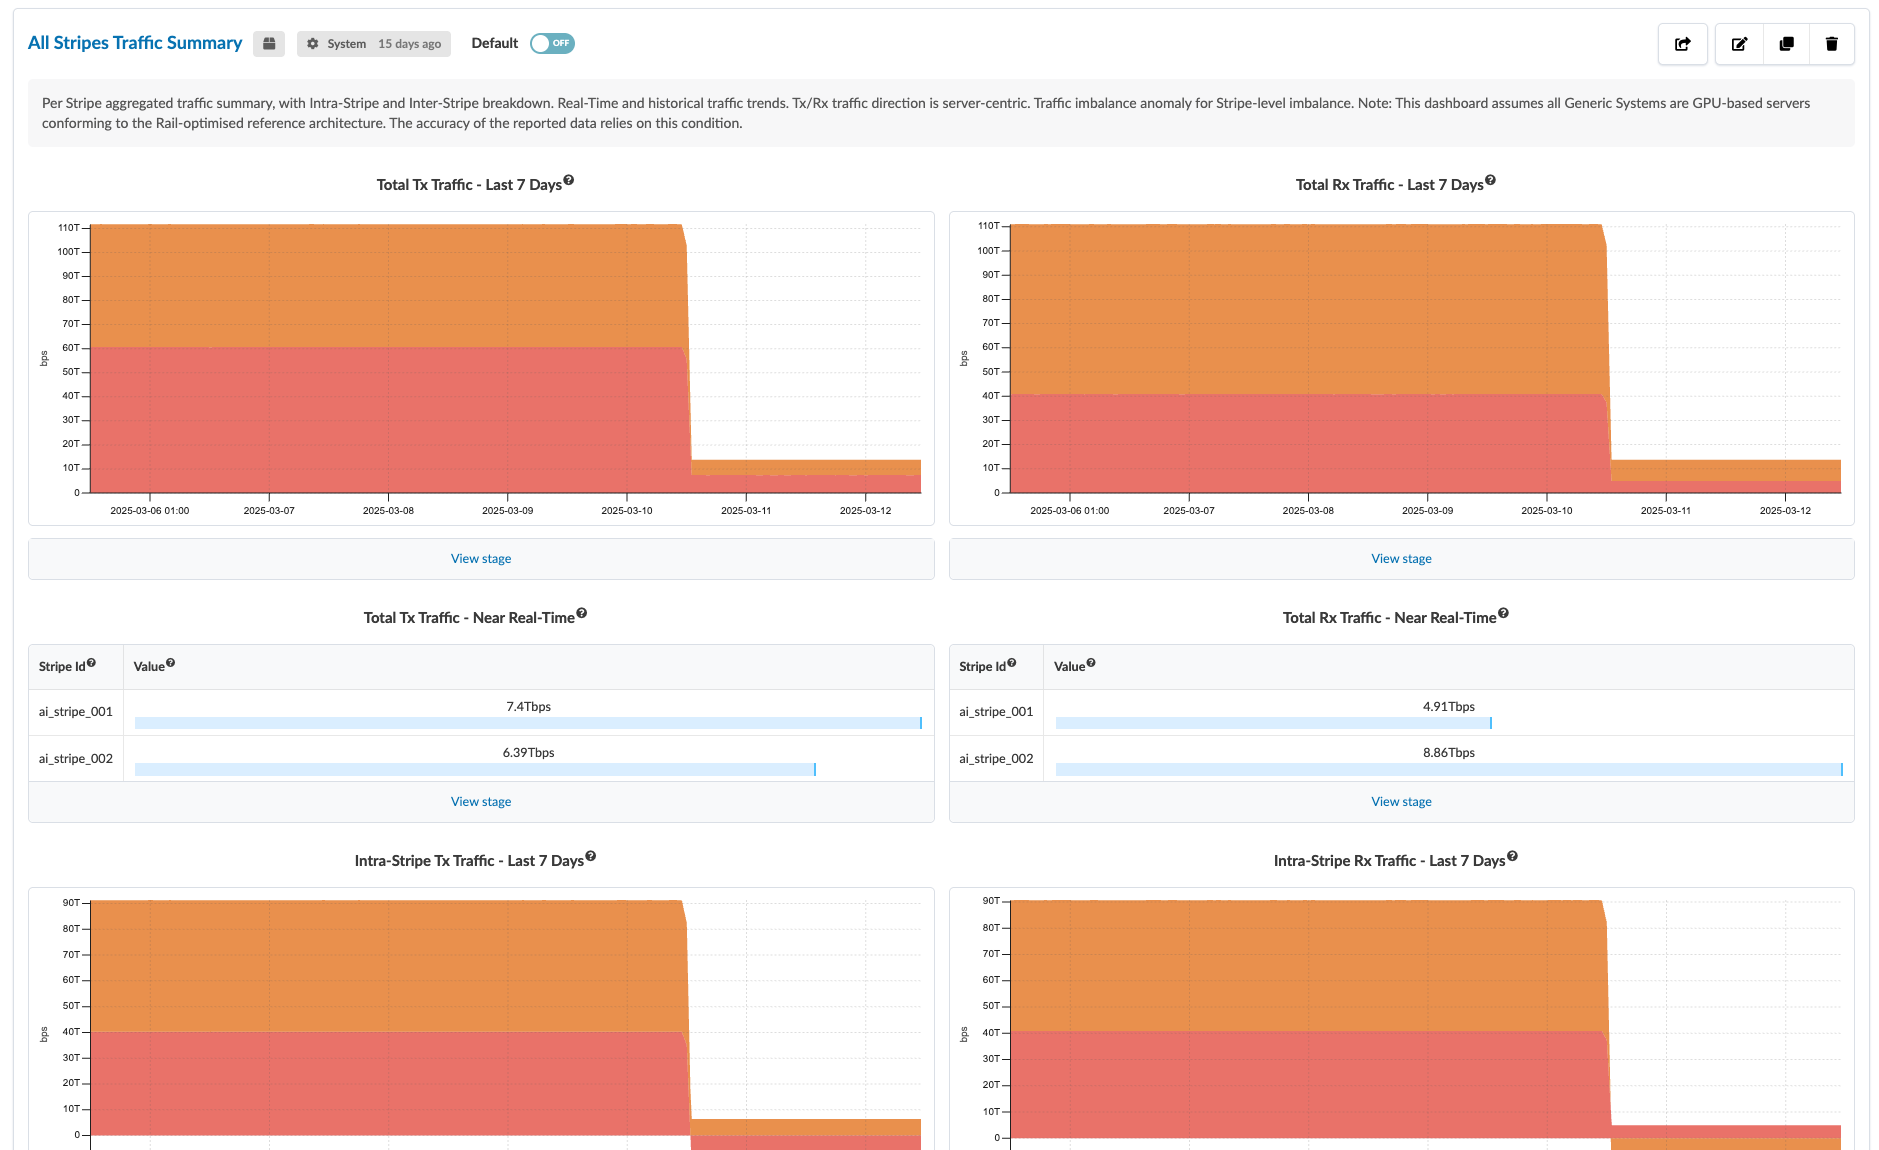
The All Stripes Traffic Summary dashboard is a dynamically generated dashboard. The system automatically creates this dashboard when there are 2 or more stripes in a blueprint and automatically removes it when this condition is no longer valid.

Dashboard showing network traffic data with graphs for transmitted and received traffic over the last 7 days, and tables of near real-time transmission and reception rates per stripe in terabits per second and terabytes.

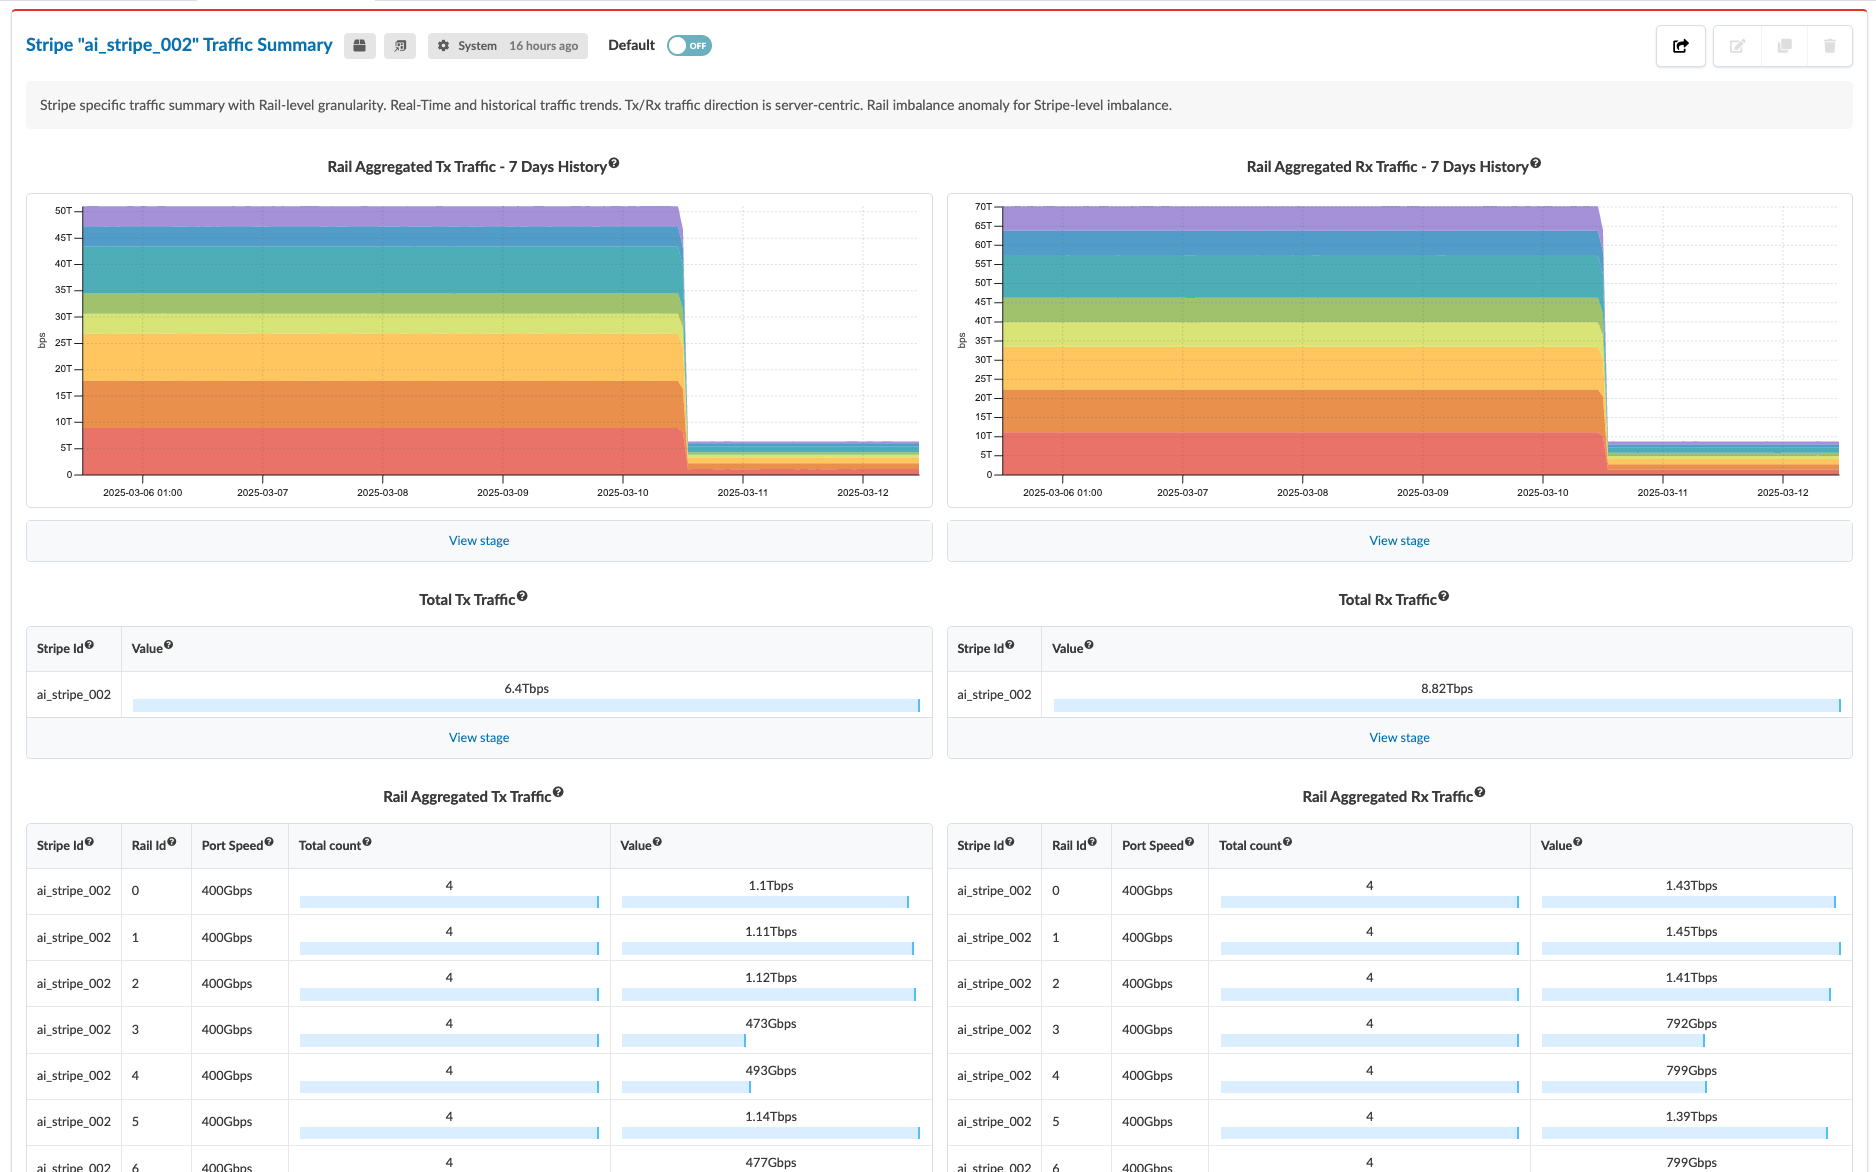
Version 6.0 also supports an auto-scaling dashboard called the Stripe Traffic Summary. This dashboard automatically adjusts the number of dashboard instances based on the stripes that are present in the blueprint. If a stripe is removed, the corresponding stripe instance is also removed from the dashboard.

In the images below, a stripe instance showing real-time traffic metrics is generated for each stripe present in the blueprint.
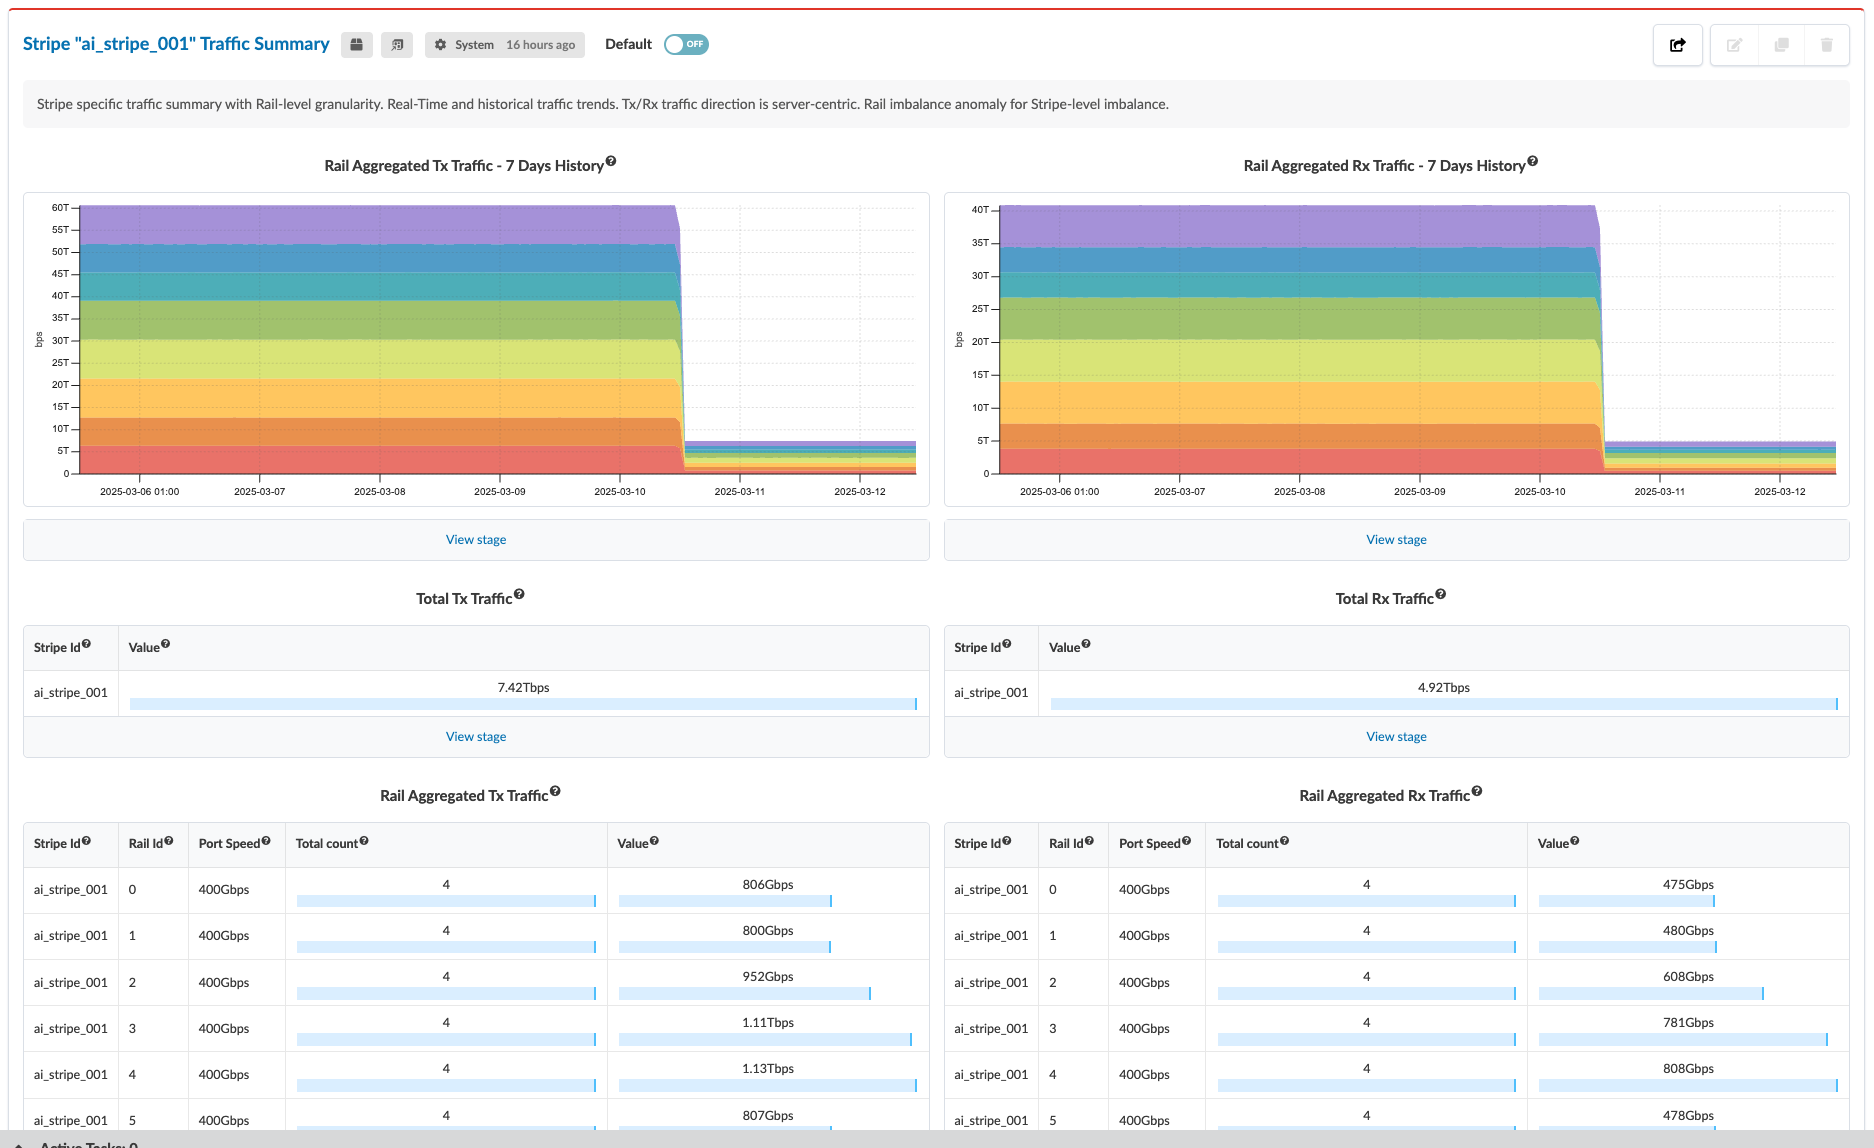
Stripe 1

Dashboard showing network traffic data for ai_stripe_001, including 7-day history graphs for transmitted and received traffic, traffic summary with total Tx and Rx values, detailed rail traffic tables, and toggle options for viewing stage and settings.
Stripe 2

Network traffic monitoring dashboard for Stripe ai_stripe_002 showing 7-day Tx and Rx traffic trends, total Tx 6.4 Tbps, total Rx 8.82 Tbps, and detailed rail-level traffic insights.

Stripe and Rail Traffic Probe Changes for Blueprints with EVPN Control Plane
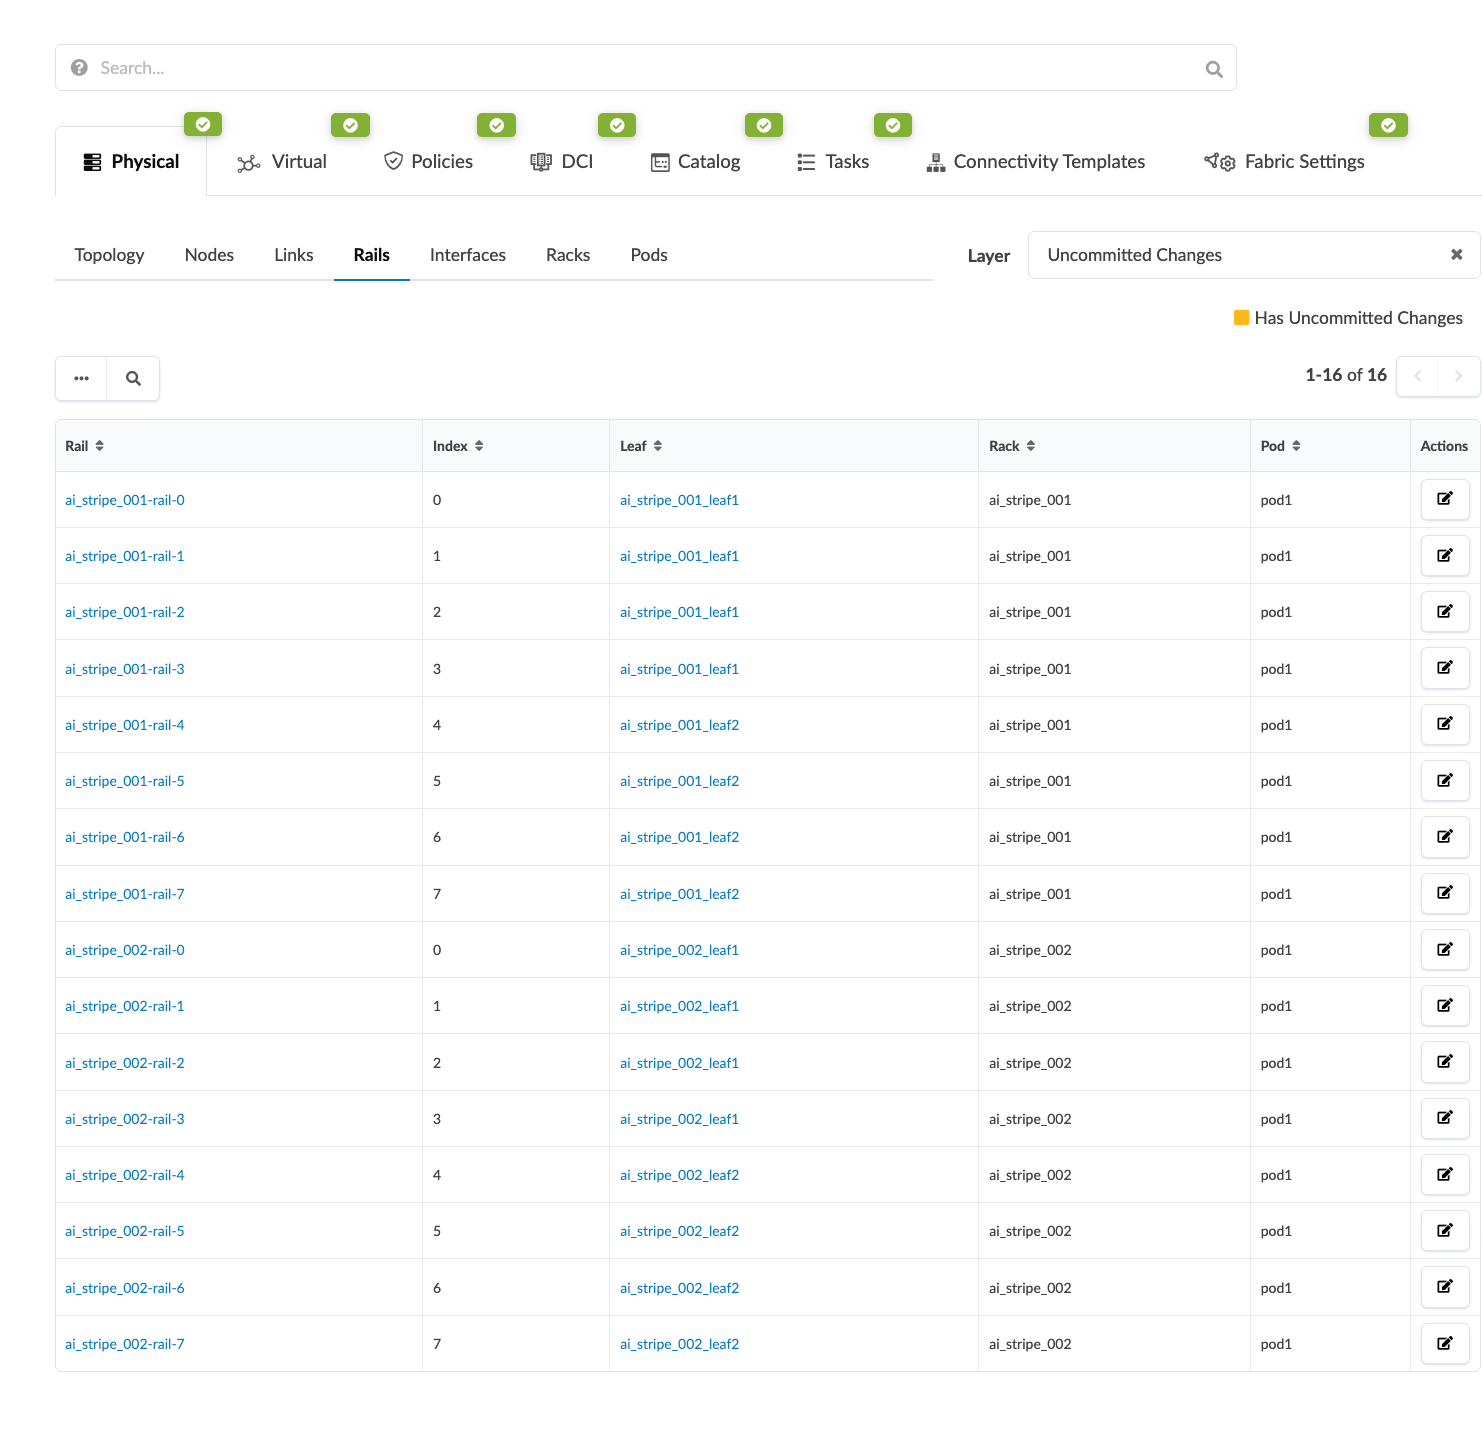
For blueprints that use an EVPN overlay, the Stripe and Rail Traffic probe is disabled. The All Stripes Traffic Summary dashboard is disabled. Each Stripe traffic summary dashboard is also disabled. All other IBA probes and dashboards remain enabled. They operate as in non EVPN blueprints.​​

User interface for managing physical network infrastructure. Physical tab is selected with Rails sub-tab active. Table lists rail names, indices, associated leaf switches, racks, pods, and edit actions. Layer filter set to Uncommitted Changes with yellow indicator showing uncommitted changes.