Optical Transceivers Probe
SONiC is supported on the Optical Transceivers probe as a technical preview.
This feature is classified as a Juniper Apstra Technology Preview feature. These features are "as is" and voluntary use. Juniper Support will attempt to resolve any issues that customers experience when using these features and create bug reports on behalf of support cases. However, Juniper may not provide comprehensive support services to Tech Preview features.
For additional information, refer to HPE Networking Apstra Data Center Director Tech Previews or contact Juniper Technical Support.
The Optical Transceivers probe is supported on Juniper, Arista, and Cisco, and on SONiC as a tech preview feature, as noted above.
The Optical Transceivers probe monitors optical statistics based on the following telemetry data:
-
Temperature C) of the physical port (interface stats)
-
Voltage (V) of the physical port (interface stats)
-
Transmit Power Level (dBm) of each optical lane (lane stats)
-
Receive Power Level (dBm) of each optical lane (lane stats)
-
Transmit Bias (mA) of each optical lane (lane stats)
The Optical Transceiver probe can suppress optical anomalies detected on unprovisioned ports that still have transceivers installed. This enhancement reduces noise and improves the user experience by preventing anomalies from being raised on ports that are not intended for use in the blueprint.
Provisioned and unprovisioned status is determined based on user intent and whether the interface is actively used within the blueprint.
- When enabled, the probe raises anomalies only for provisioned ports.
- When disabled, the probe restores the previous behavior and raises anomalies for all ports, regardless of their provisioning status.
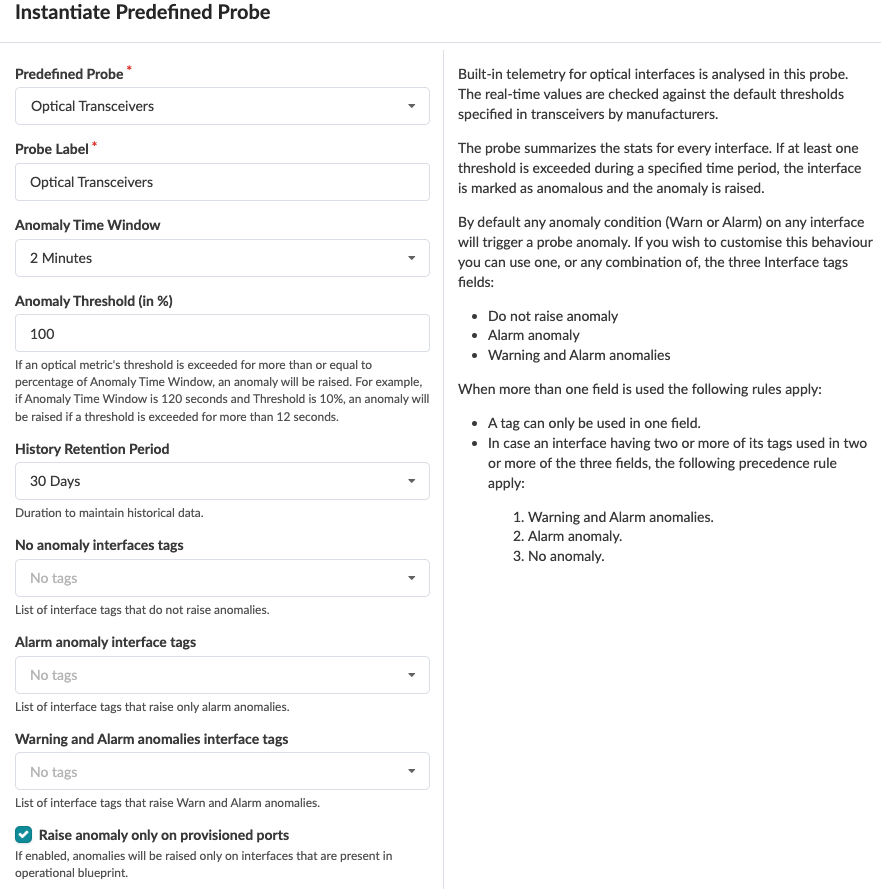
The following stages are used in the Optical Transceiver probe.
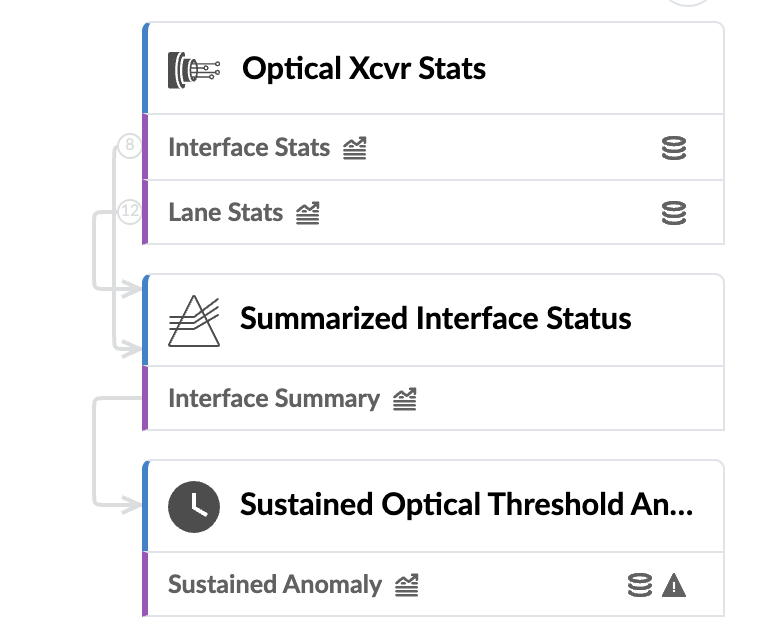
You now have the ability to stream any type of IBA data including dynamic stages. This means that all forms of IBA data can be accessed and transmitted in real-time through streaming capabilities.
Dynamic series graphs respond to switch conditions, regardless of graph state. The telemetry service on the device defines the series dynamically. The graph specifies which systems execute the service but omits key service aspects. This approach is useful for monitoring components absent in the graph database, including:
-
Power supplies
-
Optical transceivers
-
Configuration elements without graph properties, which are called "Dynamic" because they respond to switch activity independently of the graph state.
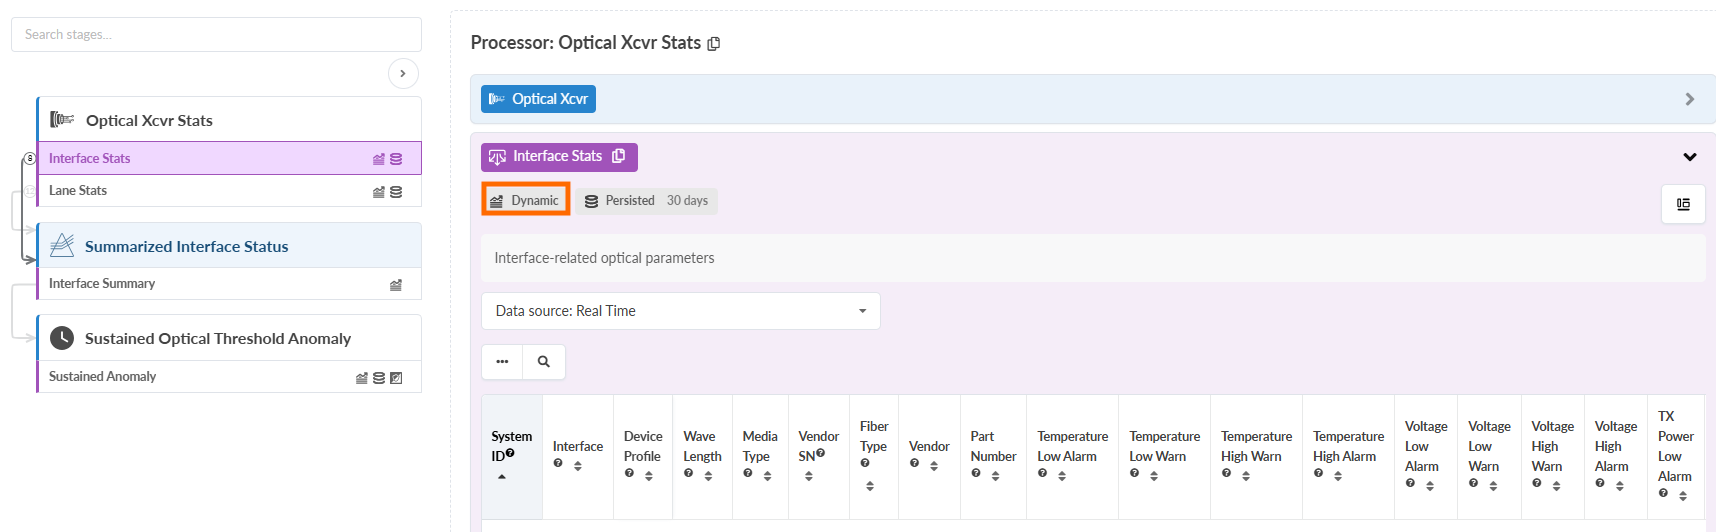
The Optical Threshold processor's output stage also includes:
- A Provisioned column indicates whether an interface is provisioned. The column
contains a Boolean value (
TrueorFalse). - The Value column supports a third state, Suppressed, in addition to
TrueandFalse.
A Suppressed value indicates that the telemetry system detected optical degradation, but the anomaly is intentionally suppressed due to the interface being unprovisioned or having a tag assigned to it which matches the rule which suppresses it.
If telemetry data falls outside the specified range for the specified amount of time, a warning or alarm is raised, as applicable.
Warnings and alarms specify whether the value causing the anomaly was too high or too low.
The predefined probe configuration includes a Raise anomaly only on provisioned ports checkbox, which is enabled by default. You can customize parameters or leave default values as is, as shown in the screenshot below.
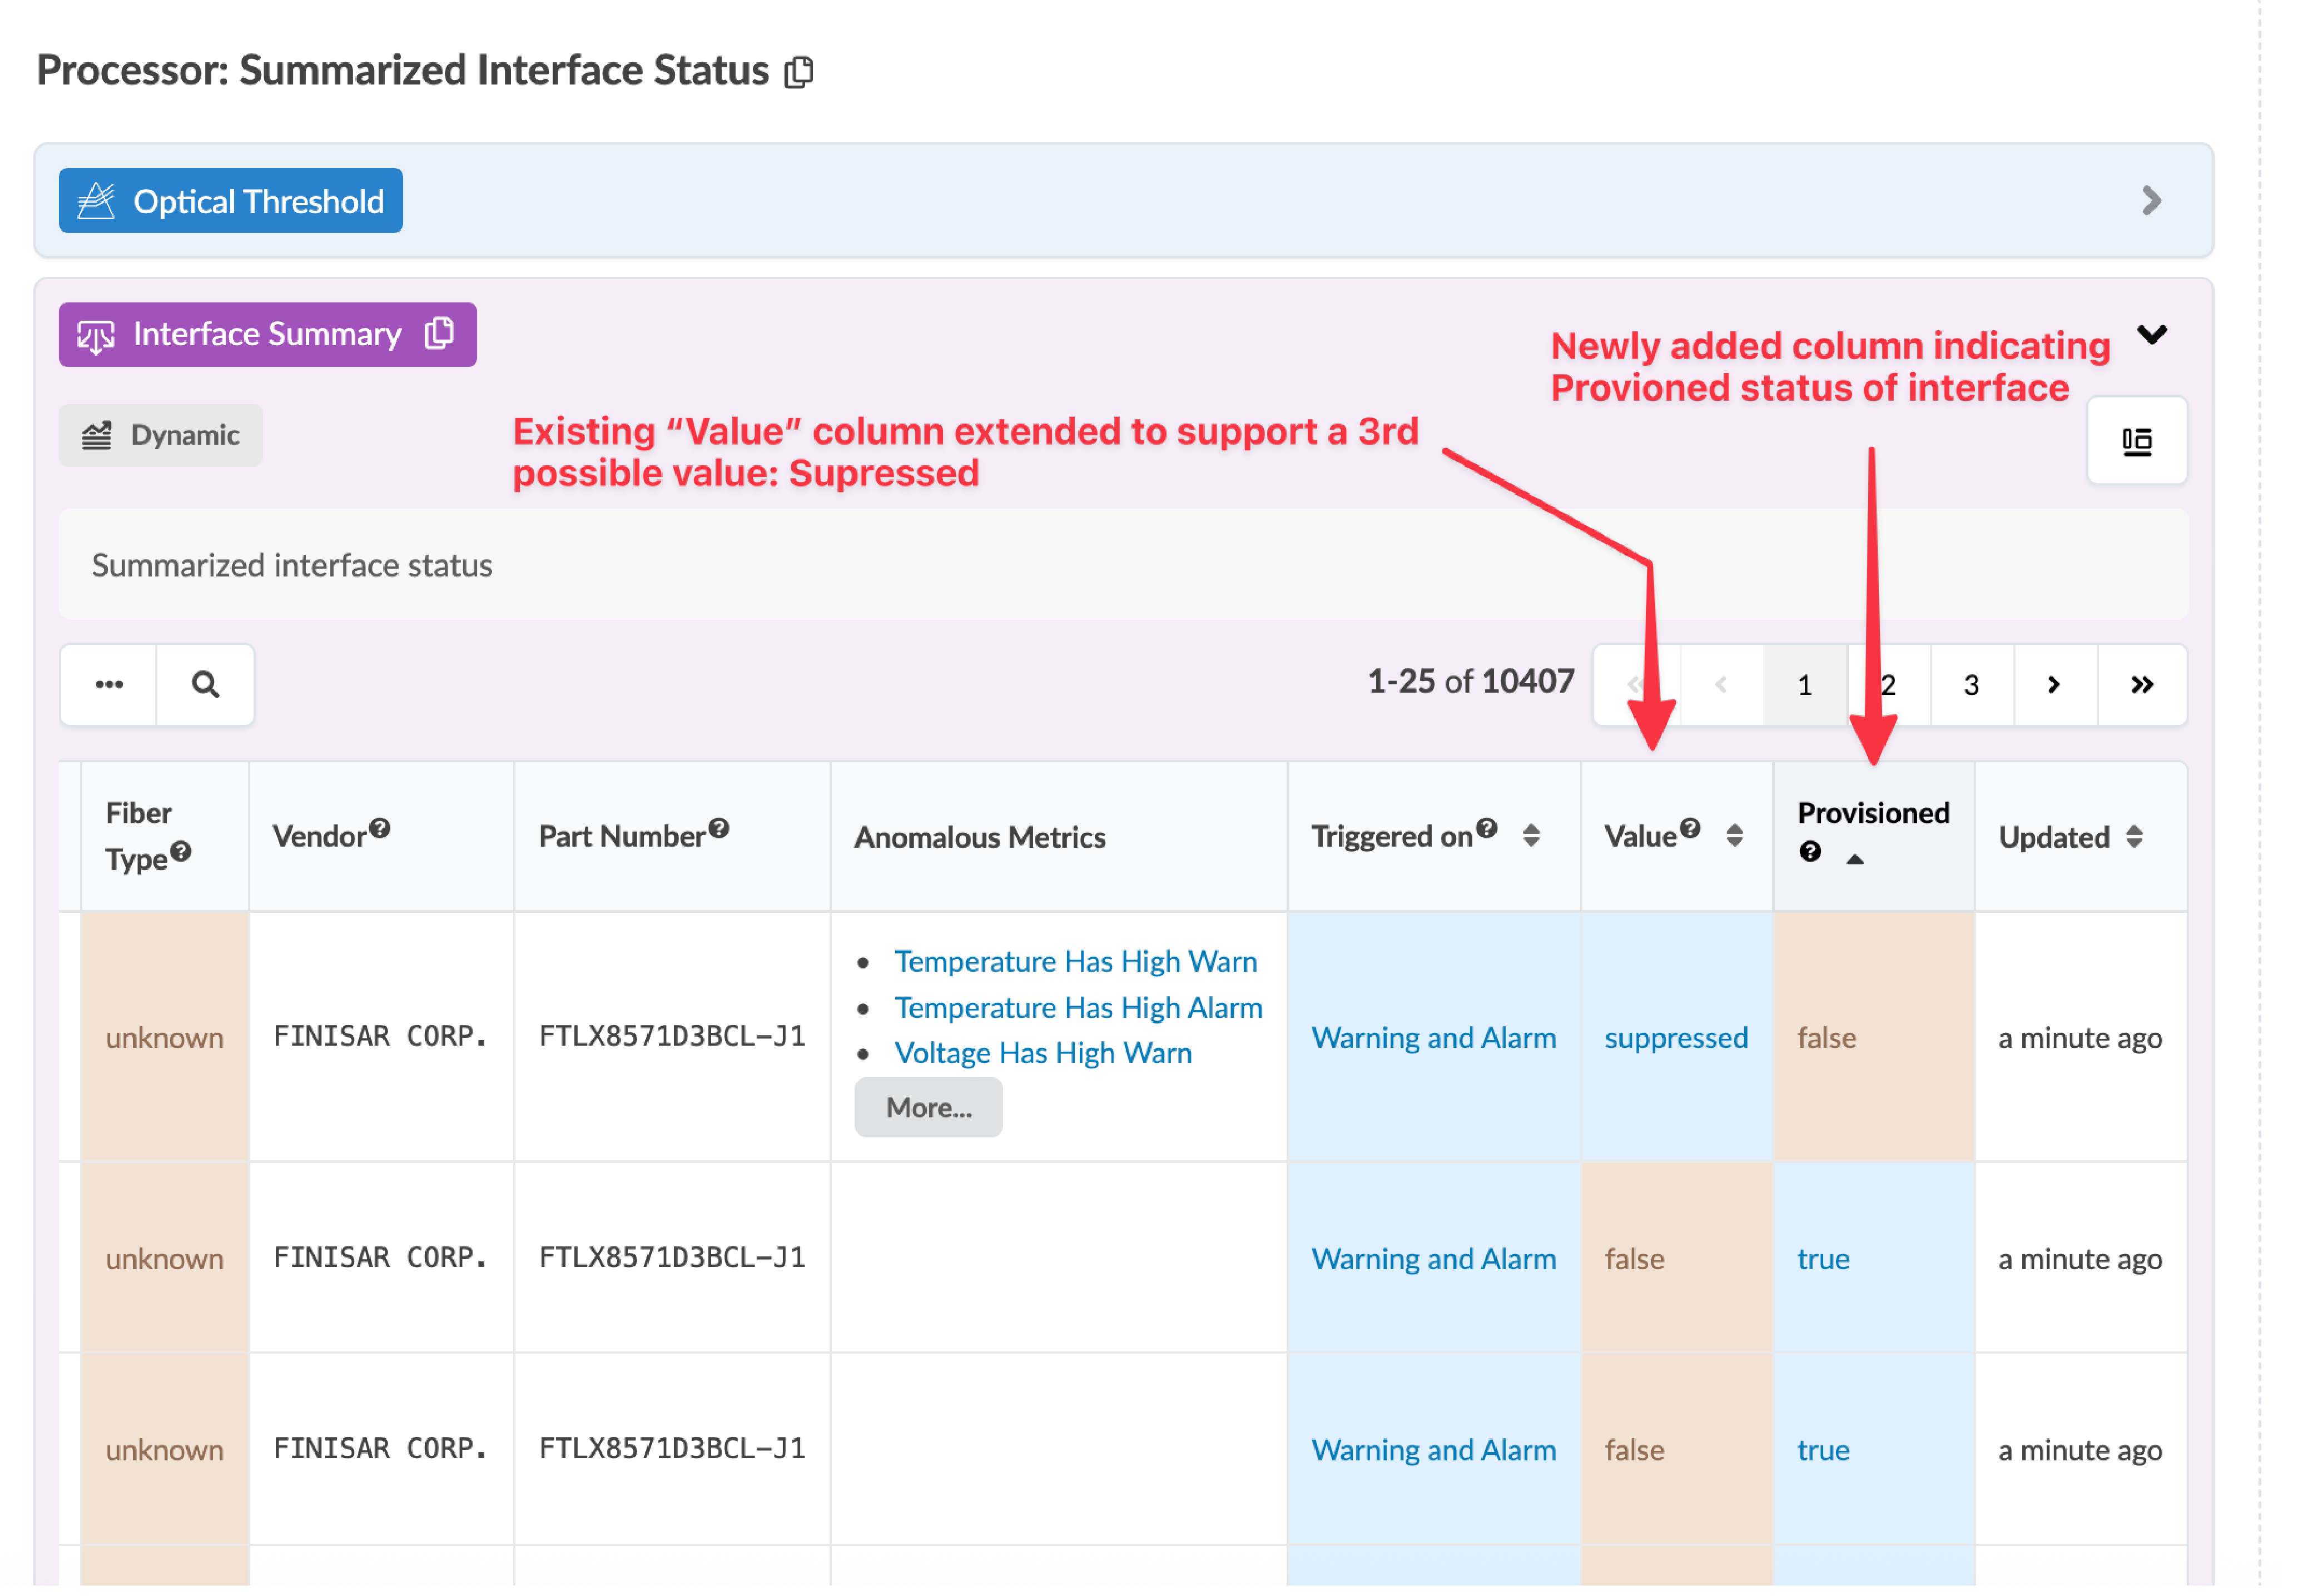
For more information about this probe, from the blueprint, navigate to Analytics & Probes, click Create Probe, then select Instantiate Predefined Probe from the drop-down list. Select the probe from the Predefined Probe drop-down list to see details specific to the probe.