MAC Monitor Probe
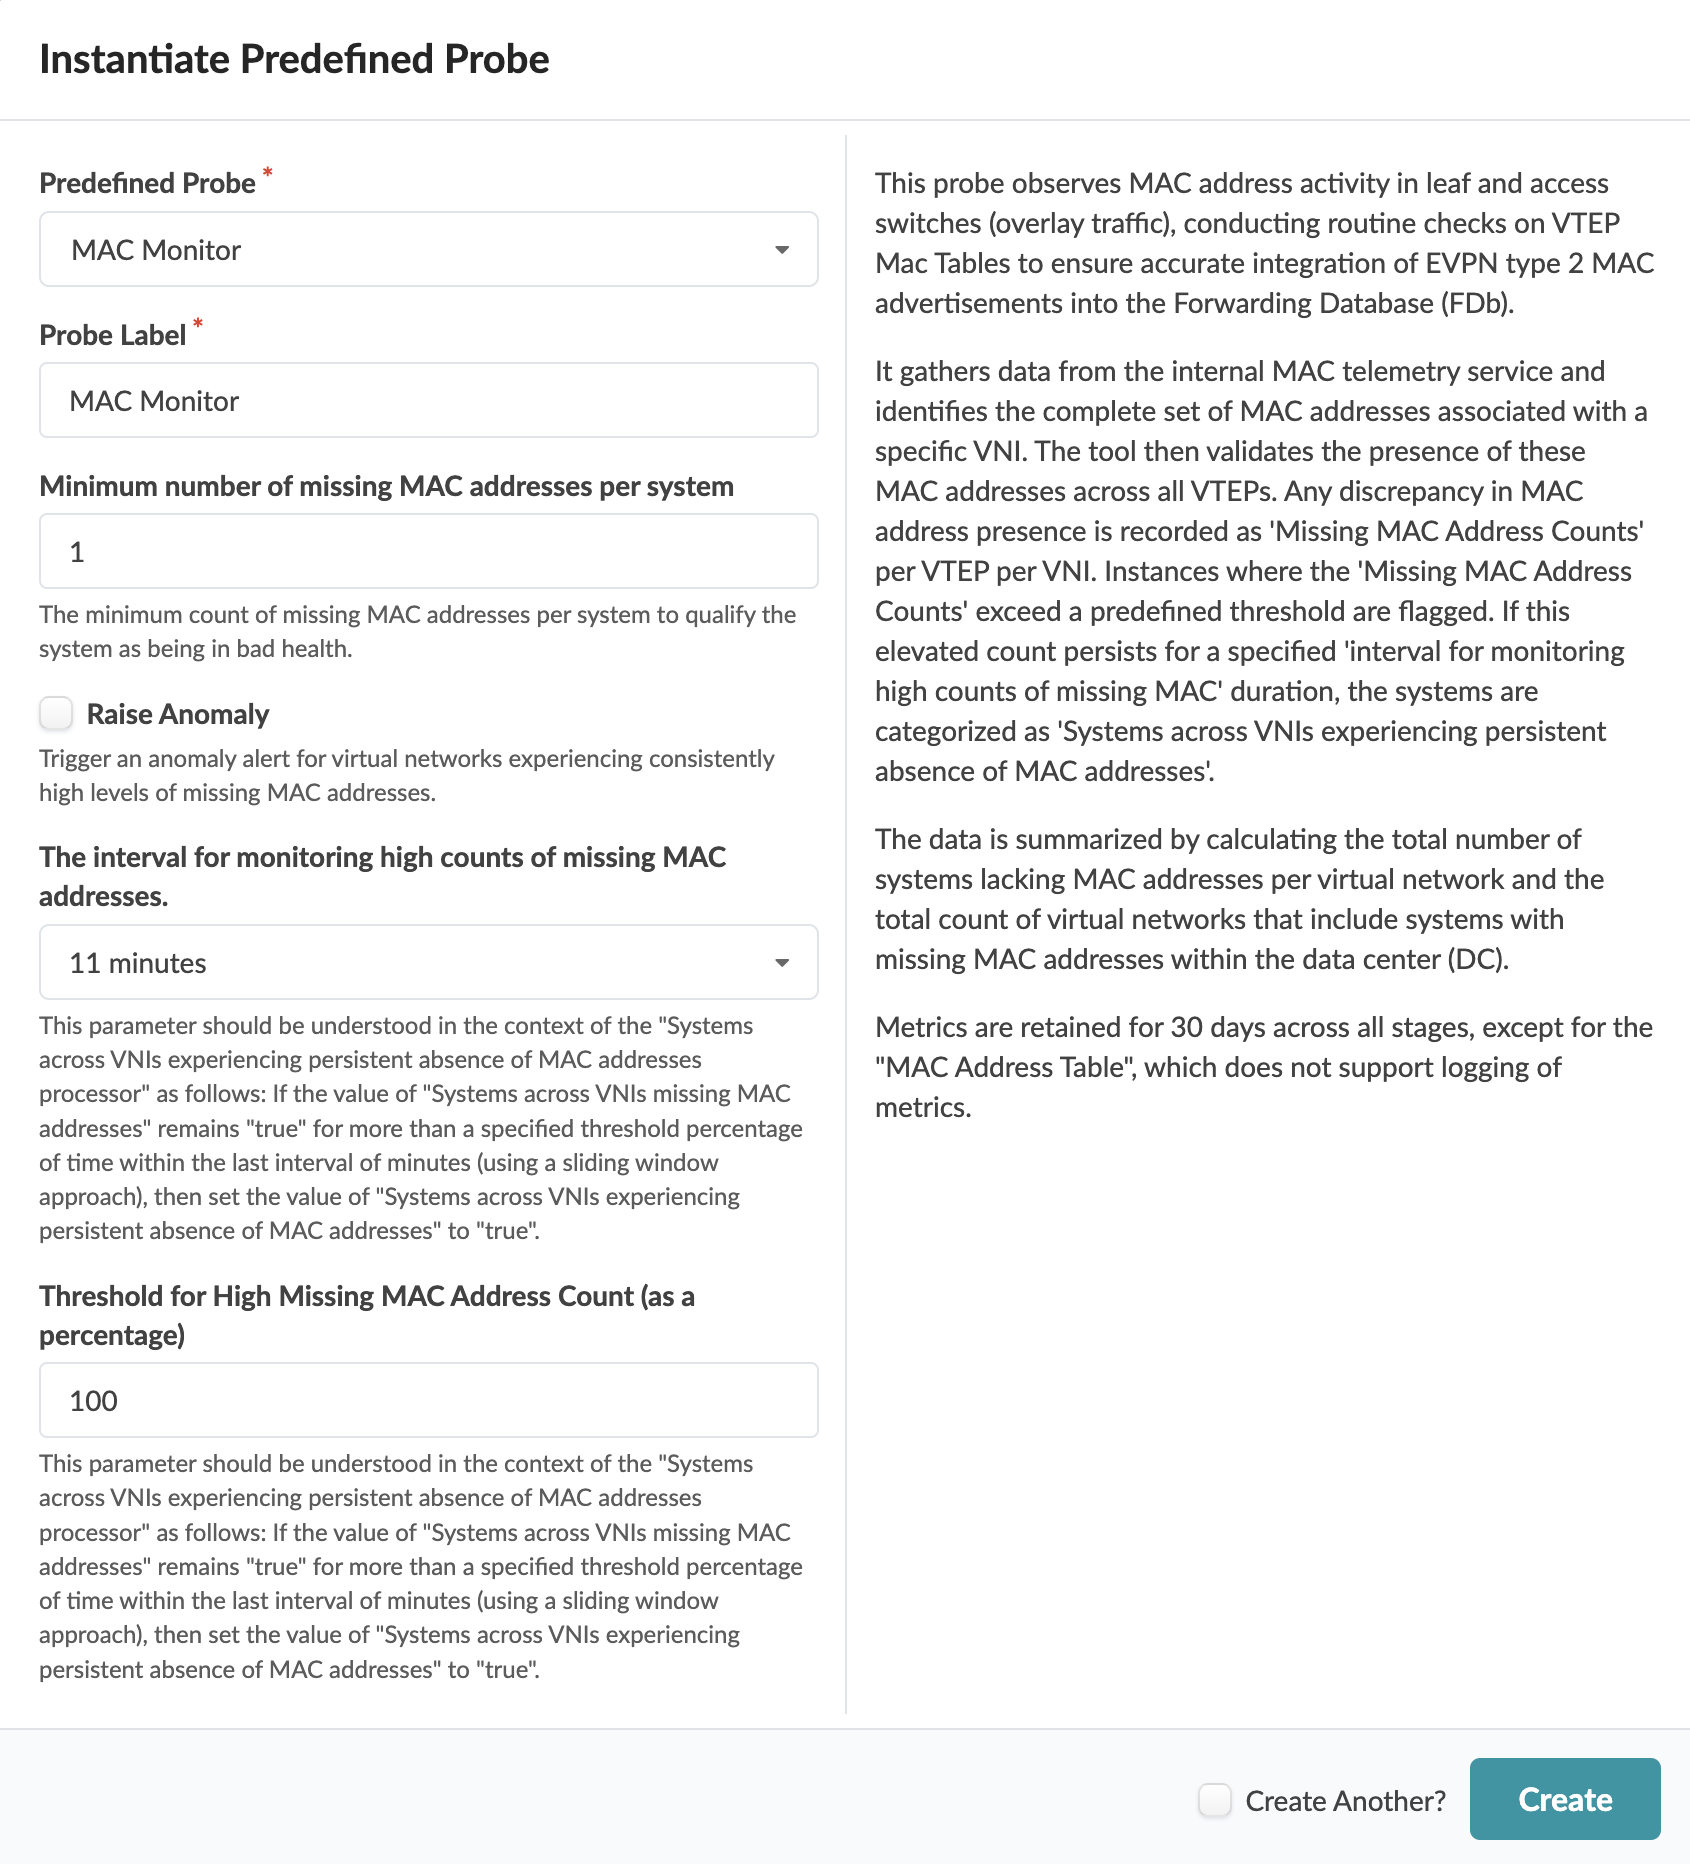
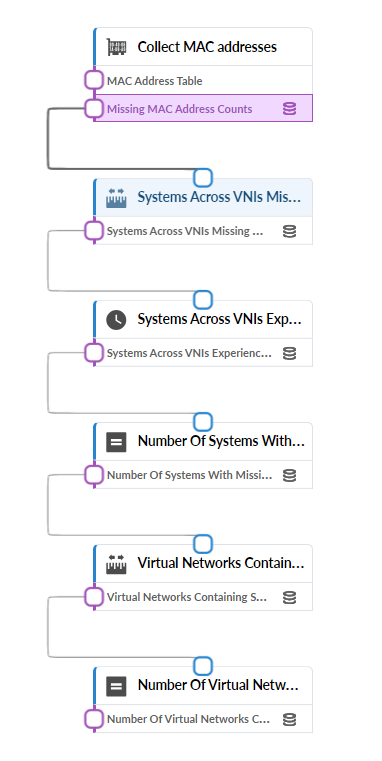
The MAC Monitor probe observes MAC address activity on switches and checks VTEP MAC Tables to ensure accurate EVPN type 2 MAC advertisement integration into the Forwarding Database (FDb). It identifies, validates, and flags missing MAC addresses across all VTEPs. This data is summarized by calculating MAC address discrepancies.
MAC Monitor Probe Historical Analysis Enhancements
The auto-enabled MAC Monitor Probe now provides historical MAC address analysis across the blueprint. This enhancement helps you investigate MAC address behavior over time and troubleshoot network issues more effectively.
The probe now includes two additional views in the source processor:
-
Time-Series view
-
Snapshot view
These views complement the existing Real-Time view and provide historical visibility into MAC address state changes. For more information about this probe, from the blueprint, navigate to Analytics > Probes. Select the built-in enabled MAC Monitor probe from the list of probes available. From left hand menu, select Mac Address Table stage under Collect MAC addresses'processor.
The MAC Monitor Probe reports the following MAC address states:
-
Expected: The MAC address is learned and present on the system for the associated VNI. This state is available in the Real-Time, Snapshot, and Time-Series views.
-
Missing: The MAC address is not present on the system but is expected based on EVPN information. This state is available in the Real-Time, Snapshot, and Time-Series views.
-
Absent: The MAC address is not present on the system. This state is available only in the Time-Series view.
You can view historical state information for all MAC addresses in a single table. For more detailed analysis, open the detailed view to examine state changes at specific timestamps.
You must select one of the following filters is to view the data:
-
System ID (system_id
-
VN ID (vn_id)
-
MAC (mac)
Time-Series view
The Time-Series view lets you analyze historical MAC address state data for a selected time range. It shows how MAC address states change over time, helping you identify recurring, intermittent, or transient issues.
By default, the system retains up to 30 days of historical data depending on how the retention settings are configured and provided there is sufficient storage is available.
The State column displays MAC address state transitions as discrete events. For example, if a MAC address becomes unavailable because of a network issue and later recovers, the view records each state transition:
Expected → Absent → Missing → Expected
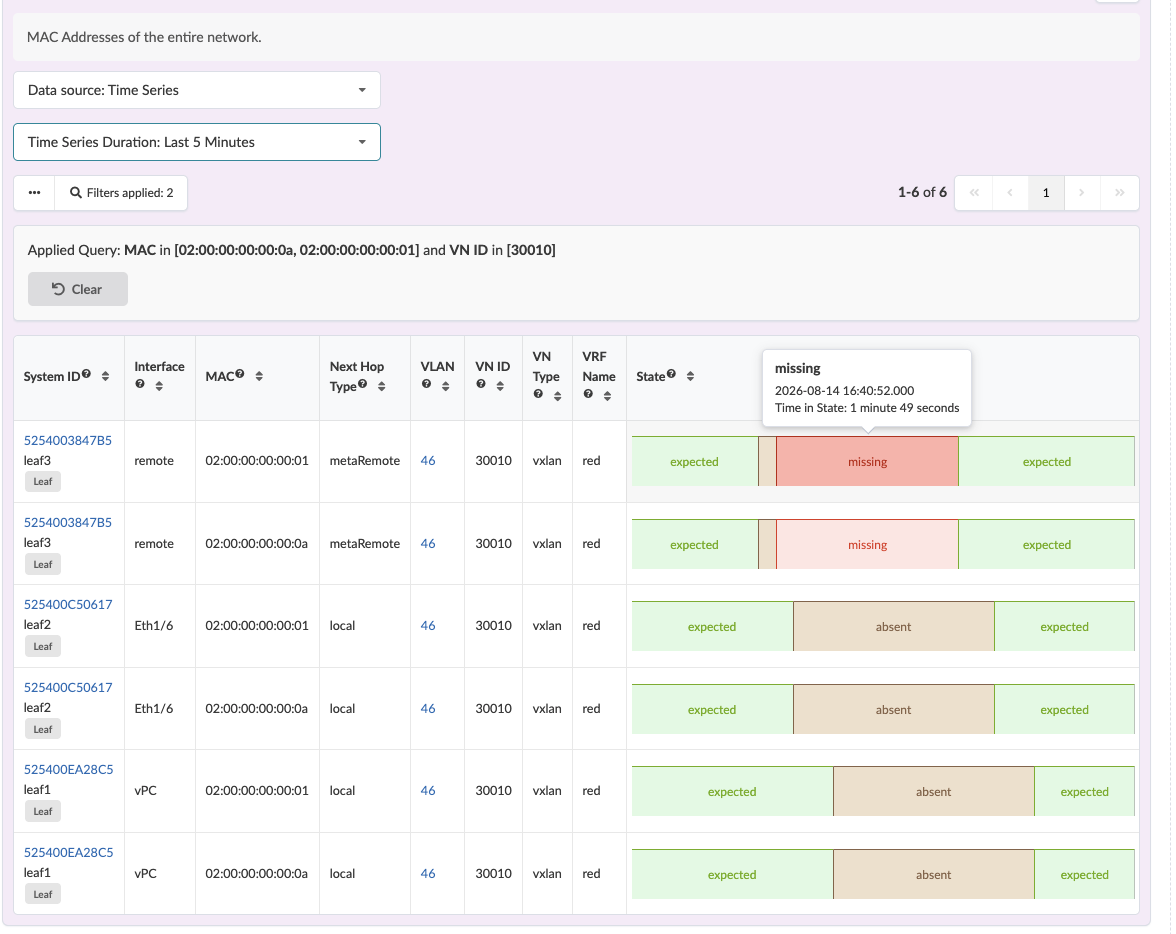
This information helps you determine when a MAC address disappeared, when it became inconsistent with EVPN expectations, and when normal operation resumed.
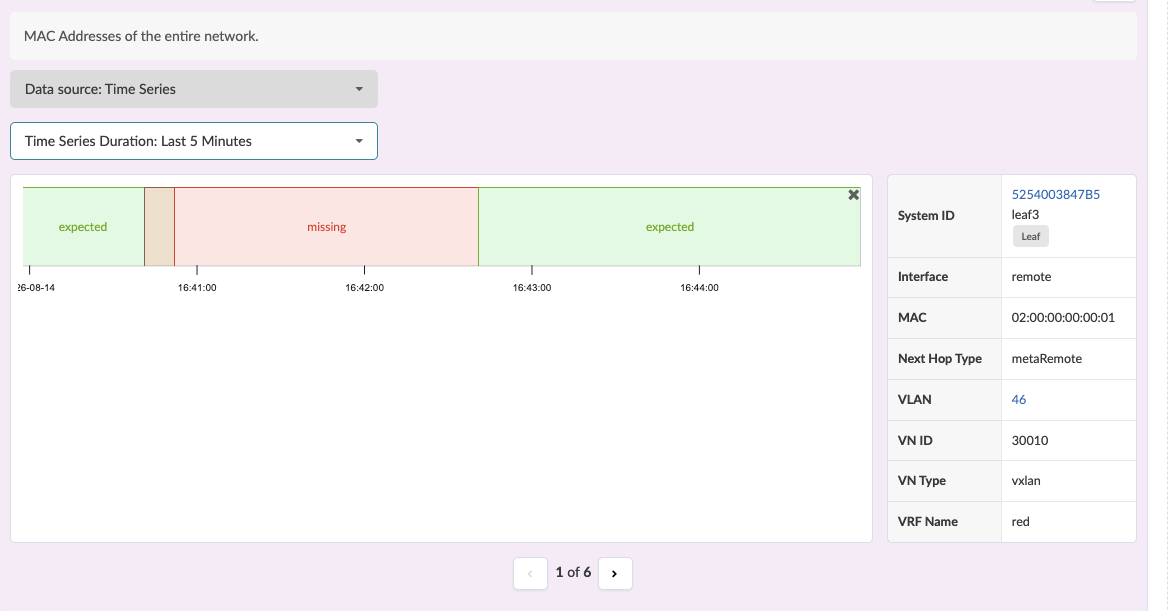
The detailed view shows the exact state of the MAC address at each recorded timestamp. From this view, you can select a specific point in time and open the Snapshot view to investigate the network conditions that correspond to that state.
Snapshot view
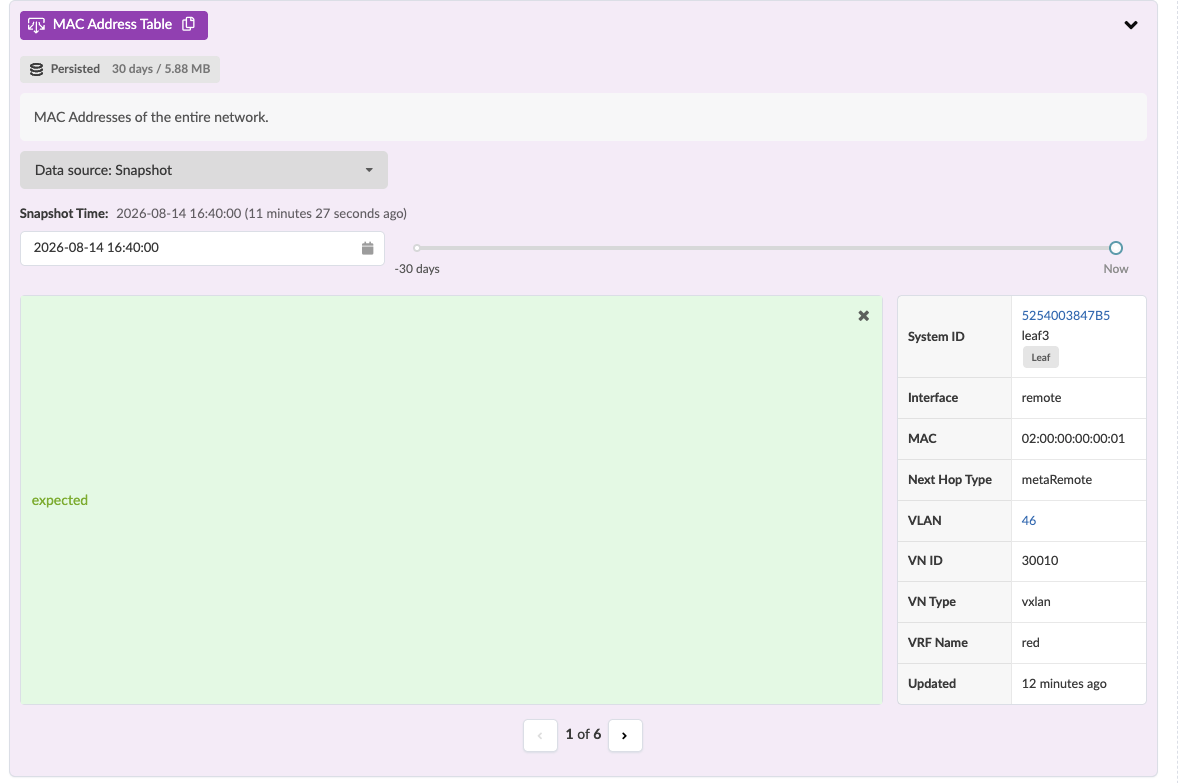
The Snapshot view provides a point-in-time view of MAC address states. It shows the state of MAC addresses at a selected historical timestamp, helping you correlate MAC address behavior with network events.
The Snapshot view reports the following states:
-
Expected
-
Missing
The State column shows the MAC address state at the selected timestamp. A state of Missing indicates that the MAC address was expected but not present on the system at that point in time. A state of Expected indicates that the MAC address was present and operating normally.
The view below lets you analyze the historical state of all MAC addresses in the blueprint from a single table and determine how many MAC addresses were present or missing at the selected point in time.
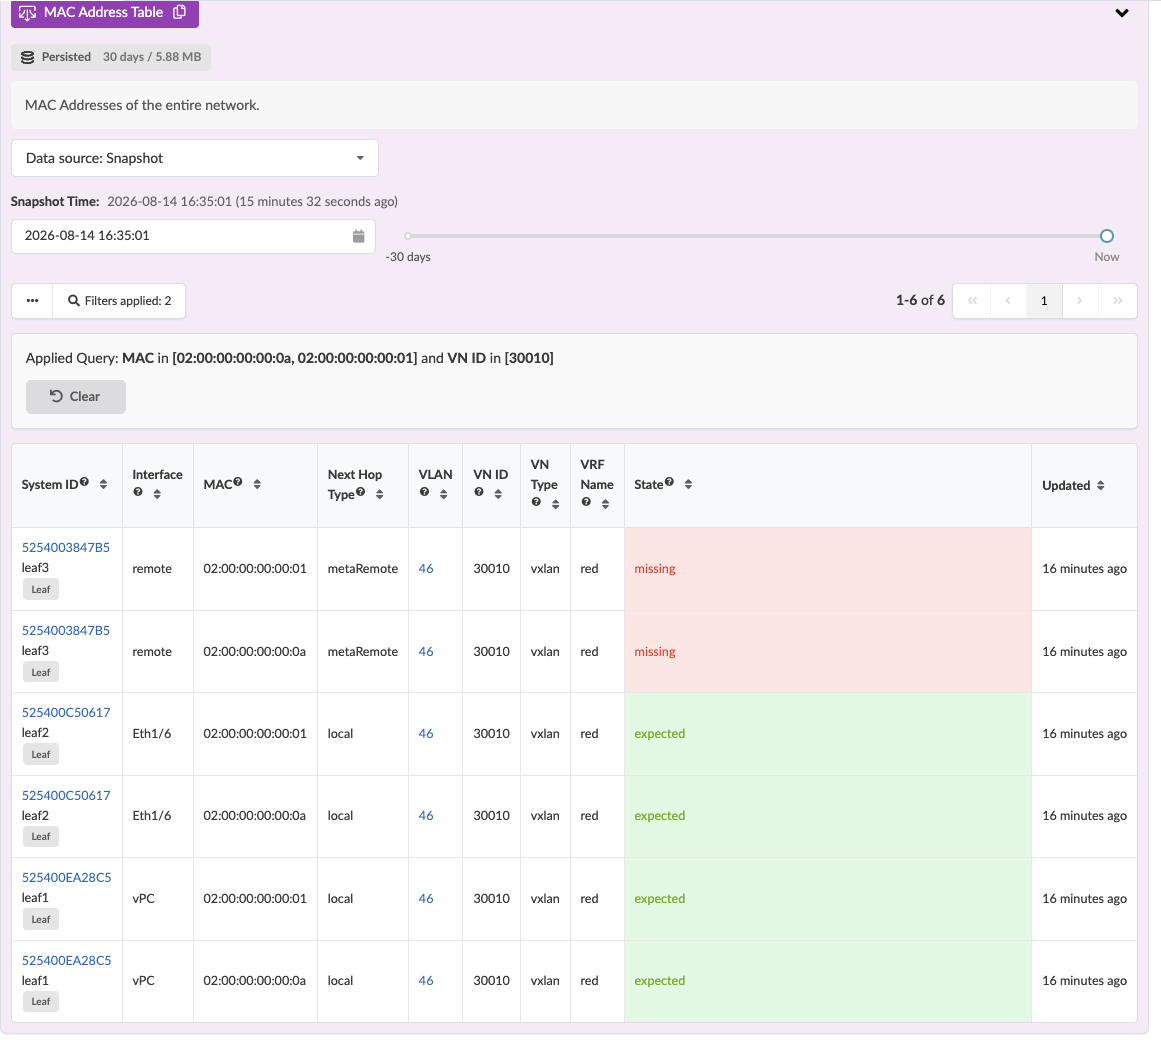
The view below can help identify network events that caused the MAC address to become unavailable.
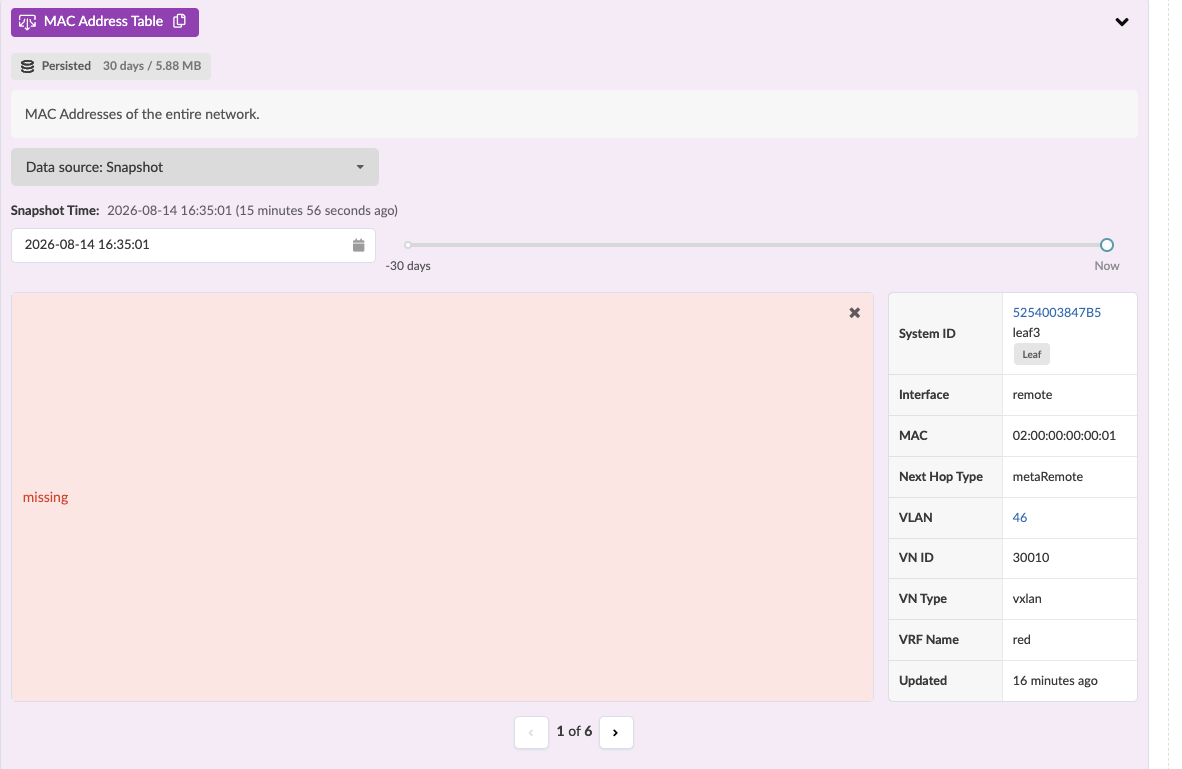
The view below indicates that the MAC address was present and expected at the selected timestamp, which can help confirm recovery from a previous network issue.