ON THIS PAGE
Device Telemetry Health Probe
Probe Overview
The device telemetry health probe verifies telemetry collector health. It runs analytics on
the collection statistics from available service execution and if the telemetry collection
health degrades, anomalies are raised.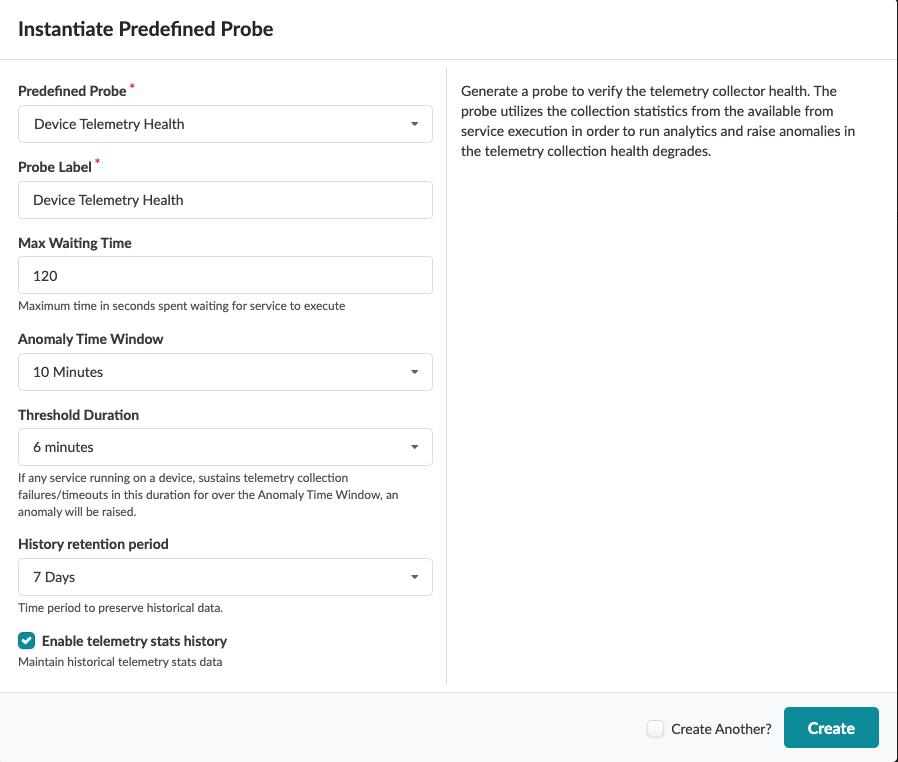
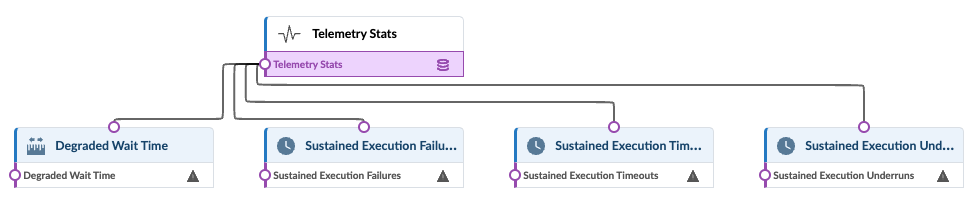
For more information about this probe, from the blueprint, navigate to Analytics > Probes, click Create Probe, then select Instantiate Predefined Probe from the drop-down list. Select the probe from the Predefined Probe drop-down list to see details specific to the probe.
AI Fabric Enhancements
Version 6.0 enhances the Device Telemetry Health Probe to monitor additional telemetry services and automatically include future services. These updates enhance telemetry collection and monitoring, with streamlined integration of future services.
The Device Telemetry Health Probe monitors telemetry collector health by analyzing service execution statistics. The probe also detects anomalies when telemetry collection degrades, enabling a proactive response. Key features include:
-
Monitoring of critical telemetry services across compute systems
-
Automatic integration of new telemetry services
-
Historical data capture for trend analysis
Telemetry Services Monitoring
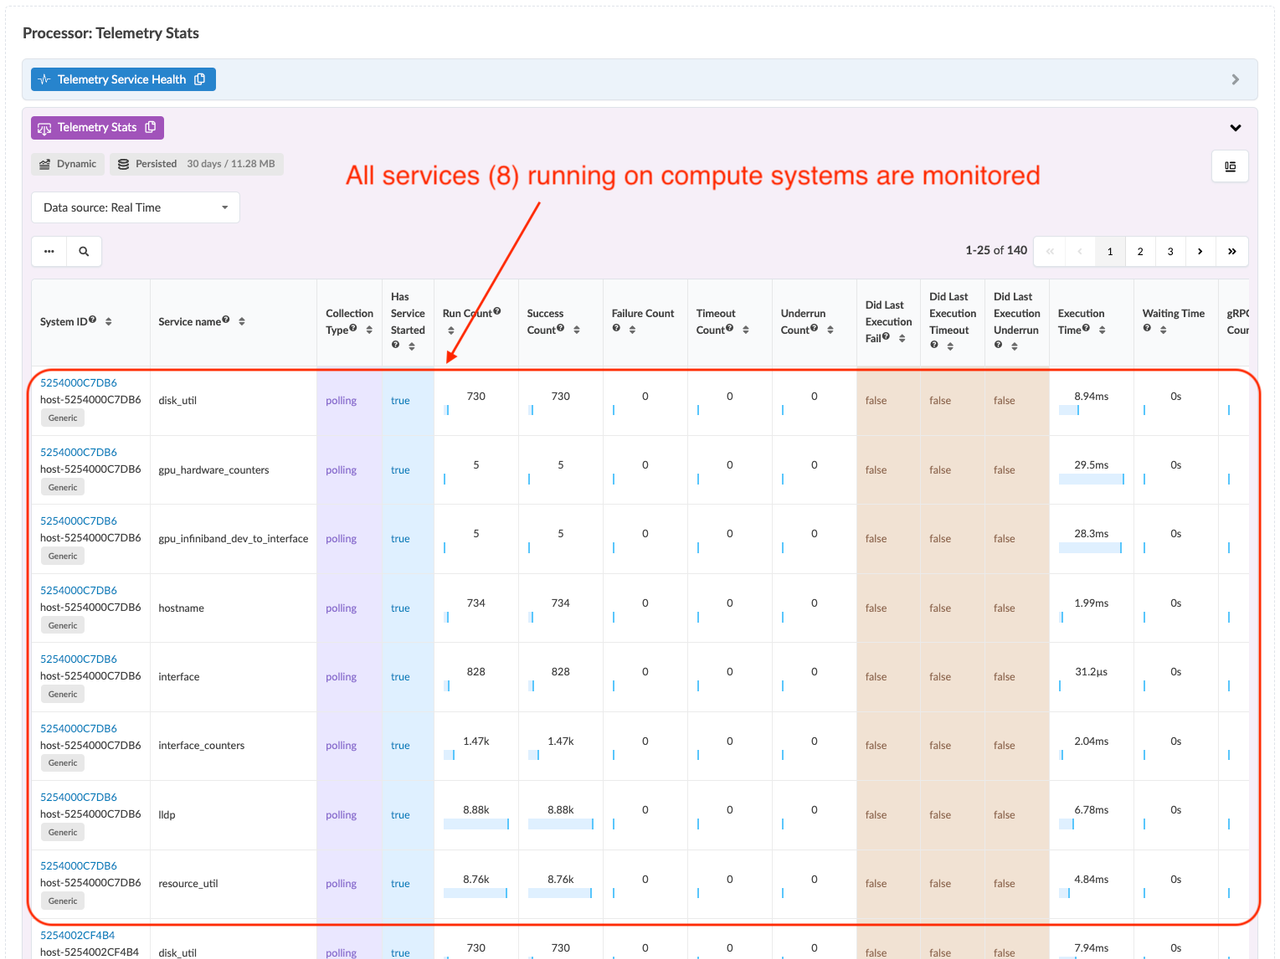
Existing Services:
-
Interface: Tracks the operational state and configuration of network interfaces.
-
Interface_Counters: Monitors interface statistics such as packet counts, errors, and drops. -
LLDP (Link Layer Discovery Protocol): Collects neighbor discovery information to verify topology and connectivity between devices.
-
Hostname: Ensures that the hostname of the device is defined correctly.
-
resource_util: Monitors system resource utilization, such as CPU, memory, and storage. -
disk_util: Monitors disk usage statistics, such as read/write operations and capacity utilization.
Services Added in 6.0:
-
gpu_hardware_counters: Monitors GPU hardware metrics such as utilization and performance counters. -
gpu_infiniband_dev_to_interface: Tracks the mapping between InfiniBand Mellanox interfaces and GPU NICS. Monitors the state of the interfaces.
Probe Settings
-
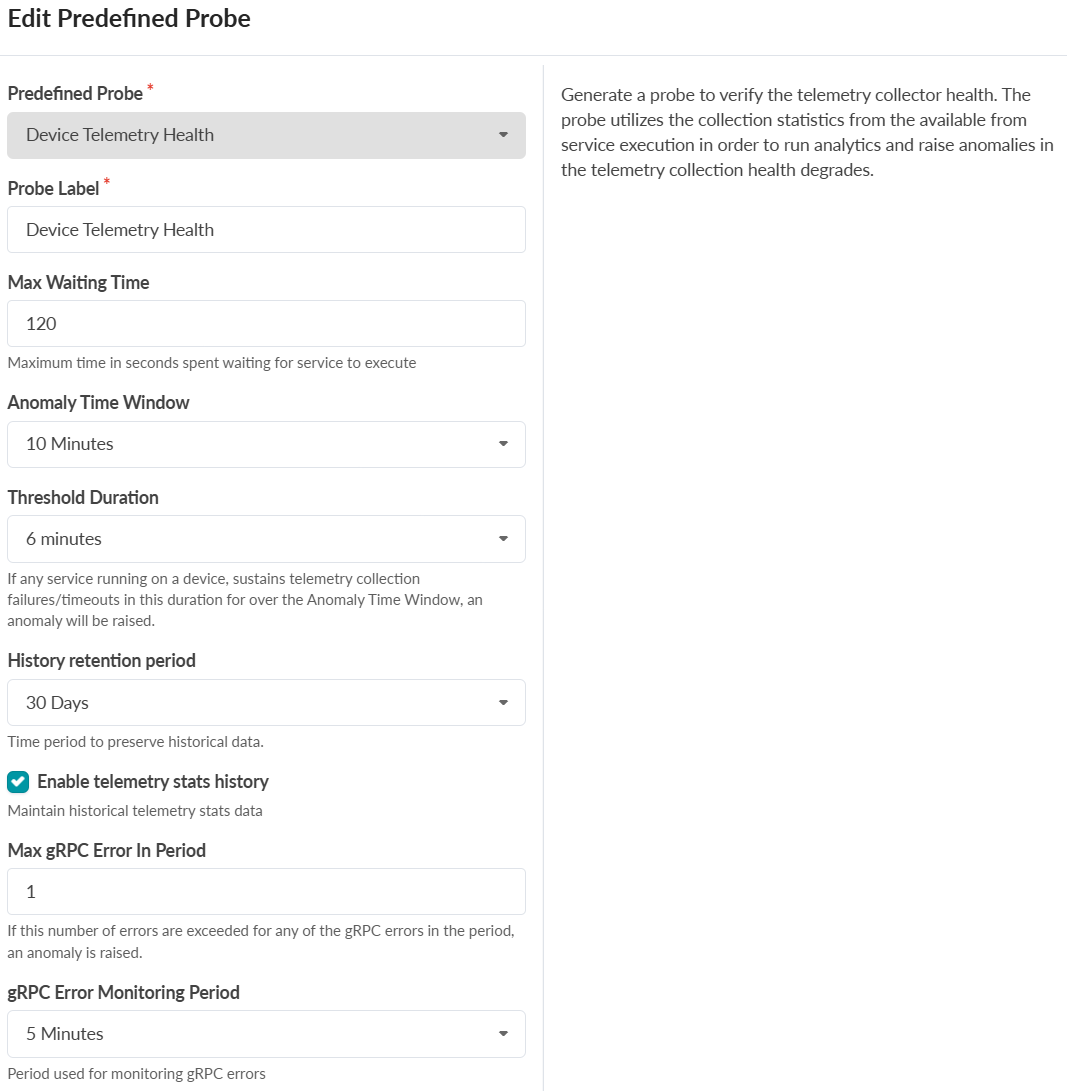
Max Waiting Time: 120 seconds (maximum time for service execution).
-
Anomaly Time Window: 10 minutes (observation period for anomalies).
-
Threshold Duration: 6 minutes (time required for sustained failures to trigger alerts).
-
History Retention Period: 30 days (time to retain telemetry data).
-
Max gRPC Errors in Period: 1 error (threshold for gRPC errors).
-
gRPC Error Monitoring Period: 5 minutes (time window for gRPC error tracking).