ON THIS PAGE
Device System Health Probe
Introduction
The Device Dystem Health probe alerts if the system health parameters (CPU, memory and disk usage) exceed their specified thresholds for the specified duration.
For more information about this probe, from the blueprint, navigate to Analytics > Probes, click Create Probe, then select Instantiate Predefined Probe from the drop-down list. Select the probe from the Predefined Probe drop-down list to see details specific to the probe.
In HPE Networking Apstra Data Center Director 6.0, the Device System Health Probe is enhanced to monitor generic systems, or GPU servers where a compute agent is installed. This means you can monitor metrics like CPU, memory, and disk utilization for both network devices and generic systems (GPU servers) using the same probe.
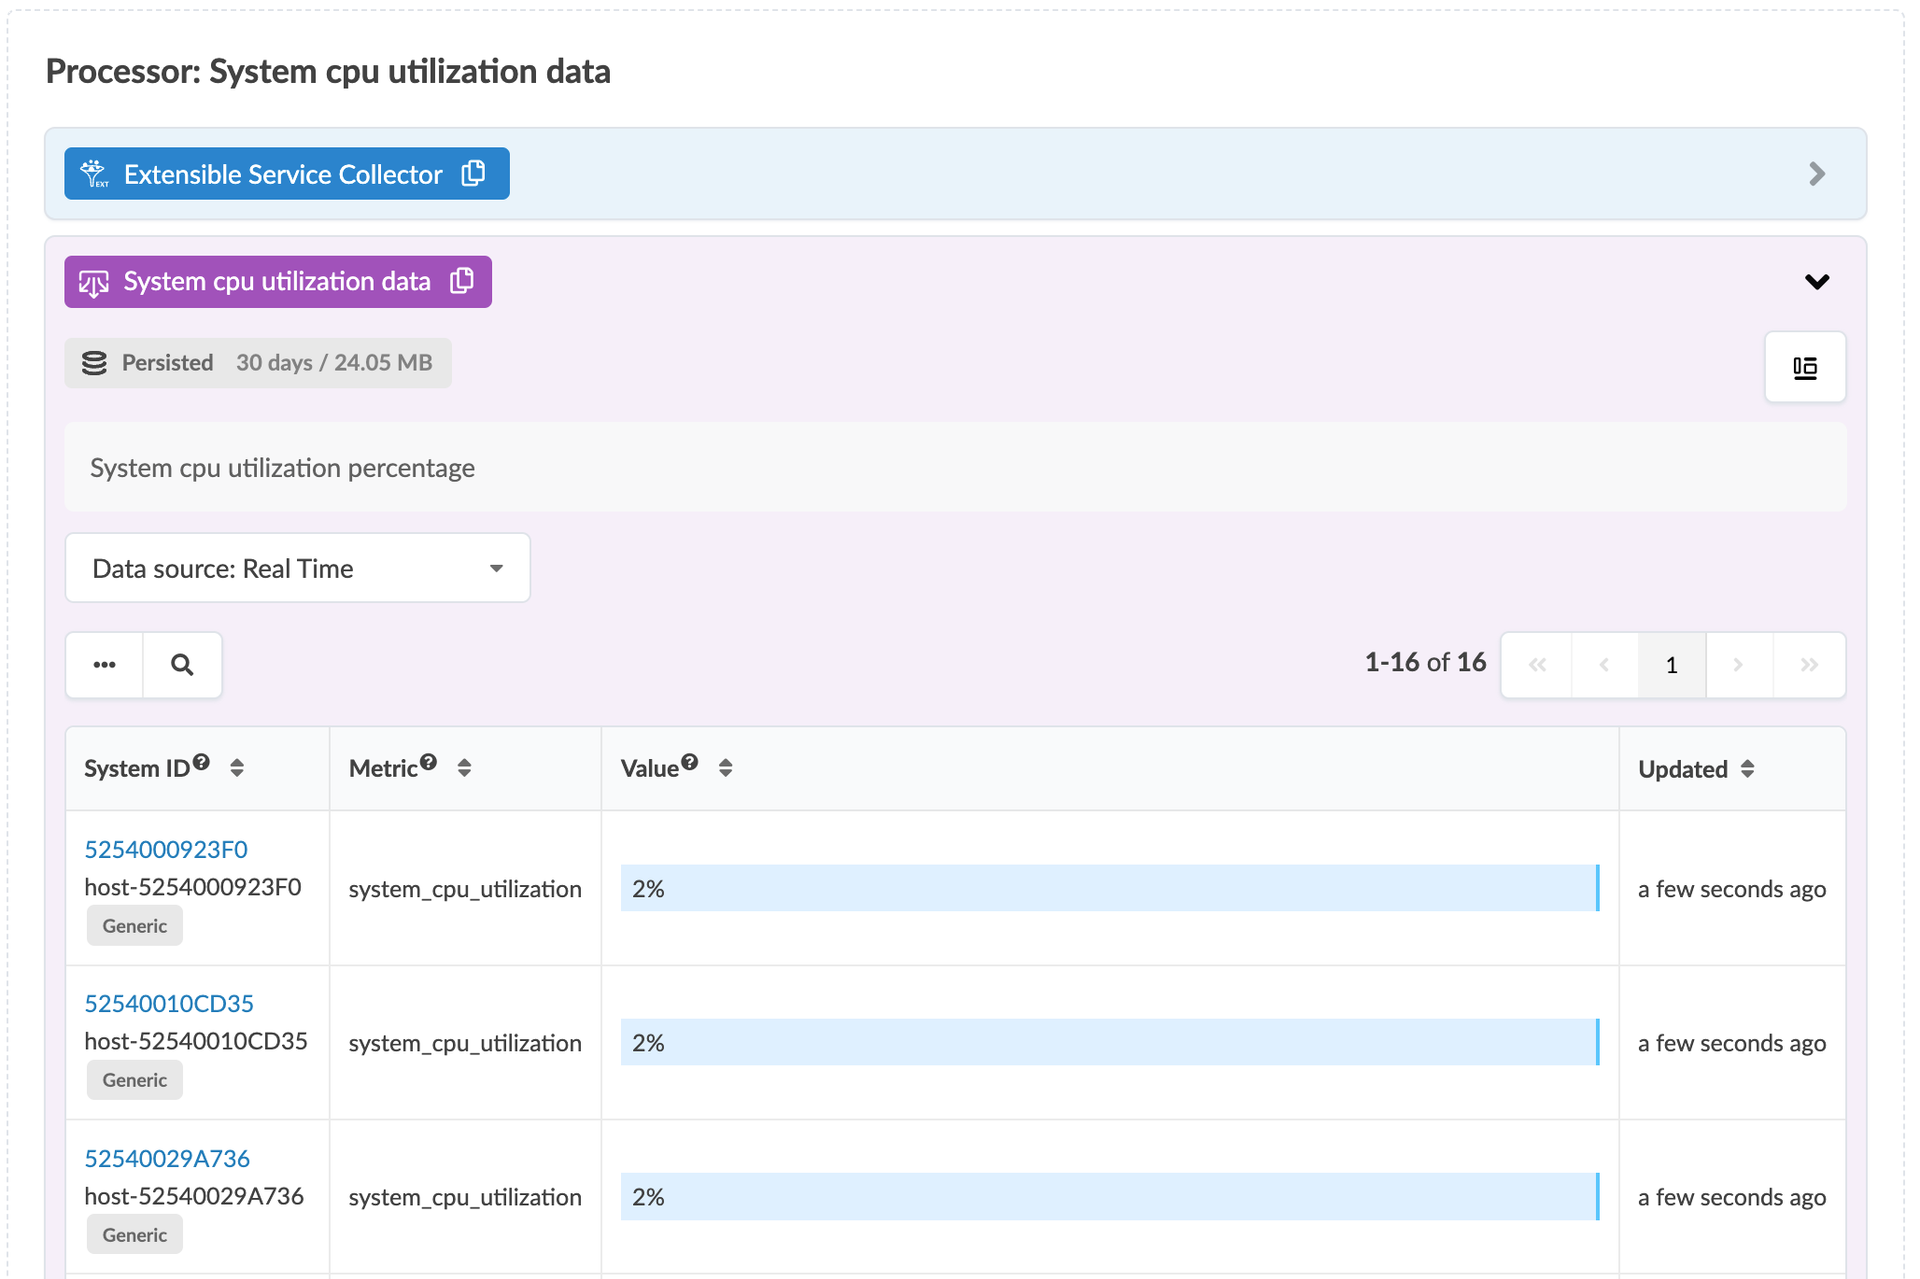
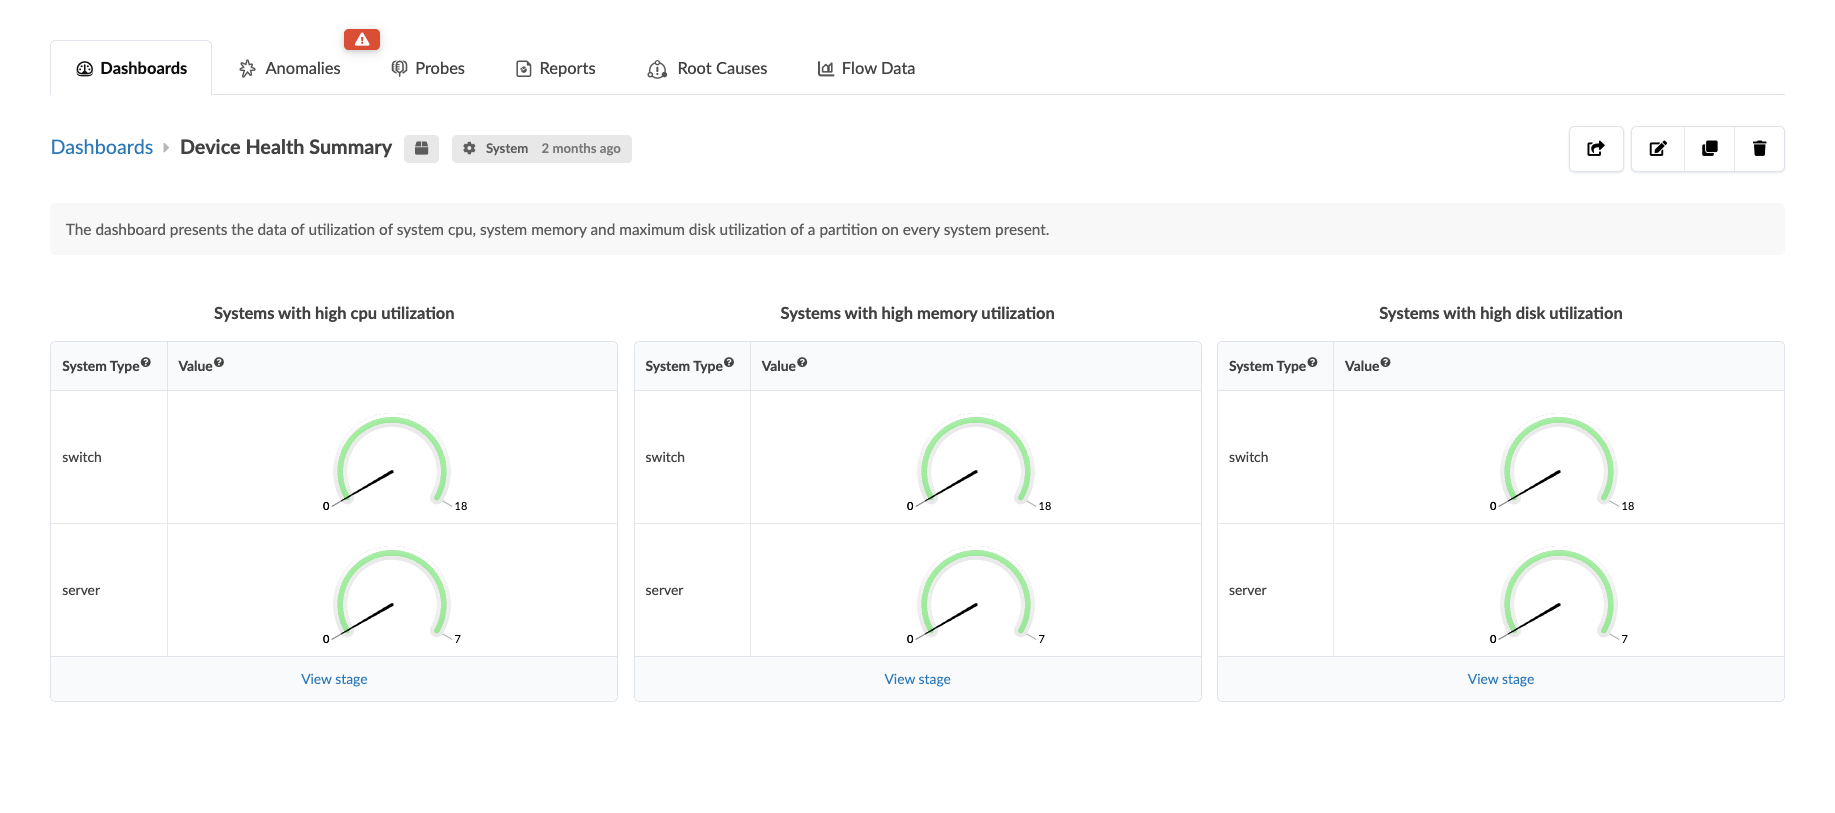
resource_util
and disk_util telemetry services which have been extended to
include generic systems where a compute agent is installed: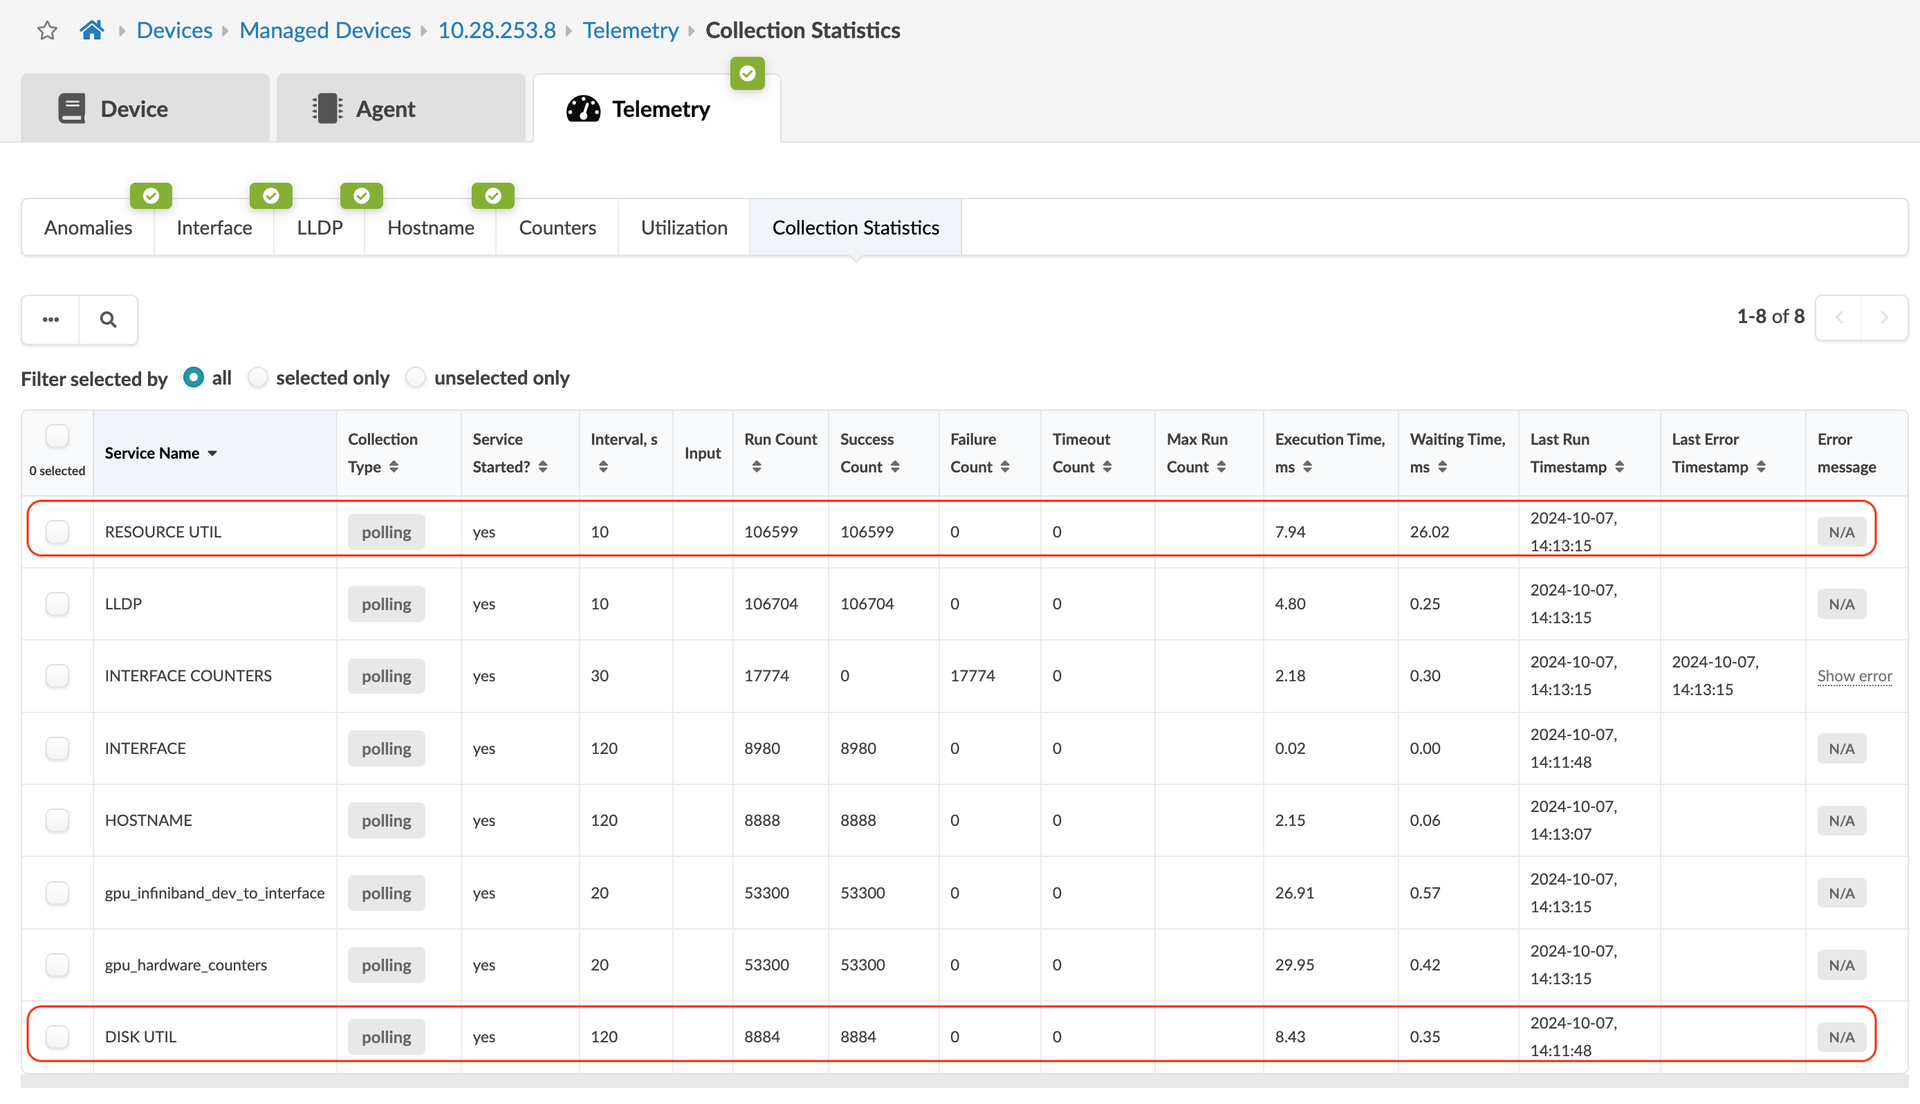
Probe Settings
-
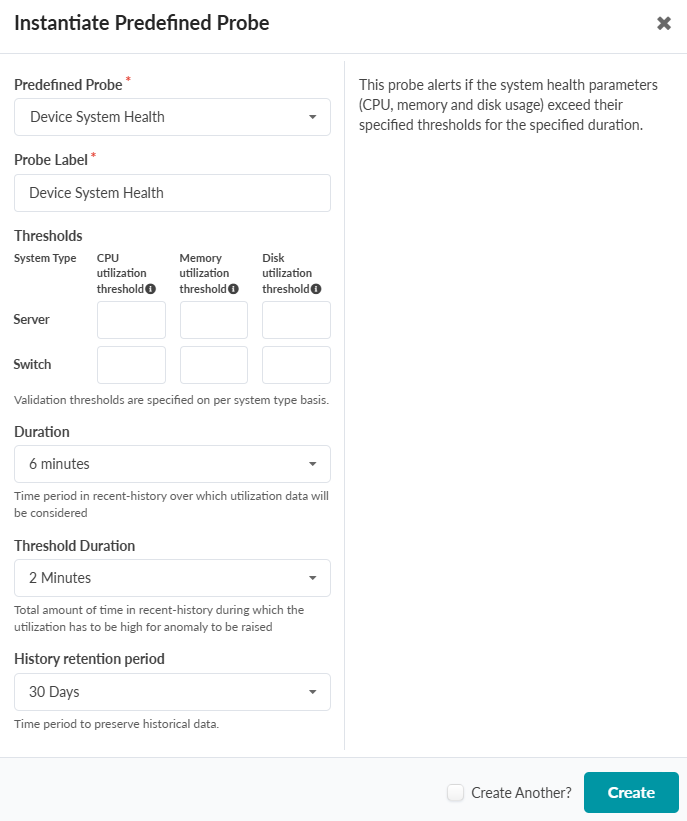
Thresholds:
-
System Type: Set different thresholds for servers and switches.
-
Set Thresholds: Define CPU, memory, and disk utilization threshold alert levels for each system type. If the threshold is exceeded, an anomaly is generated.
-
-
Duration: Specify how long utilization must exceed thresholds before an alert is triggered. The default value is 6 minutes.
-
Threshold Duration: Minimum time that utilization must remain high to trigger an alert. The default value is 2 minutes.