LLDP Anomaly Alerts

LLDP Validation

Existing versions (4.2, 5.0) support Link Layer Discovery Protocol (LLDP) and Hostname services on “generic” systems where an agent is deployed. The LLDP and Hostname services render an “Expected” configuration alongside the actual LLDP and hostname mapping information from neighbors.

As of version 6.0, anomalies are raised in the event of a mismatch between the expected configuration vs. the actual configuration. As a result, you can efficiently identify interface or topology mismatches.

For information about how to fetch LLDP in HPE Networking Apstra Data Center Director, see Fetch LLDP Data (Datacenter).
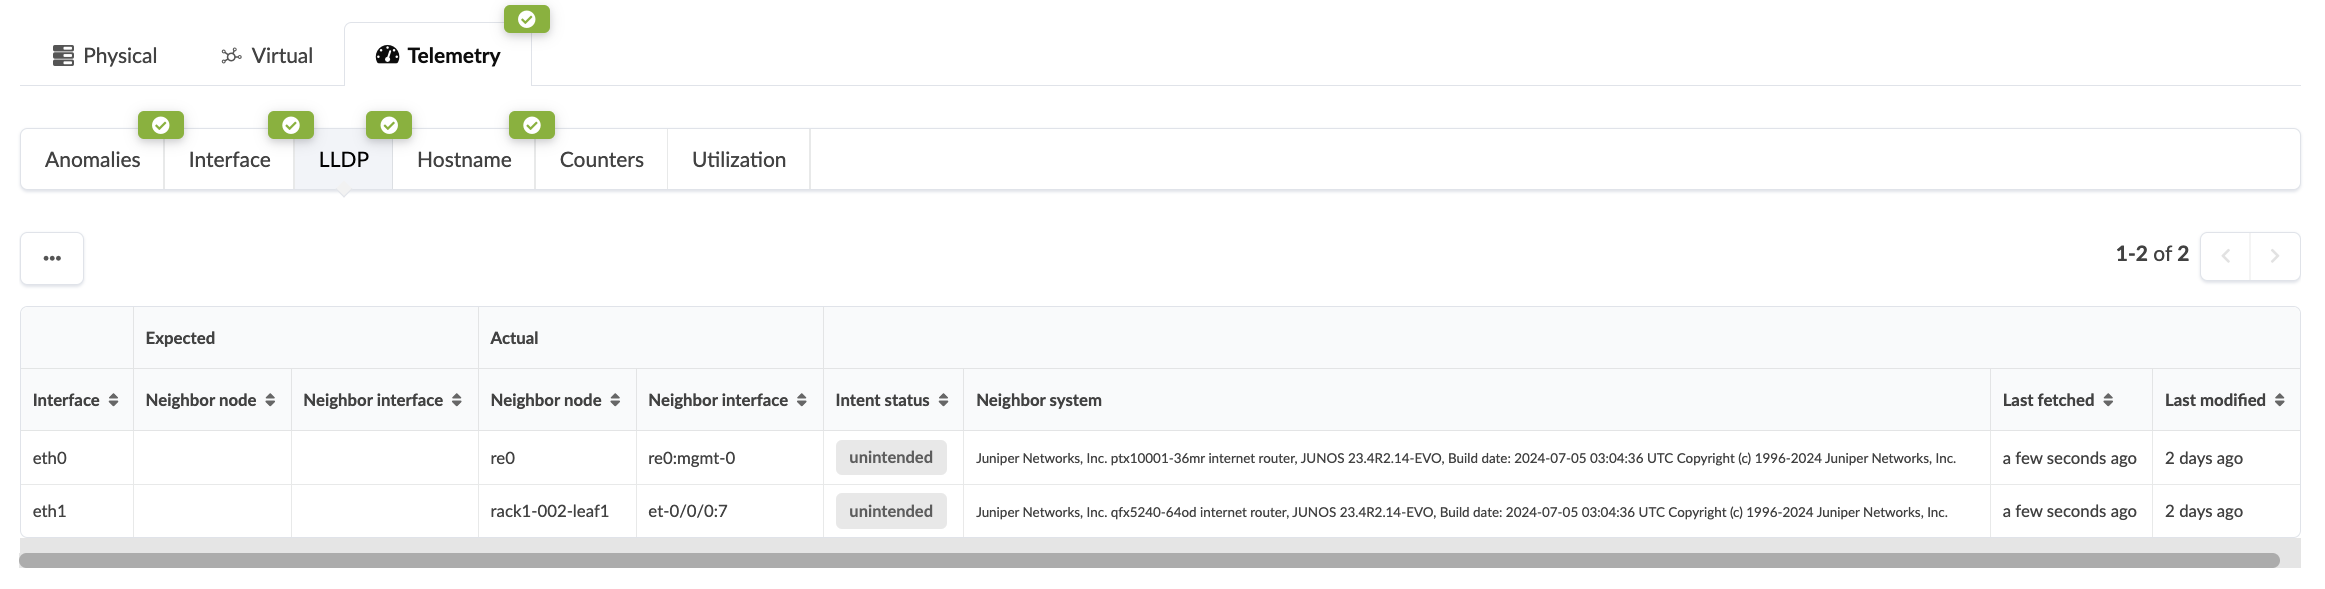
To view LLDP, Hostname, and other telemetry service information for a device, navigate to Devices > Managed Devices > select a device > Telemetry.

Network telemetry interface displaying LLDP data with tabs for Physical, Virtual, Telemetry, and sub-tabs like Anomalies, Interface, LLDP. Table shows interface connections, neighbor nodes, intent status, and system details.

In the image below, the system detects a mismatch between the Expected and Actual link mapping for several interfaces. Note that the red anomaly notification also displays in the Anomalies tab.
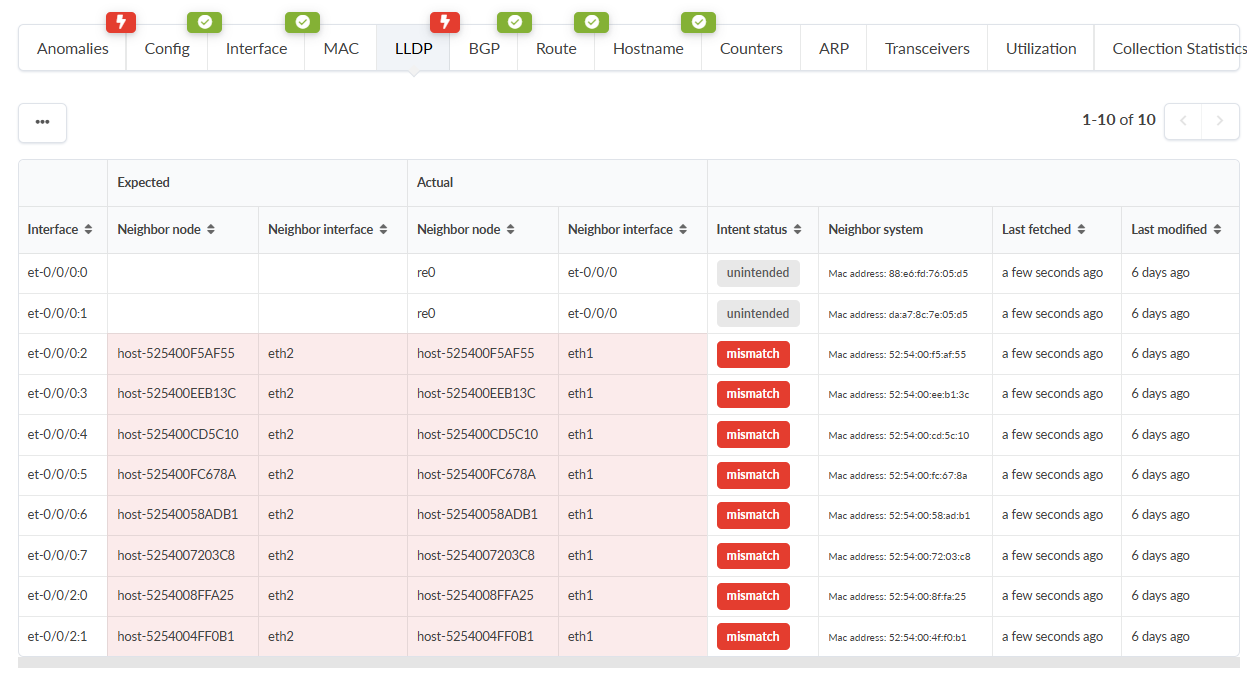
Network monitoring tool screenshot displaying LLDP information. Tabs provide diagnostic functionalities like Config and Utilization. Table shows expected vs. actual configurations, interface details, and neighbor nodes. Red-highlighted rows indicate configuration mismatches.
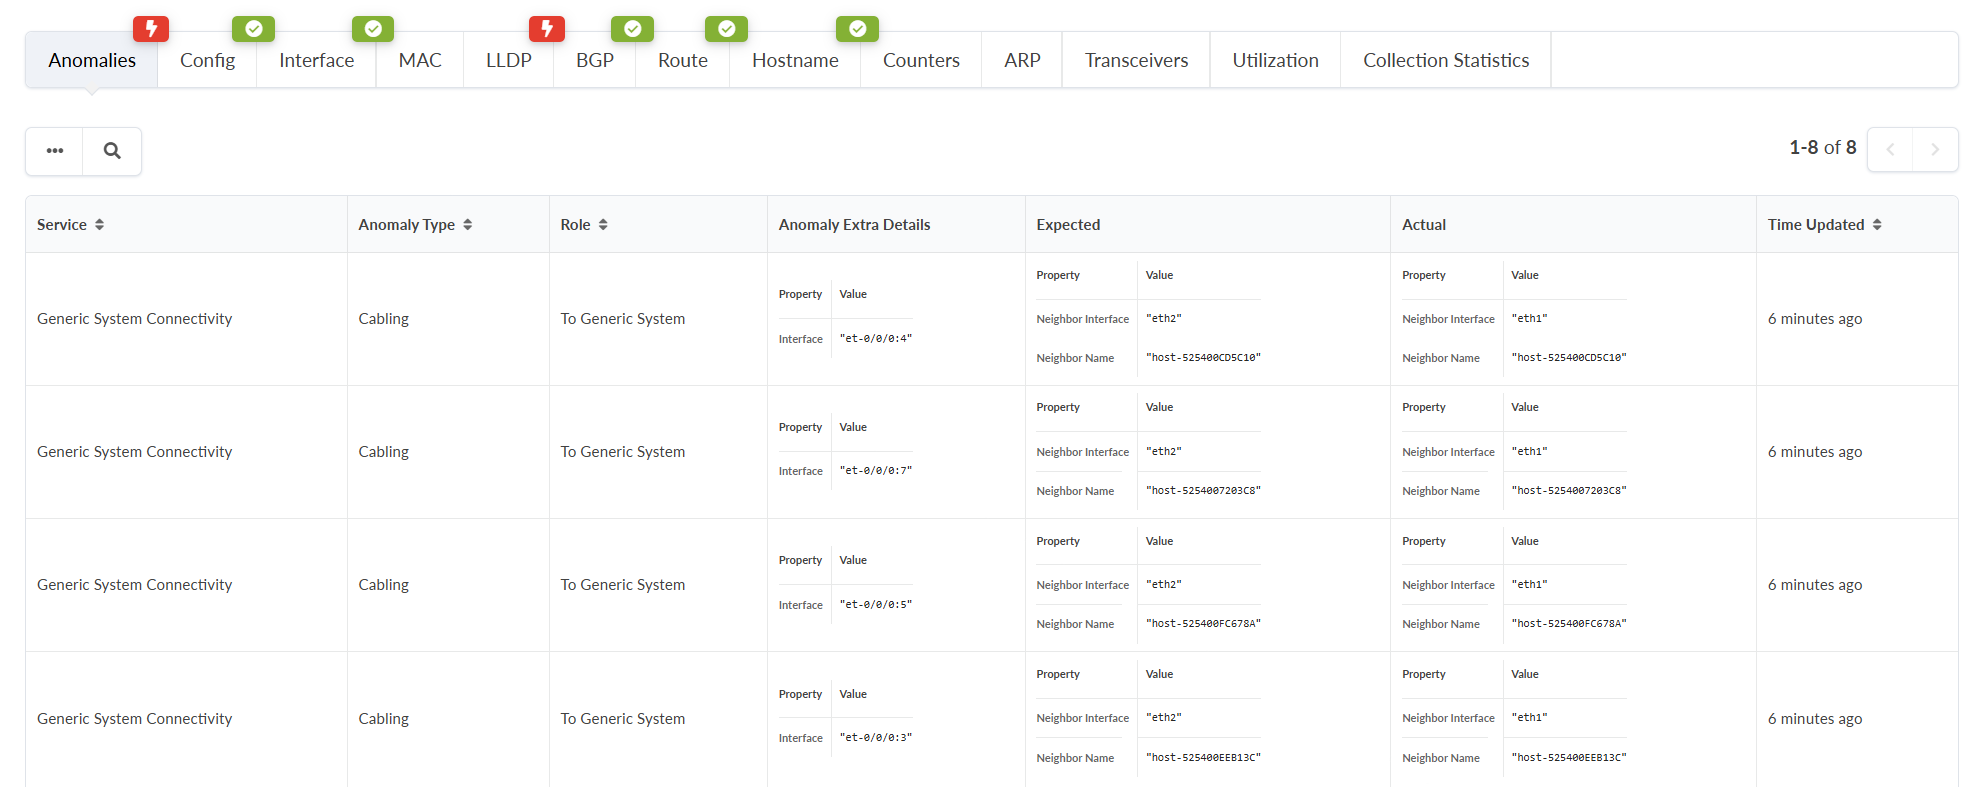
Selecting the Anomalies tab provides additional details about the interface mismatch anomalies in this example.

Network monitoring interface table showing connectivity anomalies with columns for Service, Anomaly Type, Role, Anomaly Details, Expected, Actual, and Time Updated. Navigation tabs include Config, Interface, MAC, LLDP, BGP, Route, Hostname, Counters, ARP, Transceivers, Utilization, and Collection Statistics.

To quickly resolve these anomalies, we can use the Cabling Map Editor. From your blueprint, navigate to Staged > Physical > Links.

If an LLDP anomaly alert is not already displayed, you can select a rack, fetch LDDP data, and filter the information to identify the affected links.
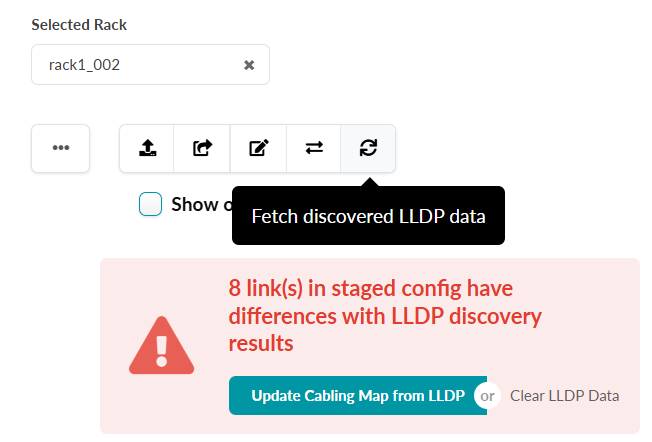
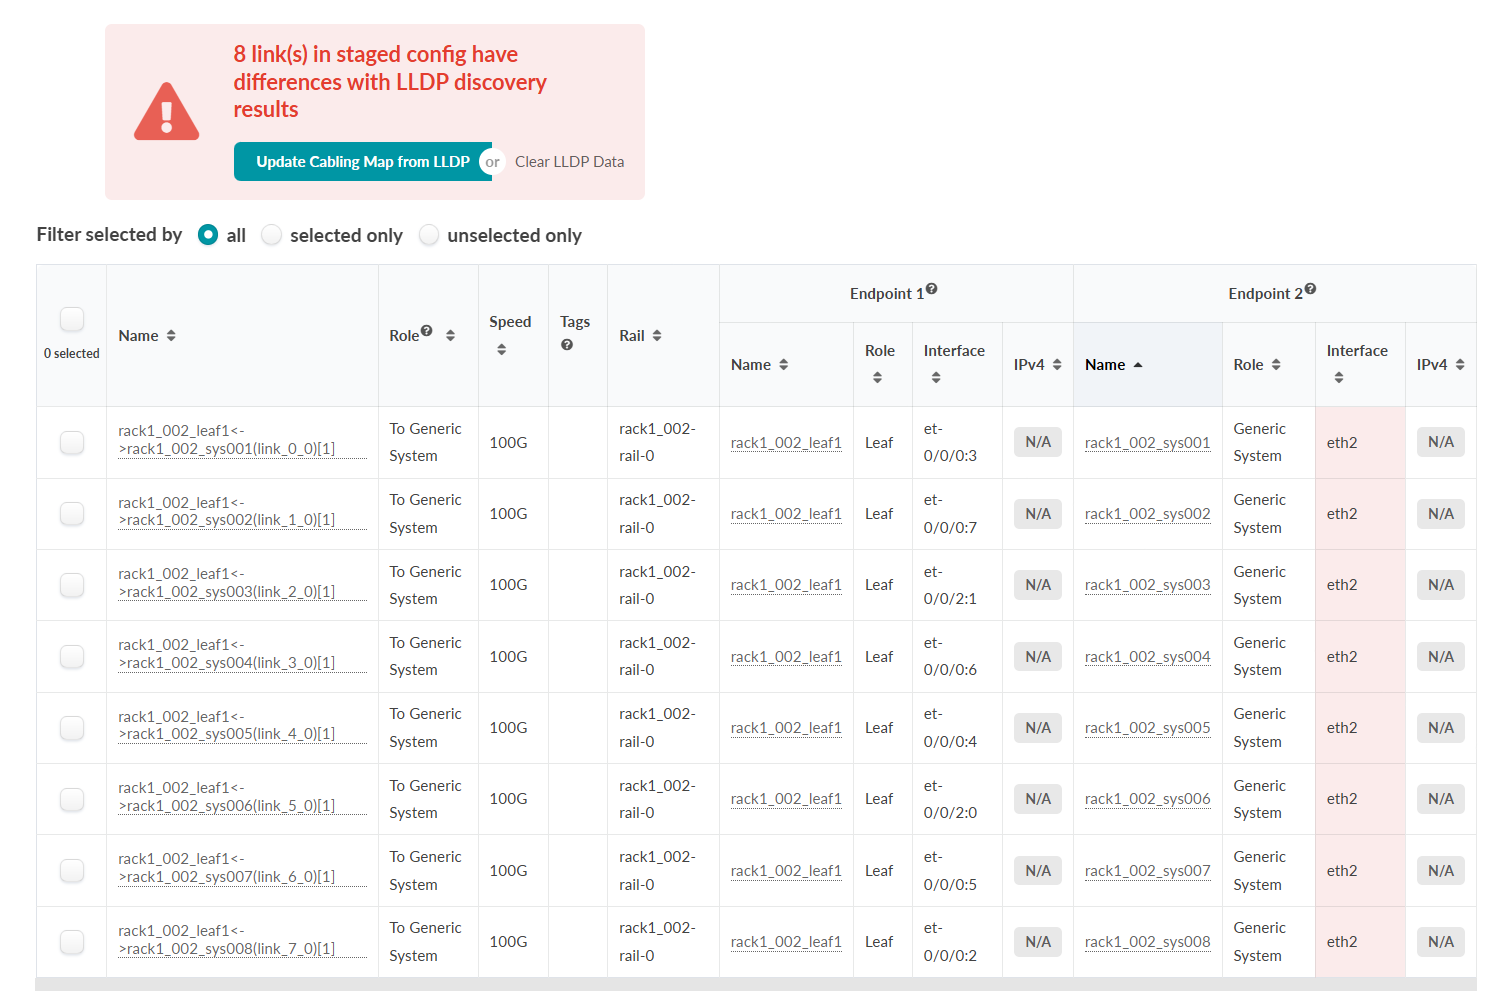
In this example, we select "rack1_002", click the Fetch discovered LLDP data button, and select the Show only link with LLDP diff? button.

Selected rack labeled rack1_002 with a warning: 8 links in staged config differ from LLDP discovery results. Options to fetch LLDP data, update cabling map, or clear LLDP data. Red triangle icon highlights the issue. Buttons available to resolve.
The list of interface anomalies displays, along with an alert at the top.

Screenshot of a network management interface showing a table with network links and LLDP results. A warning states 8 links have differences with LLDP results. Options to update cabling map or clear LLDP data are available. Table columns include link names, roles, speed, tags, rail, and endpoint details. Red shading highlights discrepancies in the Interface column under Endpoint 2.

Click the Update Cabling Map from LLDP button in the alert, and the Cabling Map Editor window displays. Click Update. Review the changes in the Uncomitted tab, and Commit.
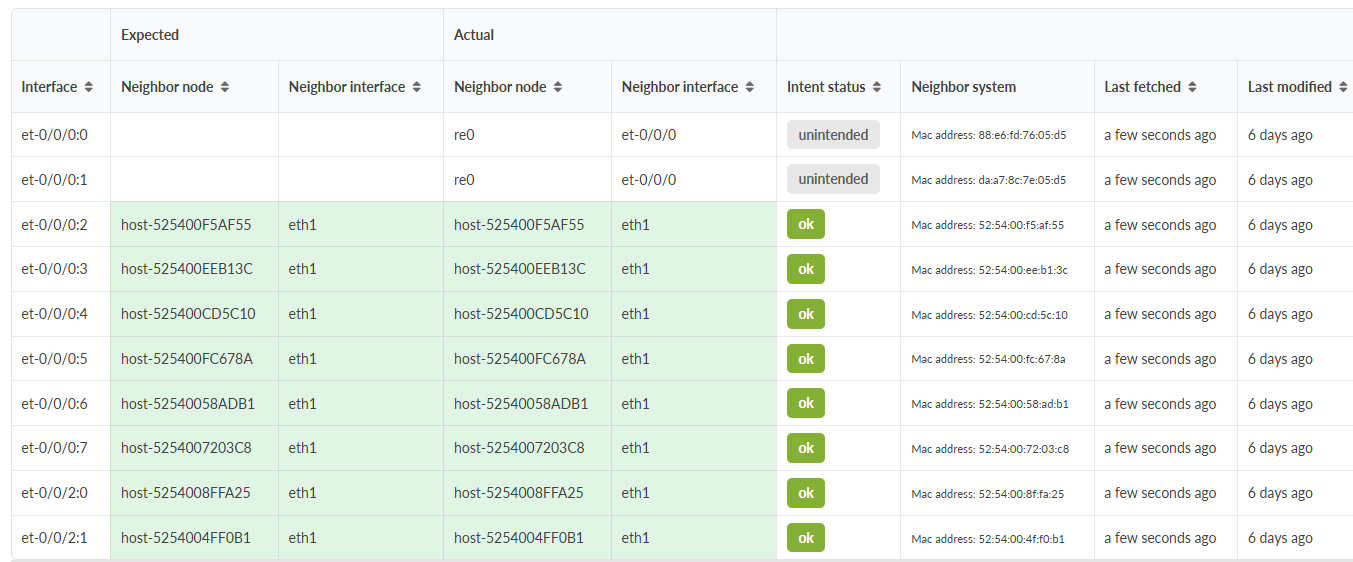
In the LLDP telemetry view for the selected device, the Expected LLDP information for the previous anomalies matched the Actual.

Table showing network interfaces, expected and actual neighboring nodes and interfaces, intent status, neighbor system details, last fetched and modified dates. Green rows indicate matches; gray rows indicate mismatches.