Cluster Management
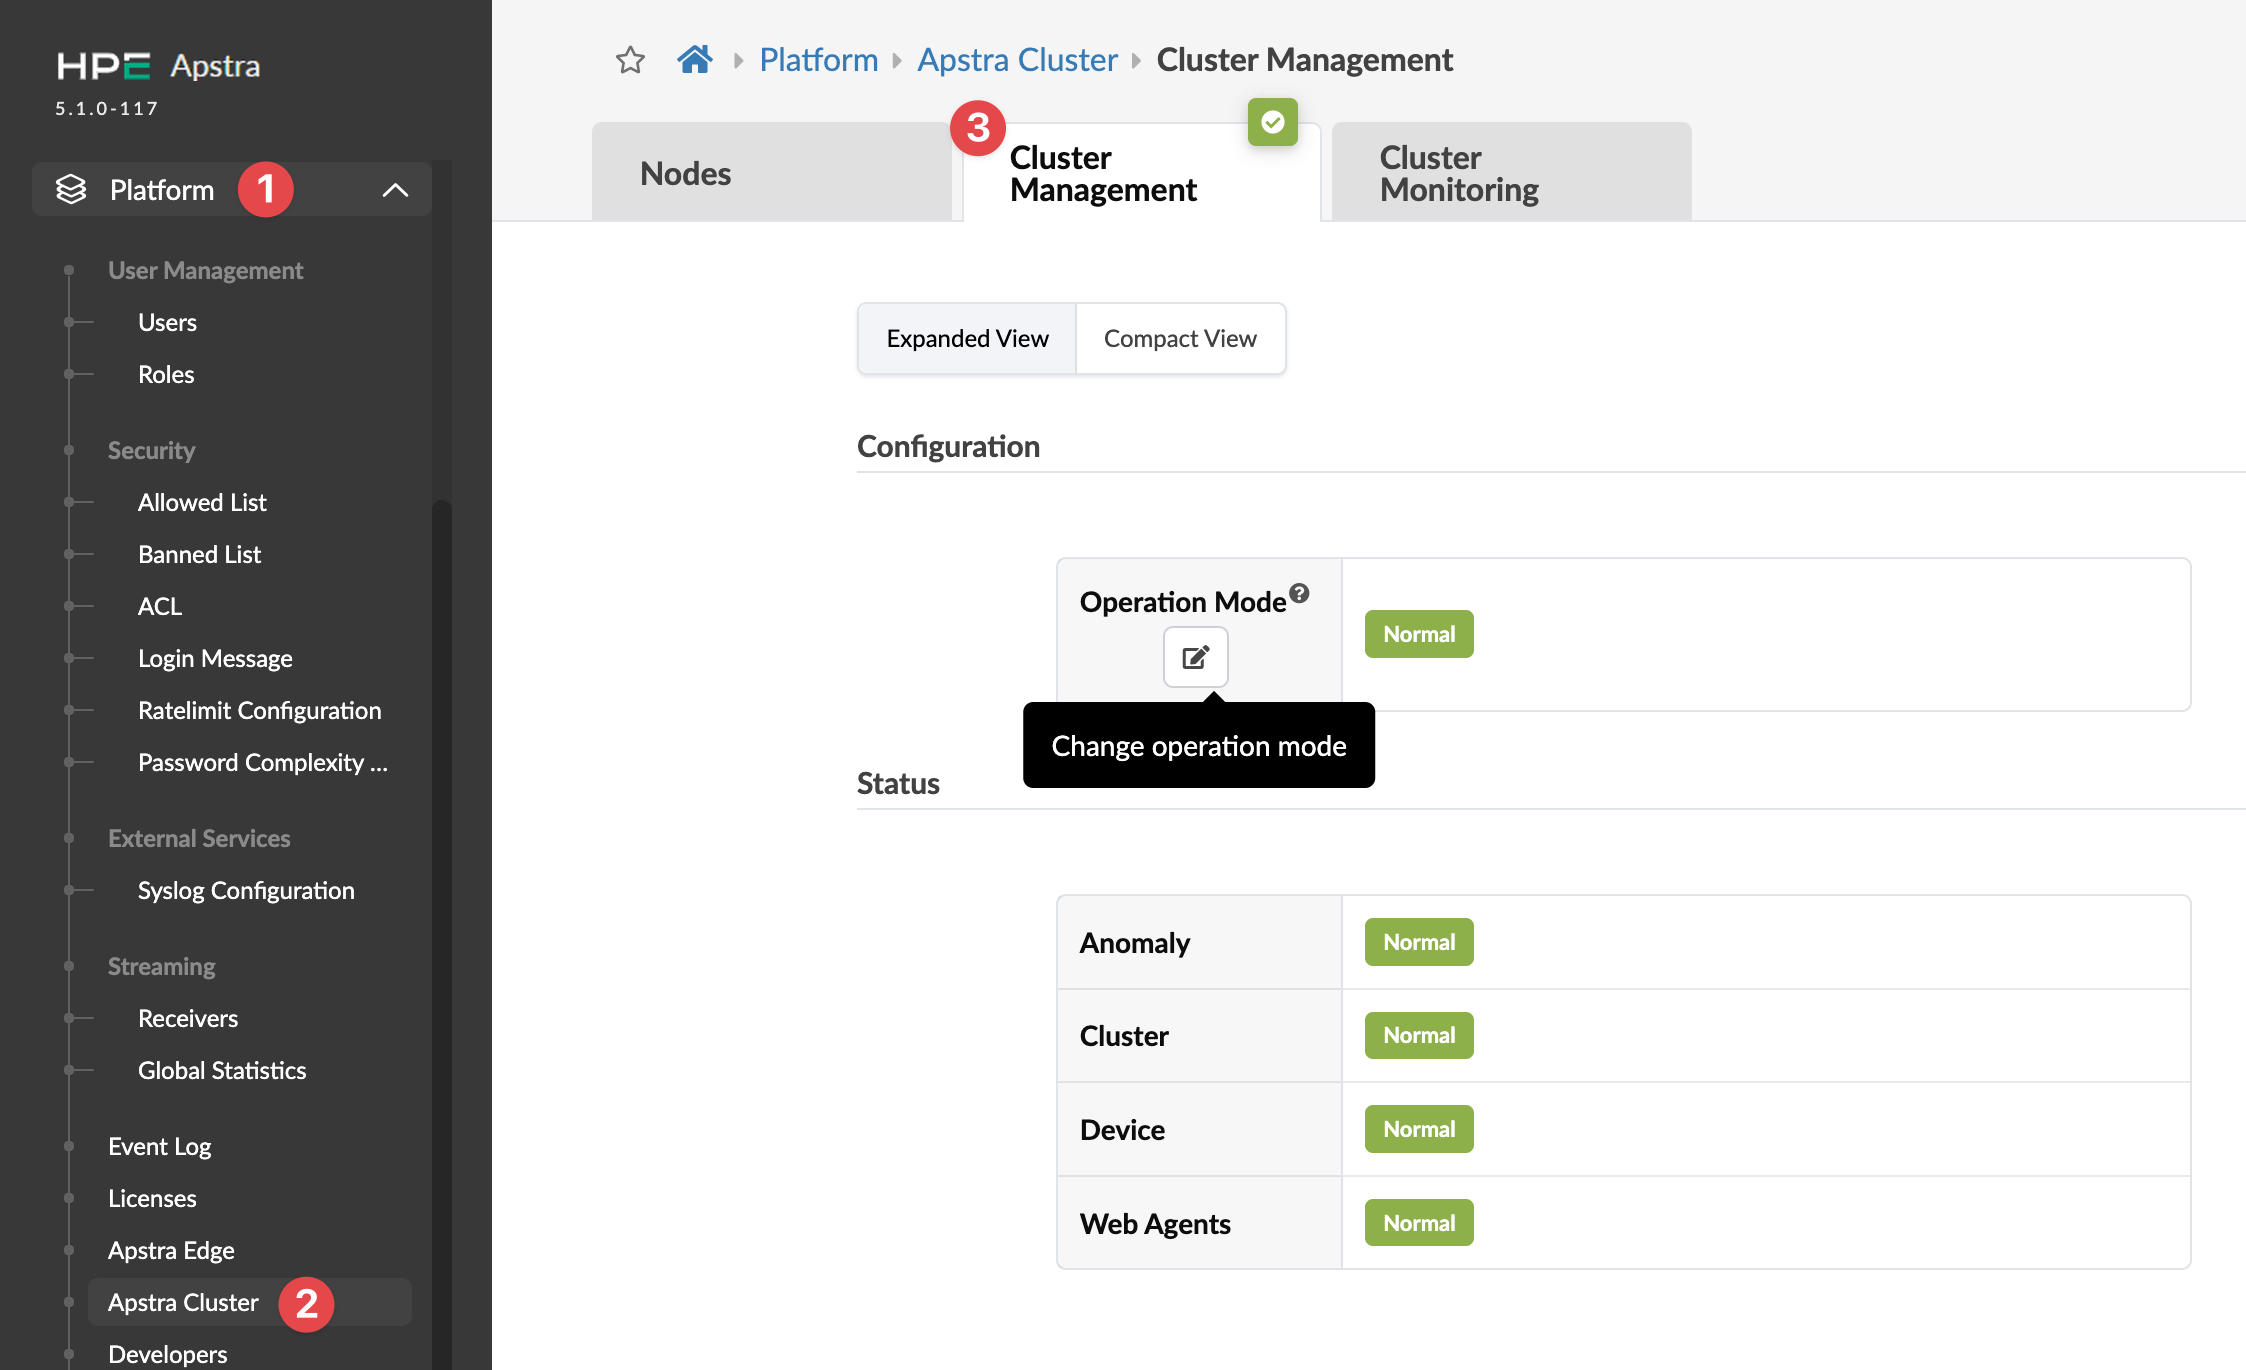
From the left navigation menu, navigate to Platform > Apstra Cluster > Cluster Management to go to cluster configuration and status information.
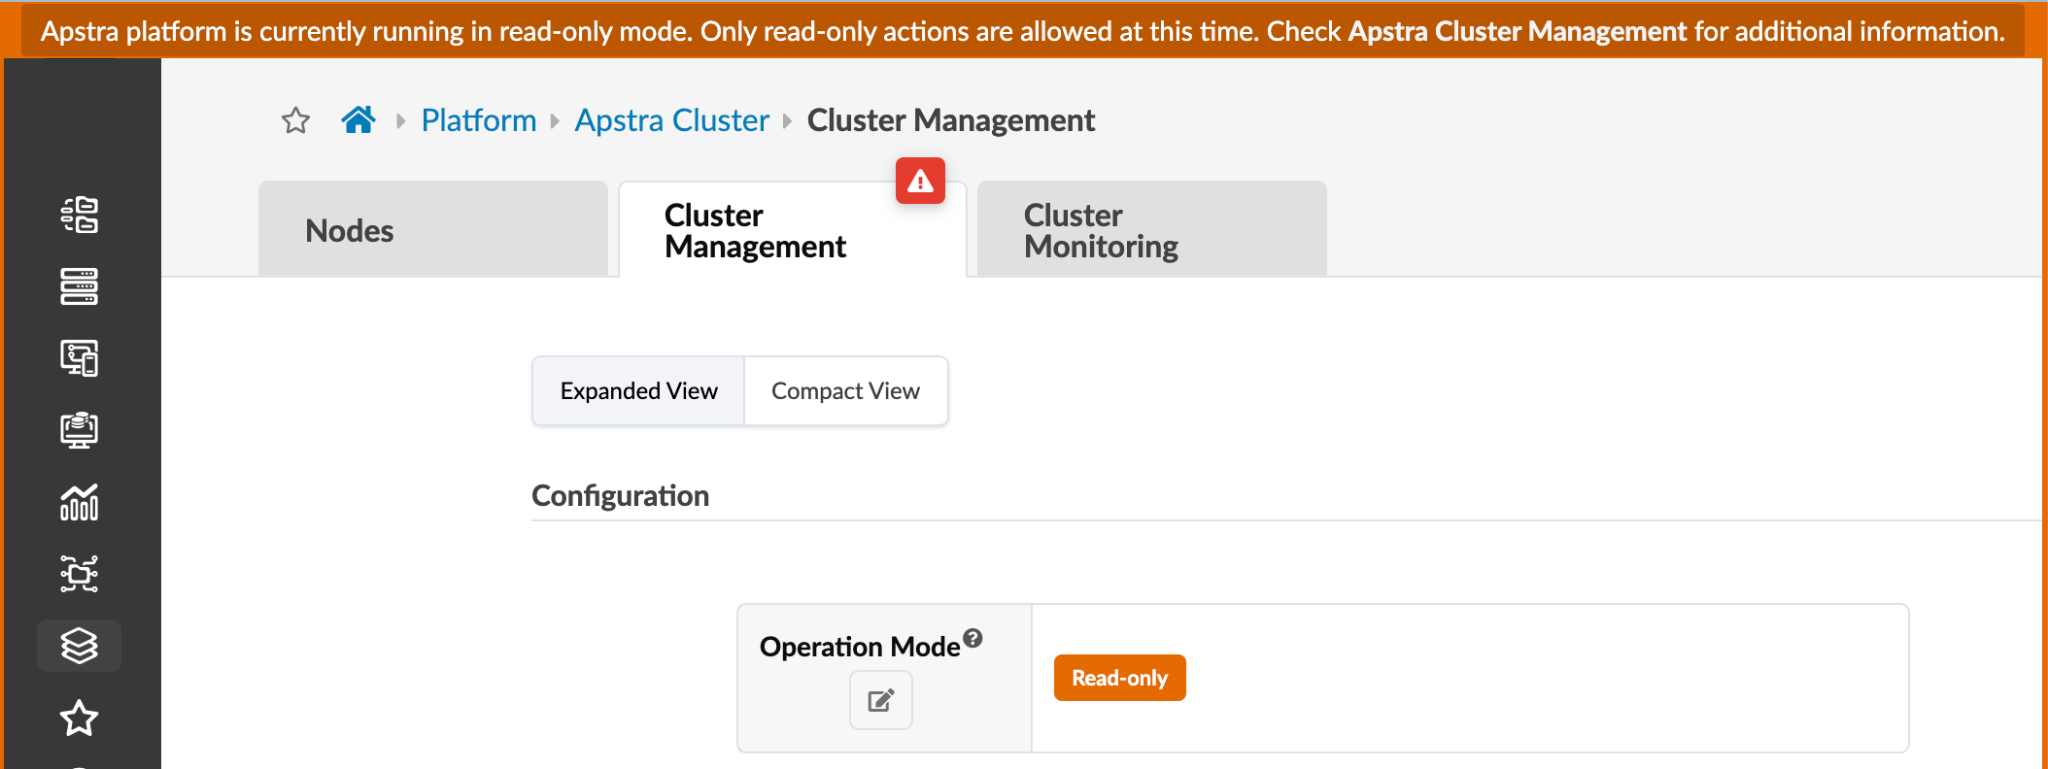
Admins may want to temporarily block all users (including themselves) from performing design and blueprint changes in the software environment because they're troubleshooting something, or want to perform some maintenance operations on the server (backups, VM migration, VM OS updates and so on).
Admins can change the operation mode from Normal to Read-only to block users from API and WebUI (PUT/POST). By default, only admins have permission to enable/disable the read-only mode.
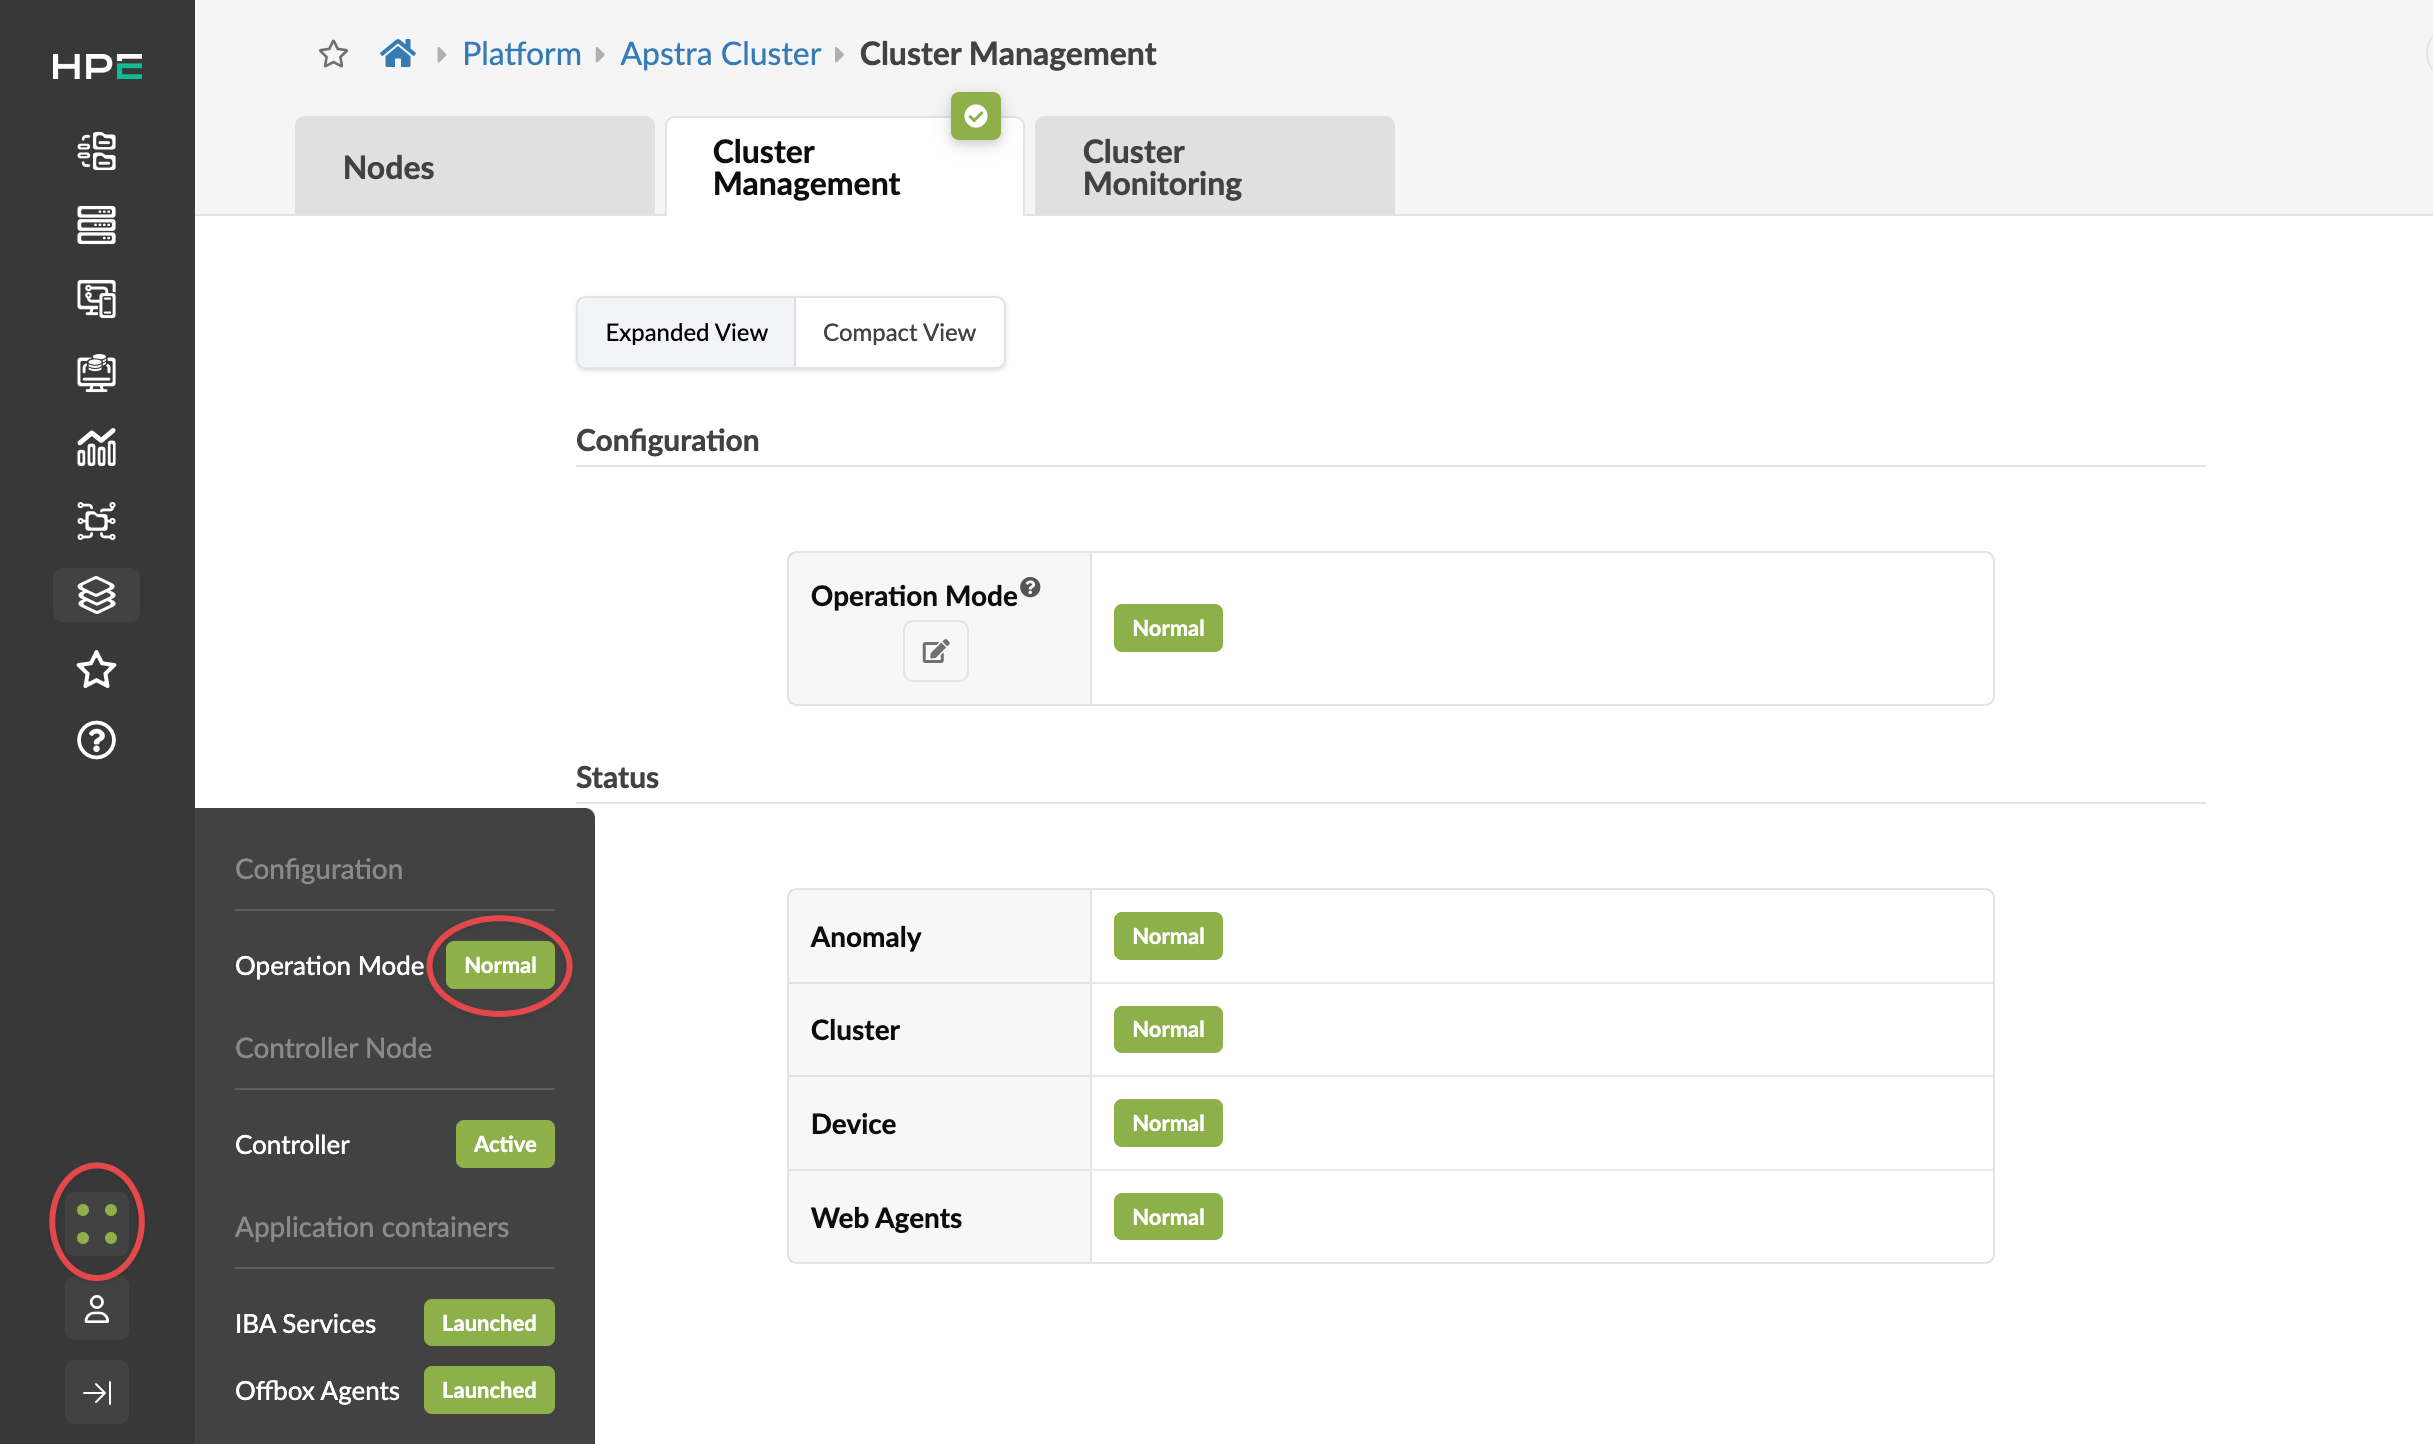
At the bottom left section of every page, you have continuous visibility of platform health. Green indicates the active state. Red indicates some kind of issue, such as a missing agent, the disk being in read only mode, or an agent rebooting (after the agent has rebooted, the status returns to active).
From any page in the software environment, click one of the dots, then click the section that you want details for. Clicking Operation Mode takes you to the Cluster Management page. (Clicking any of the others takes you to the Nodes page.)