PTX12008 Status Panel
This topic describes the status panel for the PTX12008.
Status Panel Overview
The status panel on the front panel of the PTX12008 is a touch panel that indicates the status of the chassis and the router components.
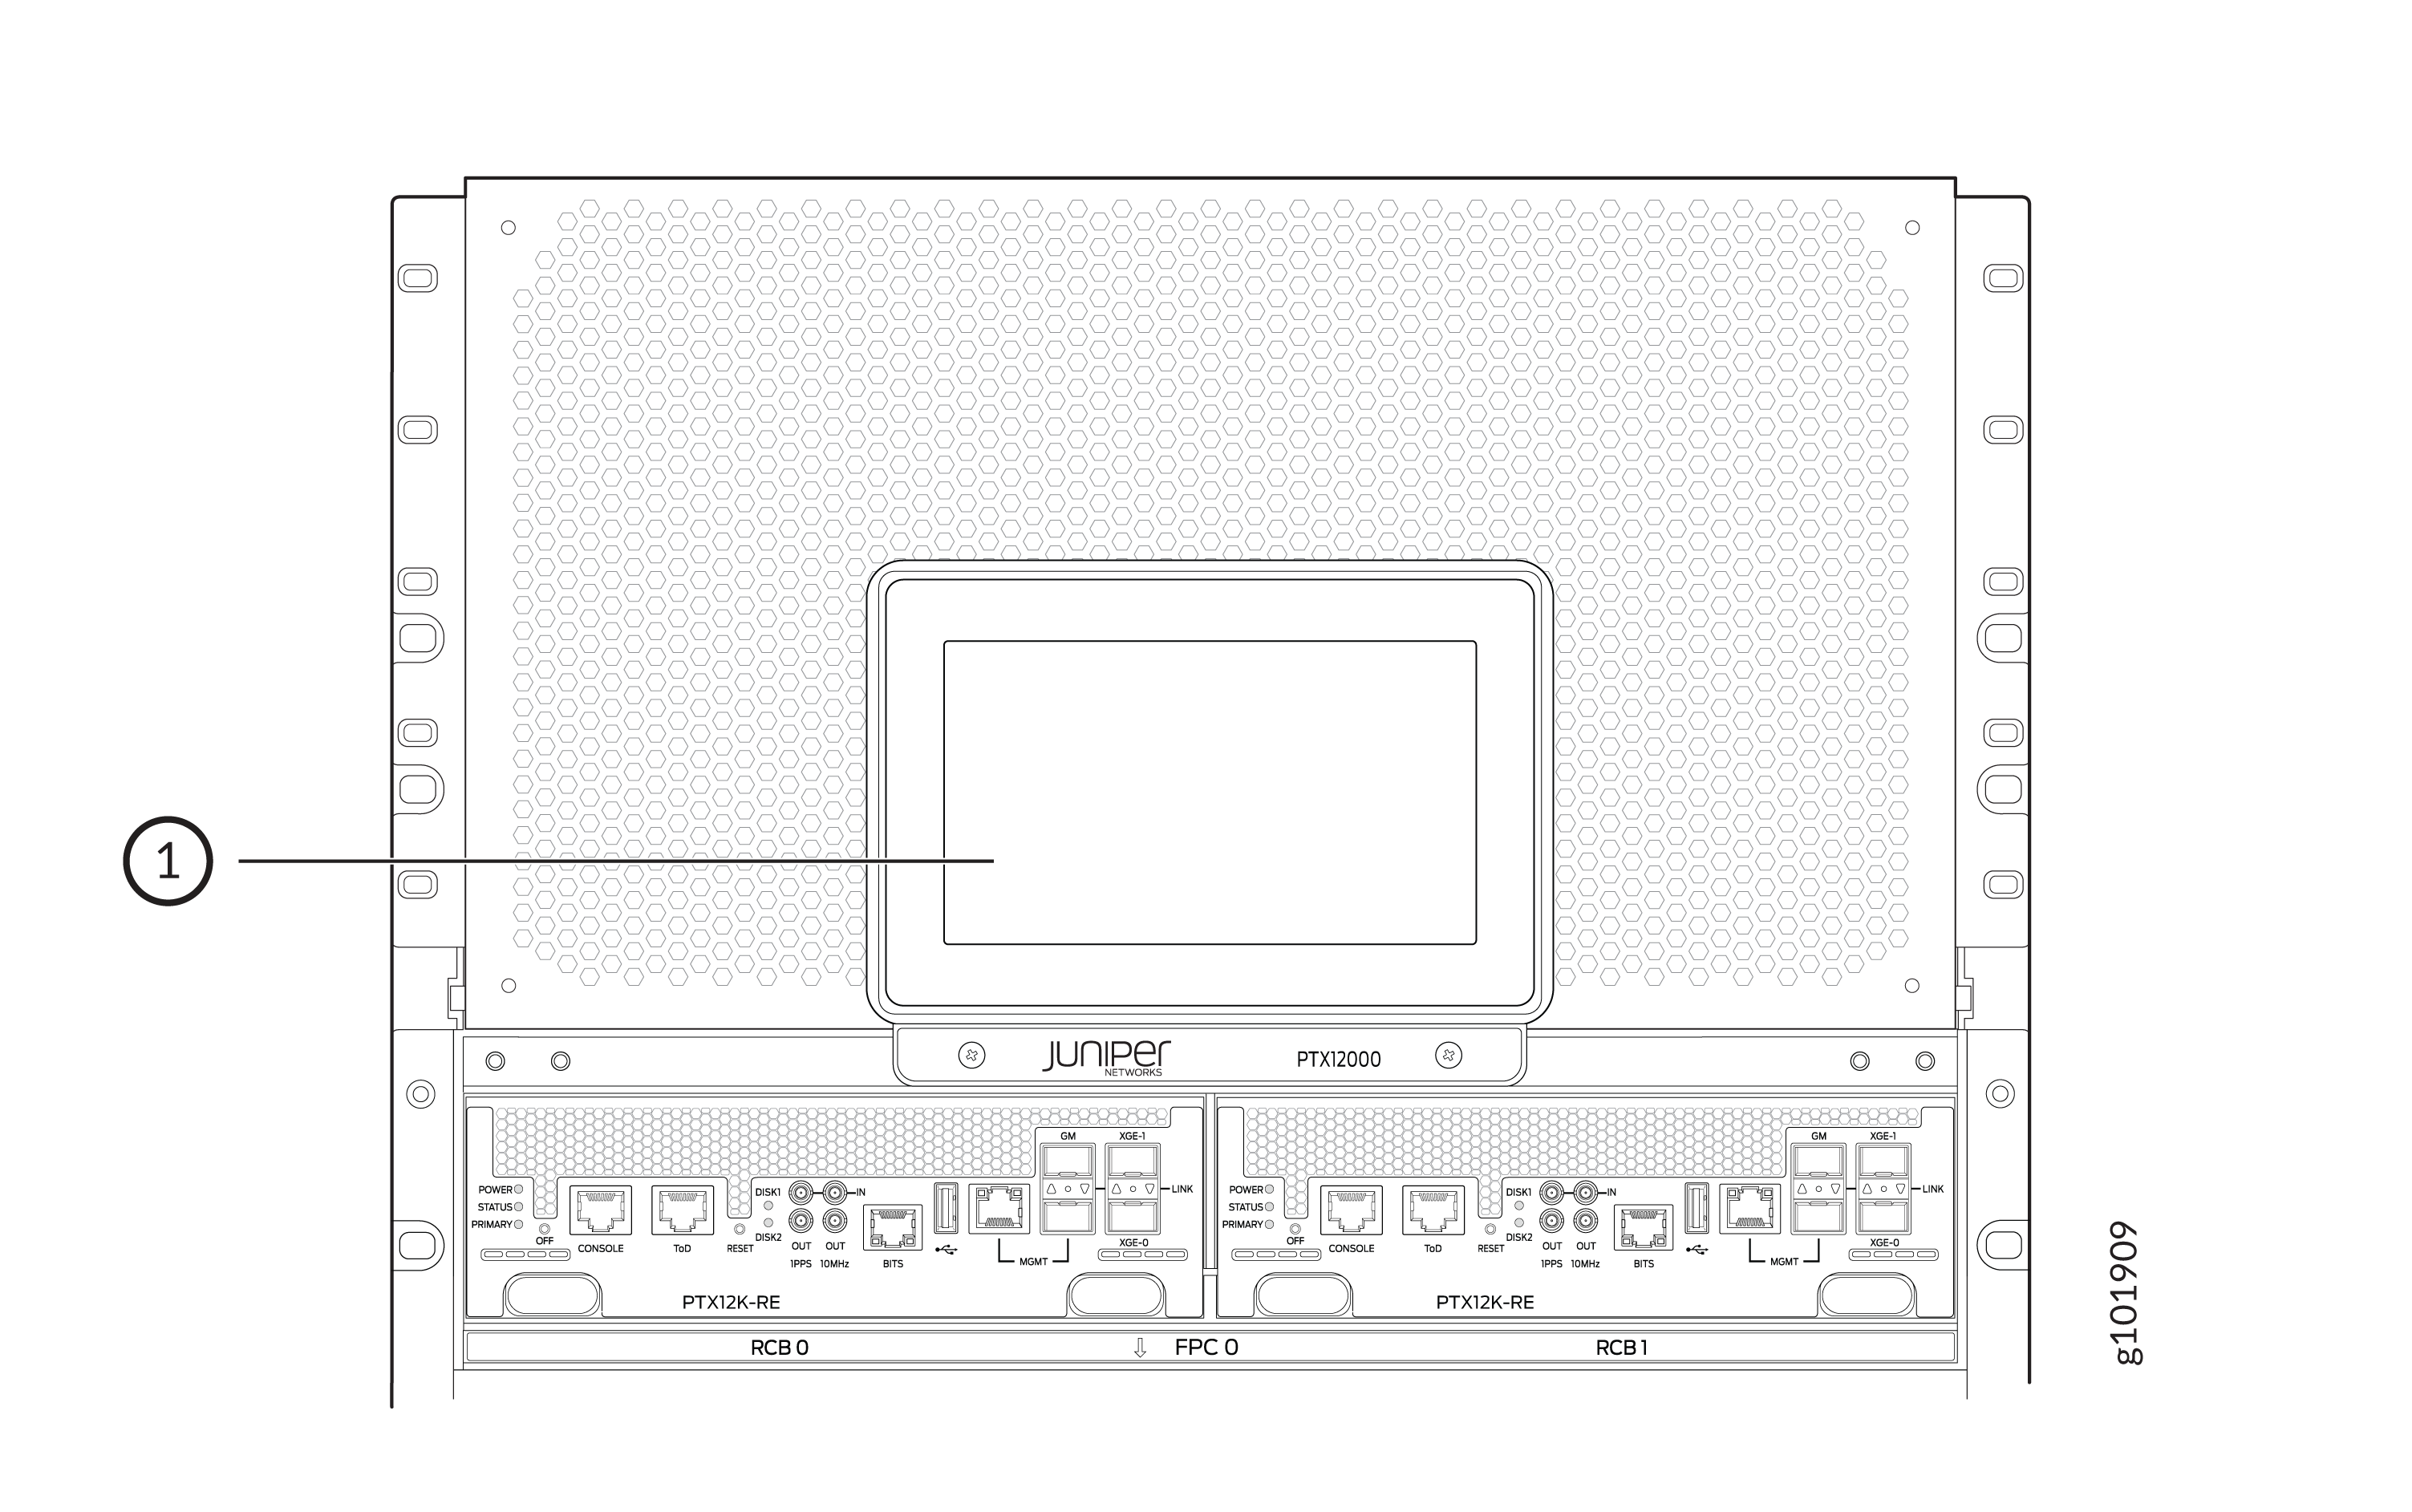
1 — Status panel |
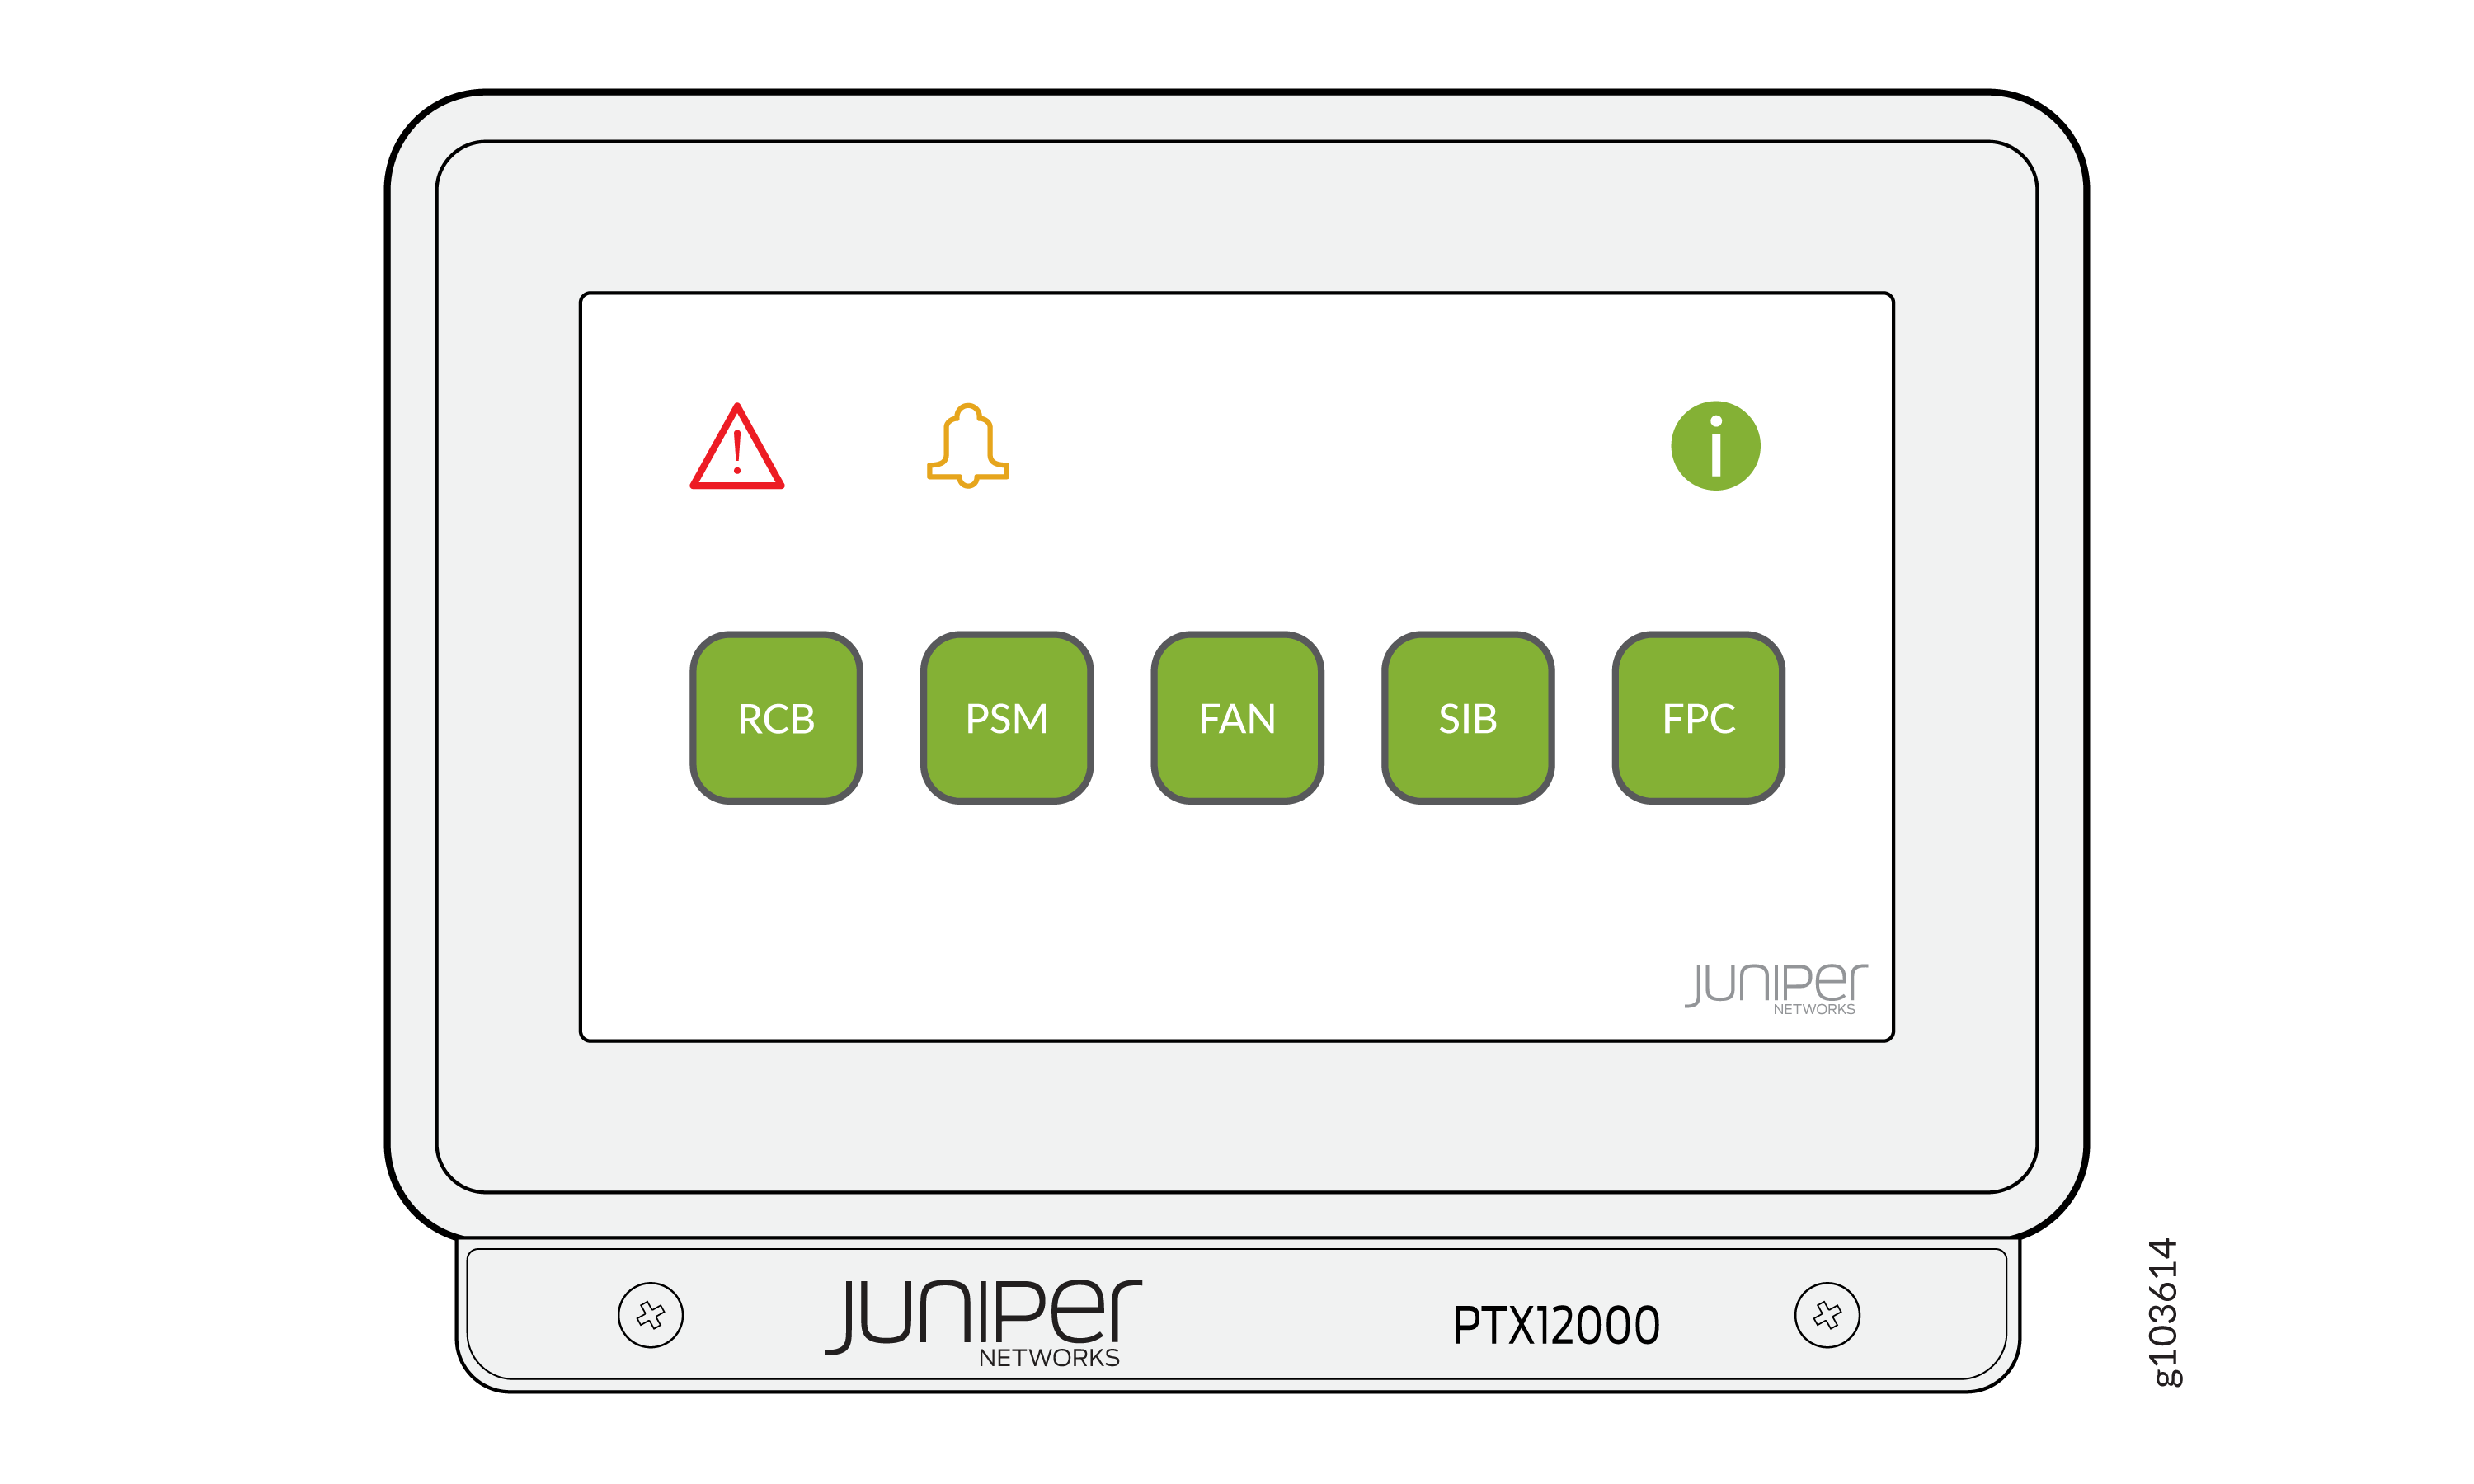
The status panel provides the status of the following components:
-
Routing and Control Boards (RCBs)
-
Power supply modules (PSMs)
-
Fan trays
-
Switch Interface Boards (SIBs)
-
Flexible PIC Concentrators (FPCs)
The status panel also provides details about the following:
-
Major alarms
-
Minor alarms
The status panel shows a screensaver after 15 minutes of inactivity. Touch the status panel to activate it.
RCB Status
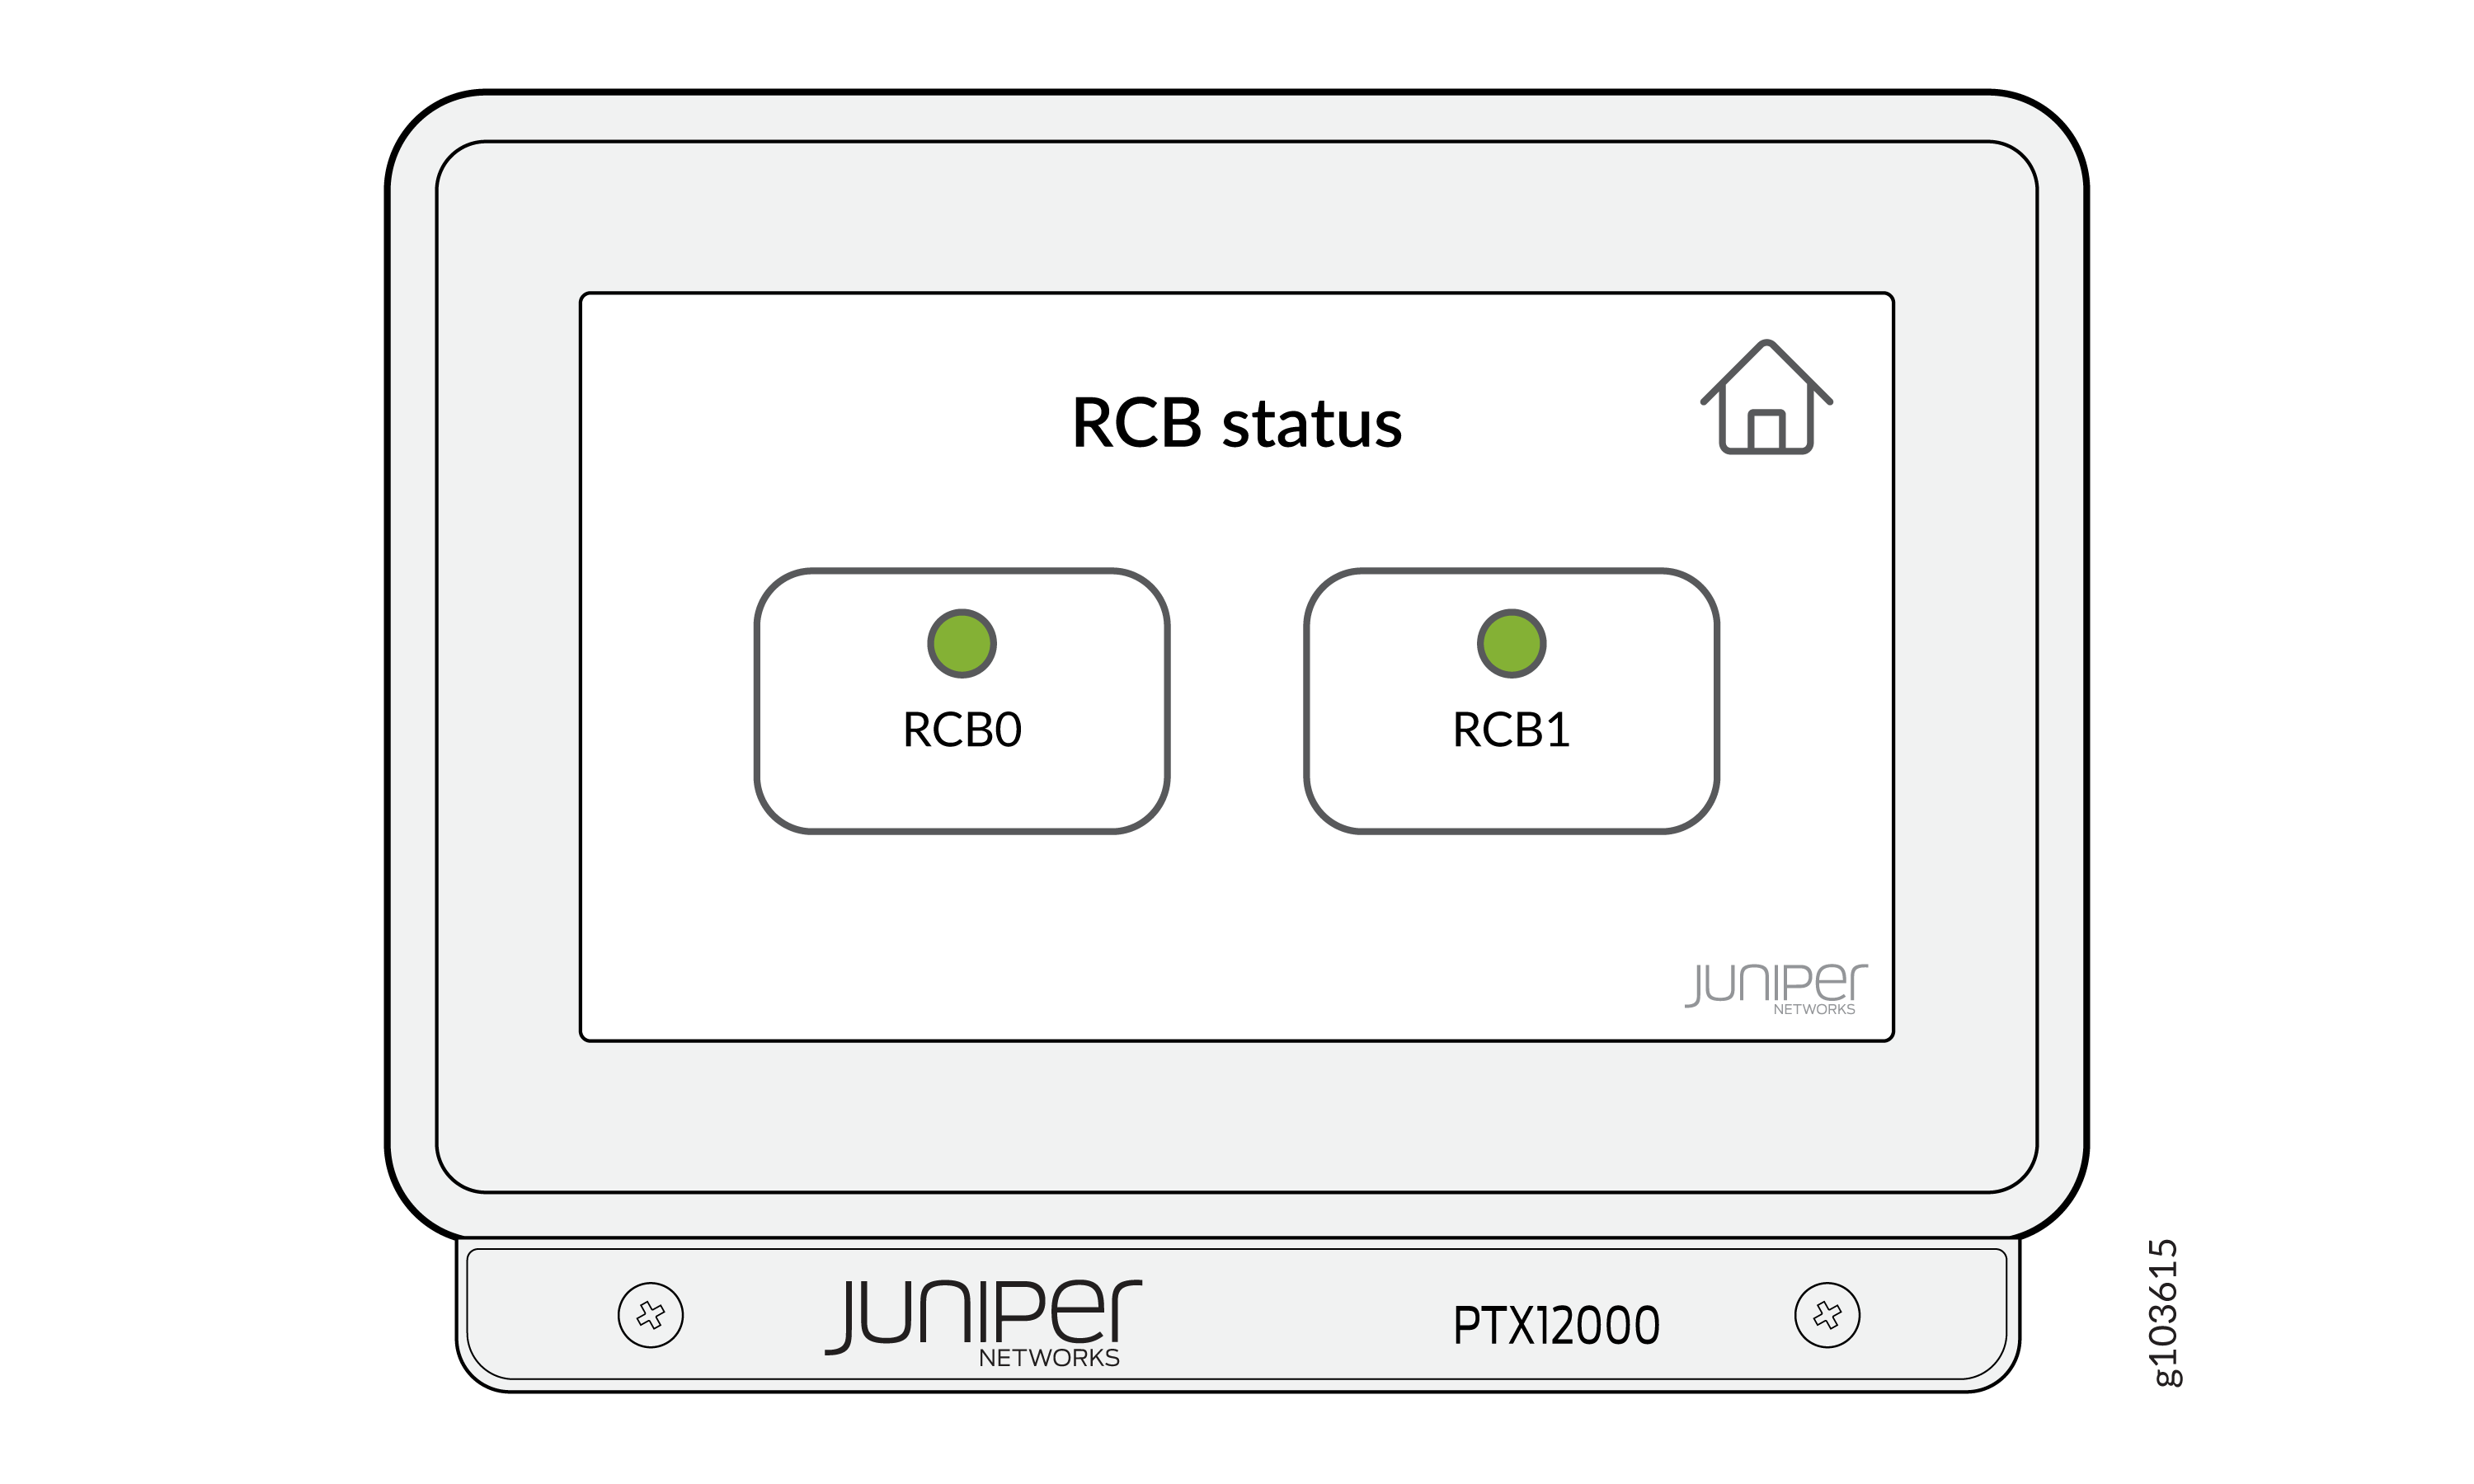
To view the status of the RCBs, click on the RCB icon in the home screen of the status panel.
|
Color |
State |
Description |
|---|---|---|
|
Green |
On steadily |
An RCB is present in the RCB slot and the RCB is online. |
|
Red |
On steadily |
An RCB is present in the RCB slot and that RCB has a failure or a fault. |
|
Light grey |
Off |
There is an RCB present in the RCB slot and the RCB is offline. |
|
Dark grey |
Off |
There is no RCB present in the RCB slot. |
PSM Status
To view the status of the PSMs, click on the PSM icon in the home screen of the status panel.
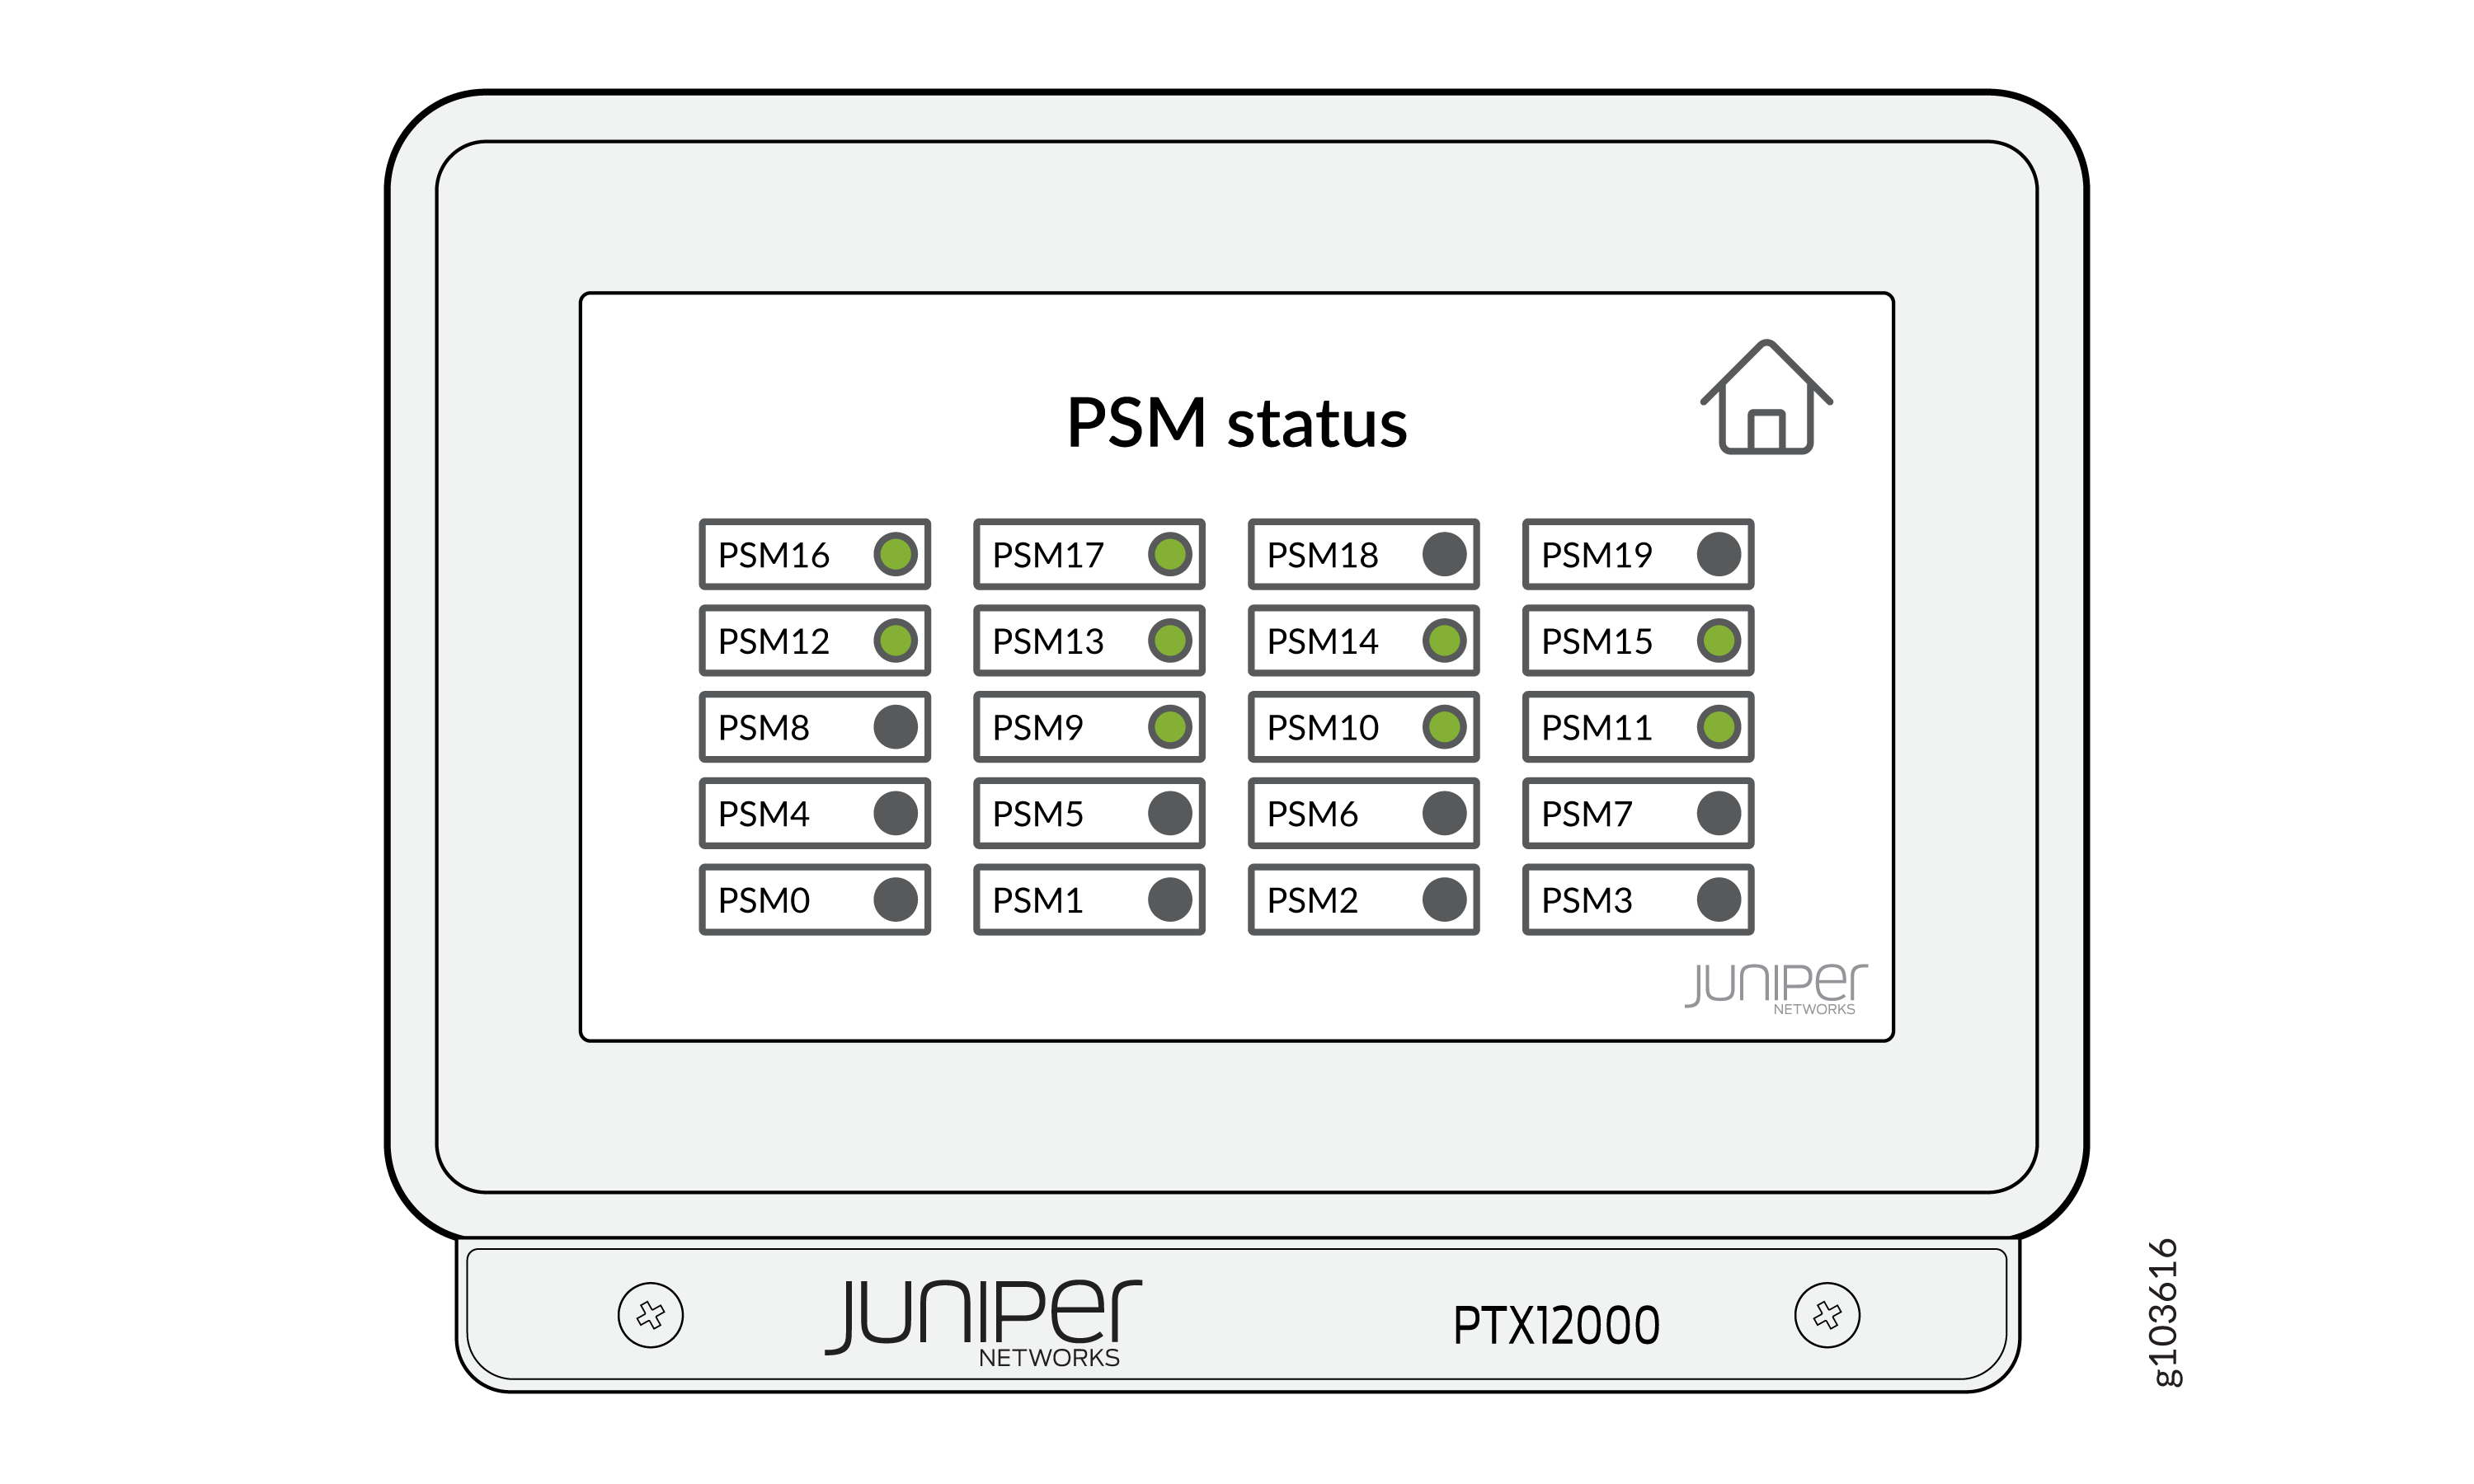
|
Color |
State |
Description |
|---|---|---|
|
Green |
On steadily |
A PSM is present in the PSM slot and all the input voltages are within range. |
|
Amber |
On steadily |
A PSM is present in the PSM slot and at least one input voltage is not in range. |
|
Amber |
Blinking |
A PSM is present in the PSM slot and at least one input is absent. |
|
Red |
On steadily |
A PSM is present in the PSM slot and that PSM has a failure or a fault. |
|
Light grey |
Off |
There is a PSM present in the PSM slot and the PSM is offline. |
|
Dark grey |
Off |
There is no PSM present in the PSM slot. |
Fan Tray Status
To view the status of the fan trays, click on the FAN icon in the home screen of the status panel.
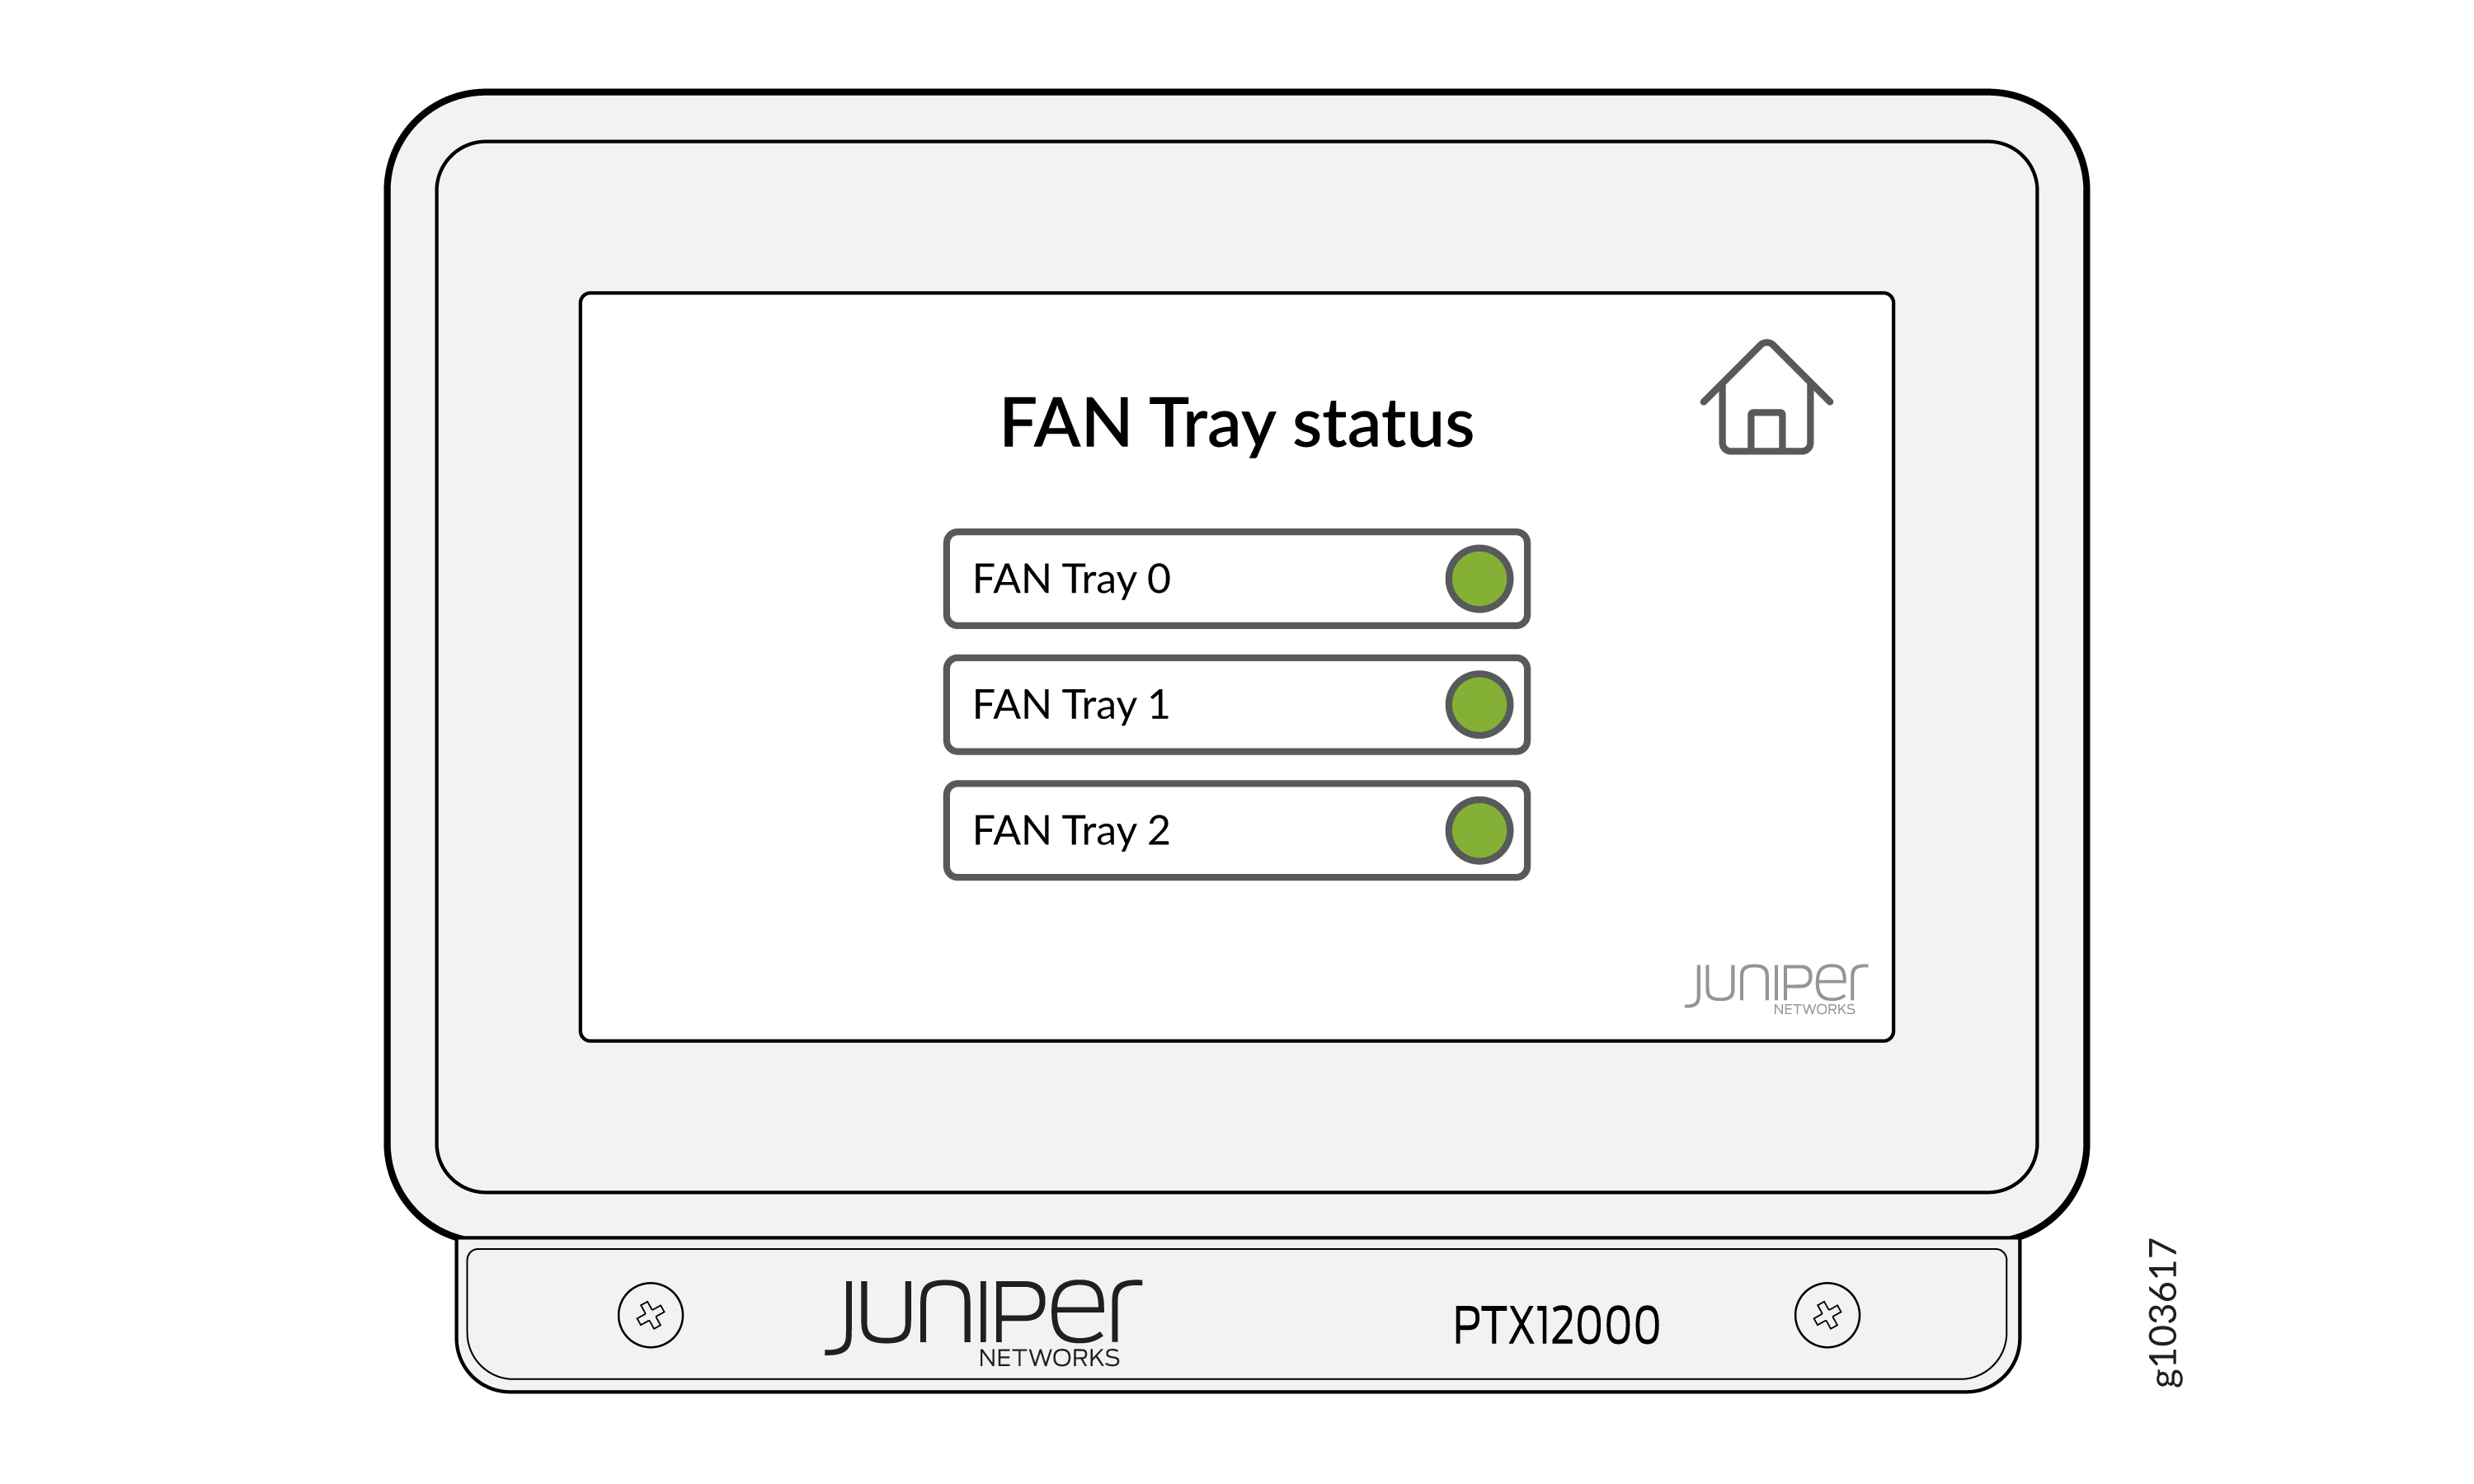
|
Color |
State |
Description |
|---|---|---|
|
Green |
On steadily |
A fan tray is present in the fan tray slot and all the fans are operating normally. |
|
Green |
Blinking |
A fan tray is present in the fan tray slot and the fans are starting up. |
|
Amber |
Blinking |
A fan tray is present in the fan tray slot and at least one fan in that fan tray has a failure or a fault. |
|
Light grey |
Off |
There is a fan tray present in the fan tray slot and the fan tray is offline. |
|
Dark grey |
Off |
There is no fan tray present in the fan tray slot. |
SIB Status
To view the status of the SIBs, click on the SIB icon in the home screen of the status panel.
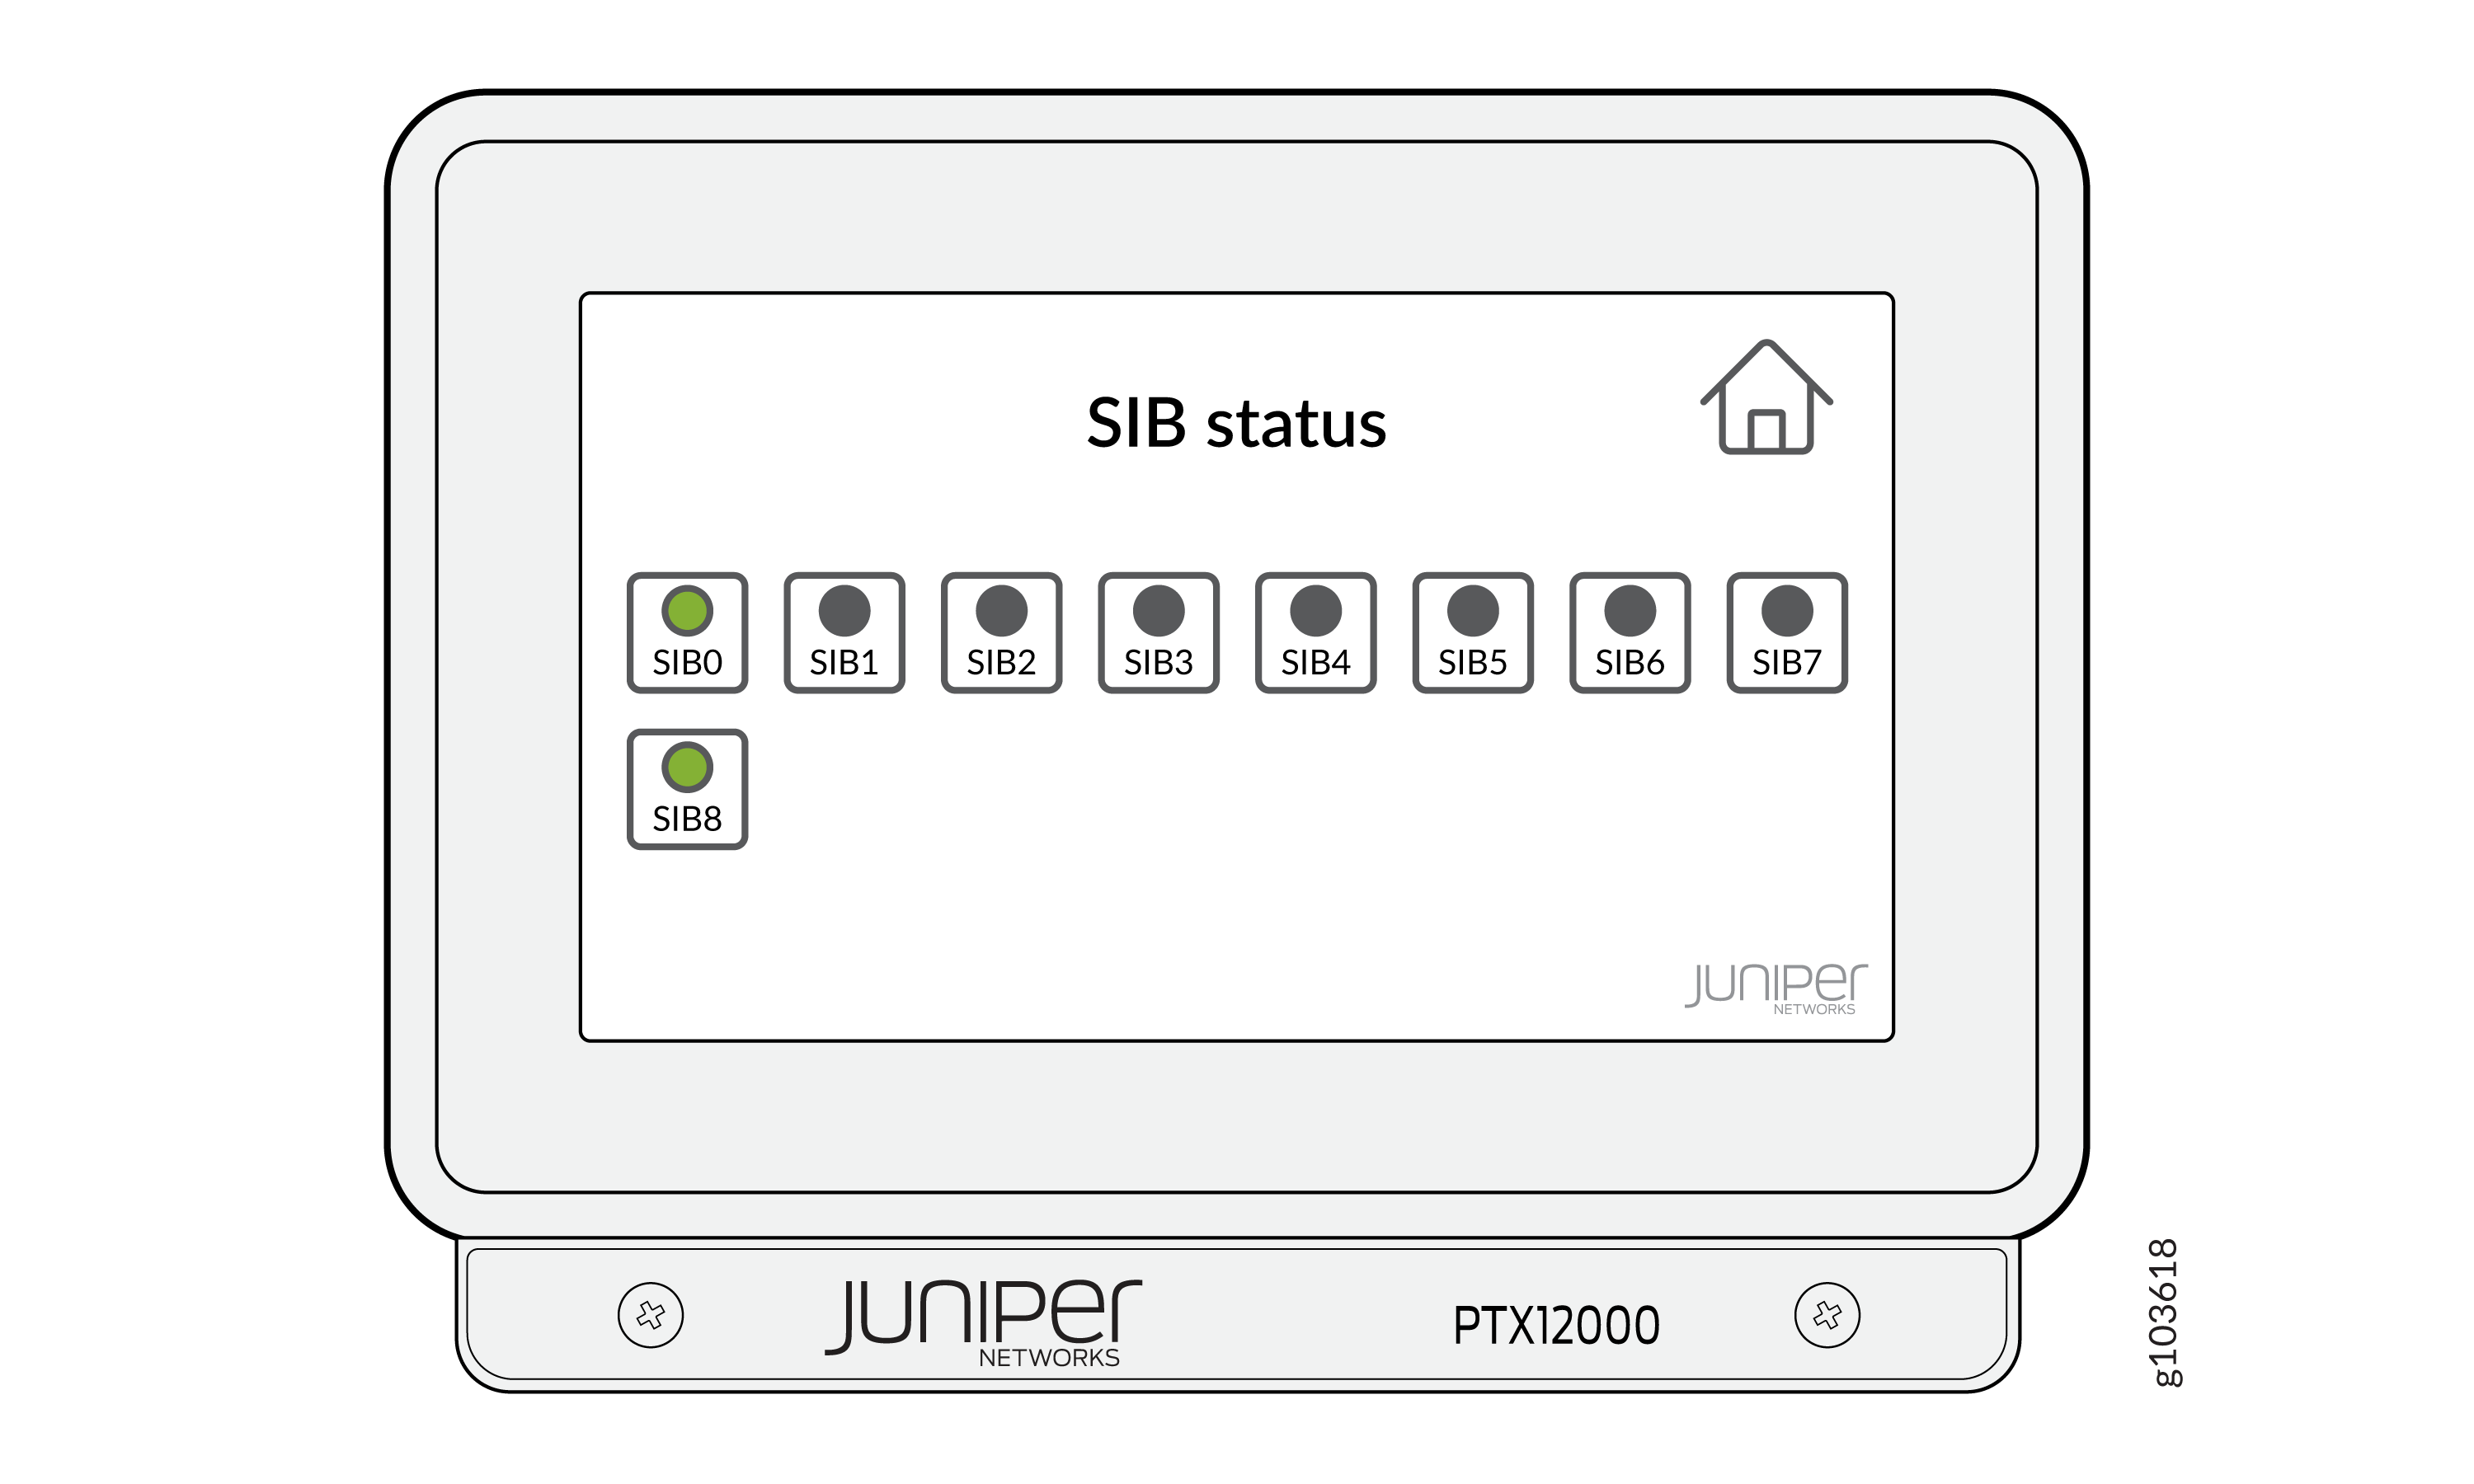
|
Color |
State |
Description |
|---|---|---|
|
Green |
On steadily |
A SIB is present in the SIB slot and the SIB is online. |
|
Green |
Blinking |
A SIB is present in the SIB slot and that SIB is powering up. |
|
Amber |
Blinking |
A SIB is present in the SIB slot and that SIB has a failure or a fault. |
|
Light grey |
Off |
There is an SIB present in the SIB slot and the SIB is offline. |
|
Dark grey |
Off |
There is no SIB present in the SIB slot. |
FPC Status
To view the status of the FPCs, click on the FPC icon in the home screen of the status panel.
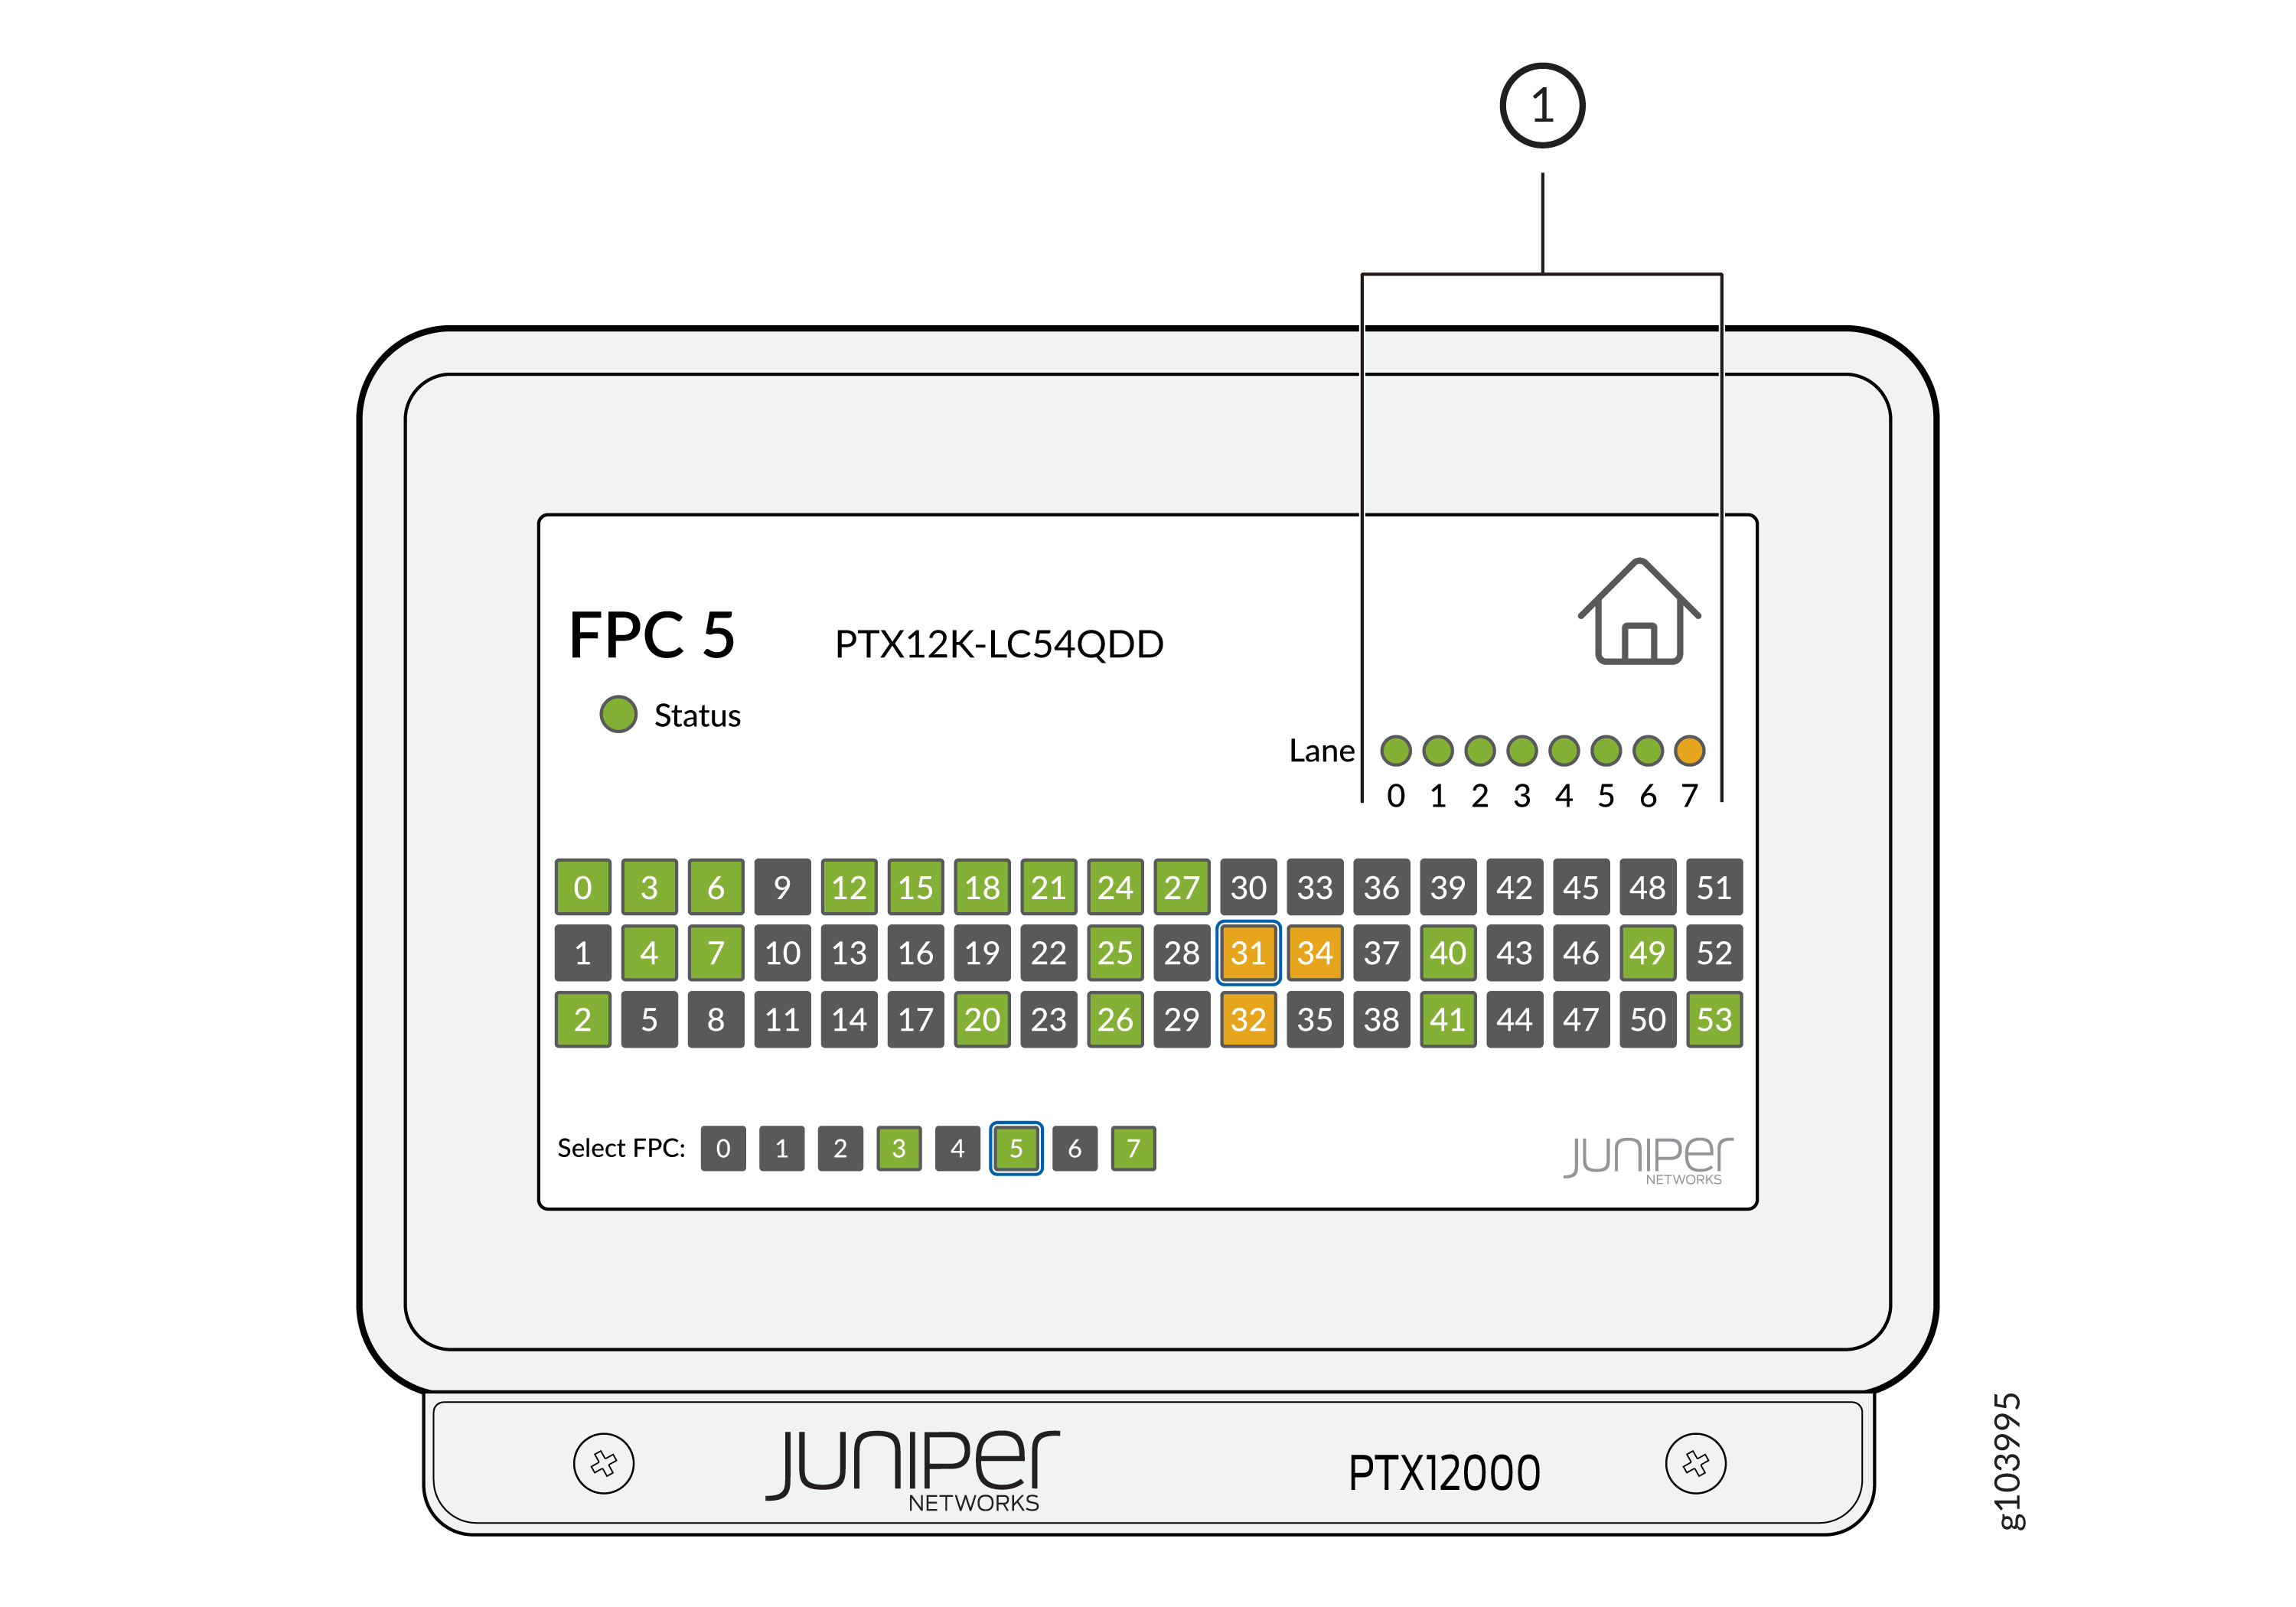
1 — Lane LEDs |
|
Color |
State |
Description |
|---|---|---|
|
Green |
On steadily |
An FPC is present in the FPC slot and the FPC is online. |
|
Green |
Blinking |
An FPC is present in the FPC slot and that FPC is initializing. |
|
Red |
On steadily |
An FPC is present in the FPC slot and that FPC has a failure or a fault. |
|
Light grey |
Off |
There is an FPC present in the FPC slot and the FPC is offline. |
|
Dark grey |
Off |
There is no FPC present in the FPC slot. |
When a port is channelized, if you click on the icon for that port, lane LEDs that indicate the state of the channels are displayed.
|
Color |
State |
Description |
|---|---|---|
|
Green |
On steadily |
The channel is active. |
|
Amber |
On steadily |
The channel is not active. |
|
Red |
On steadily |
The link is down because of a local fault or a hardware failure. |
|
Unlit |
Off |
There is no transceiver present in the port or the link is down because of loss of signal. |
Alarms and Diagnostic Information
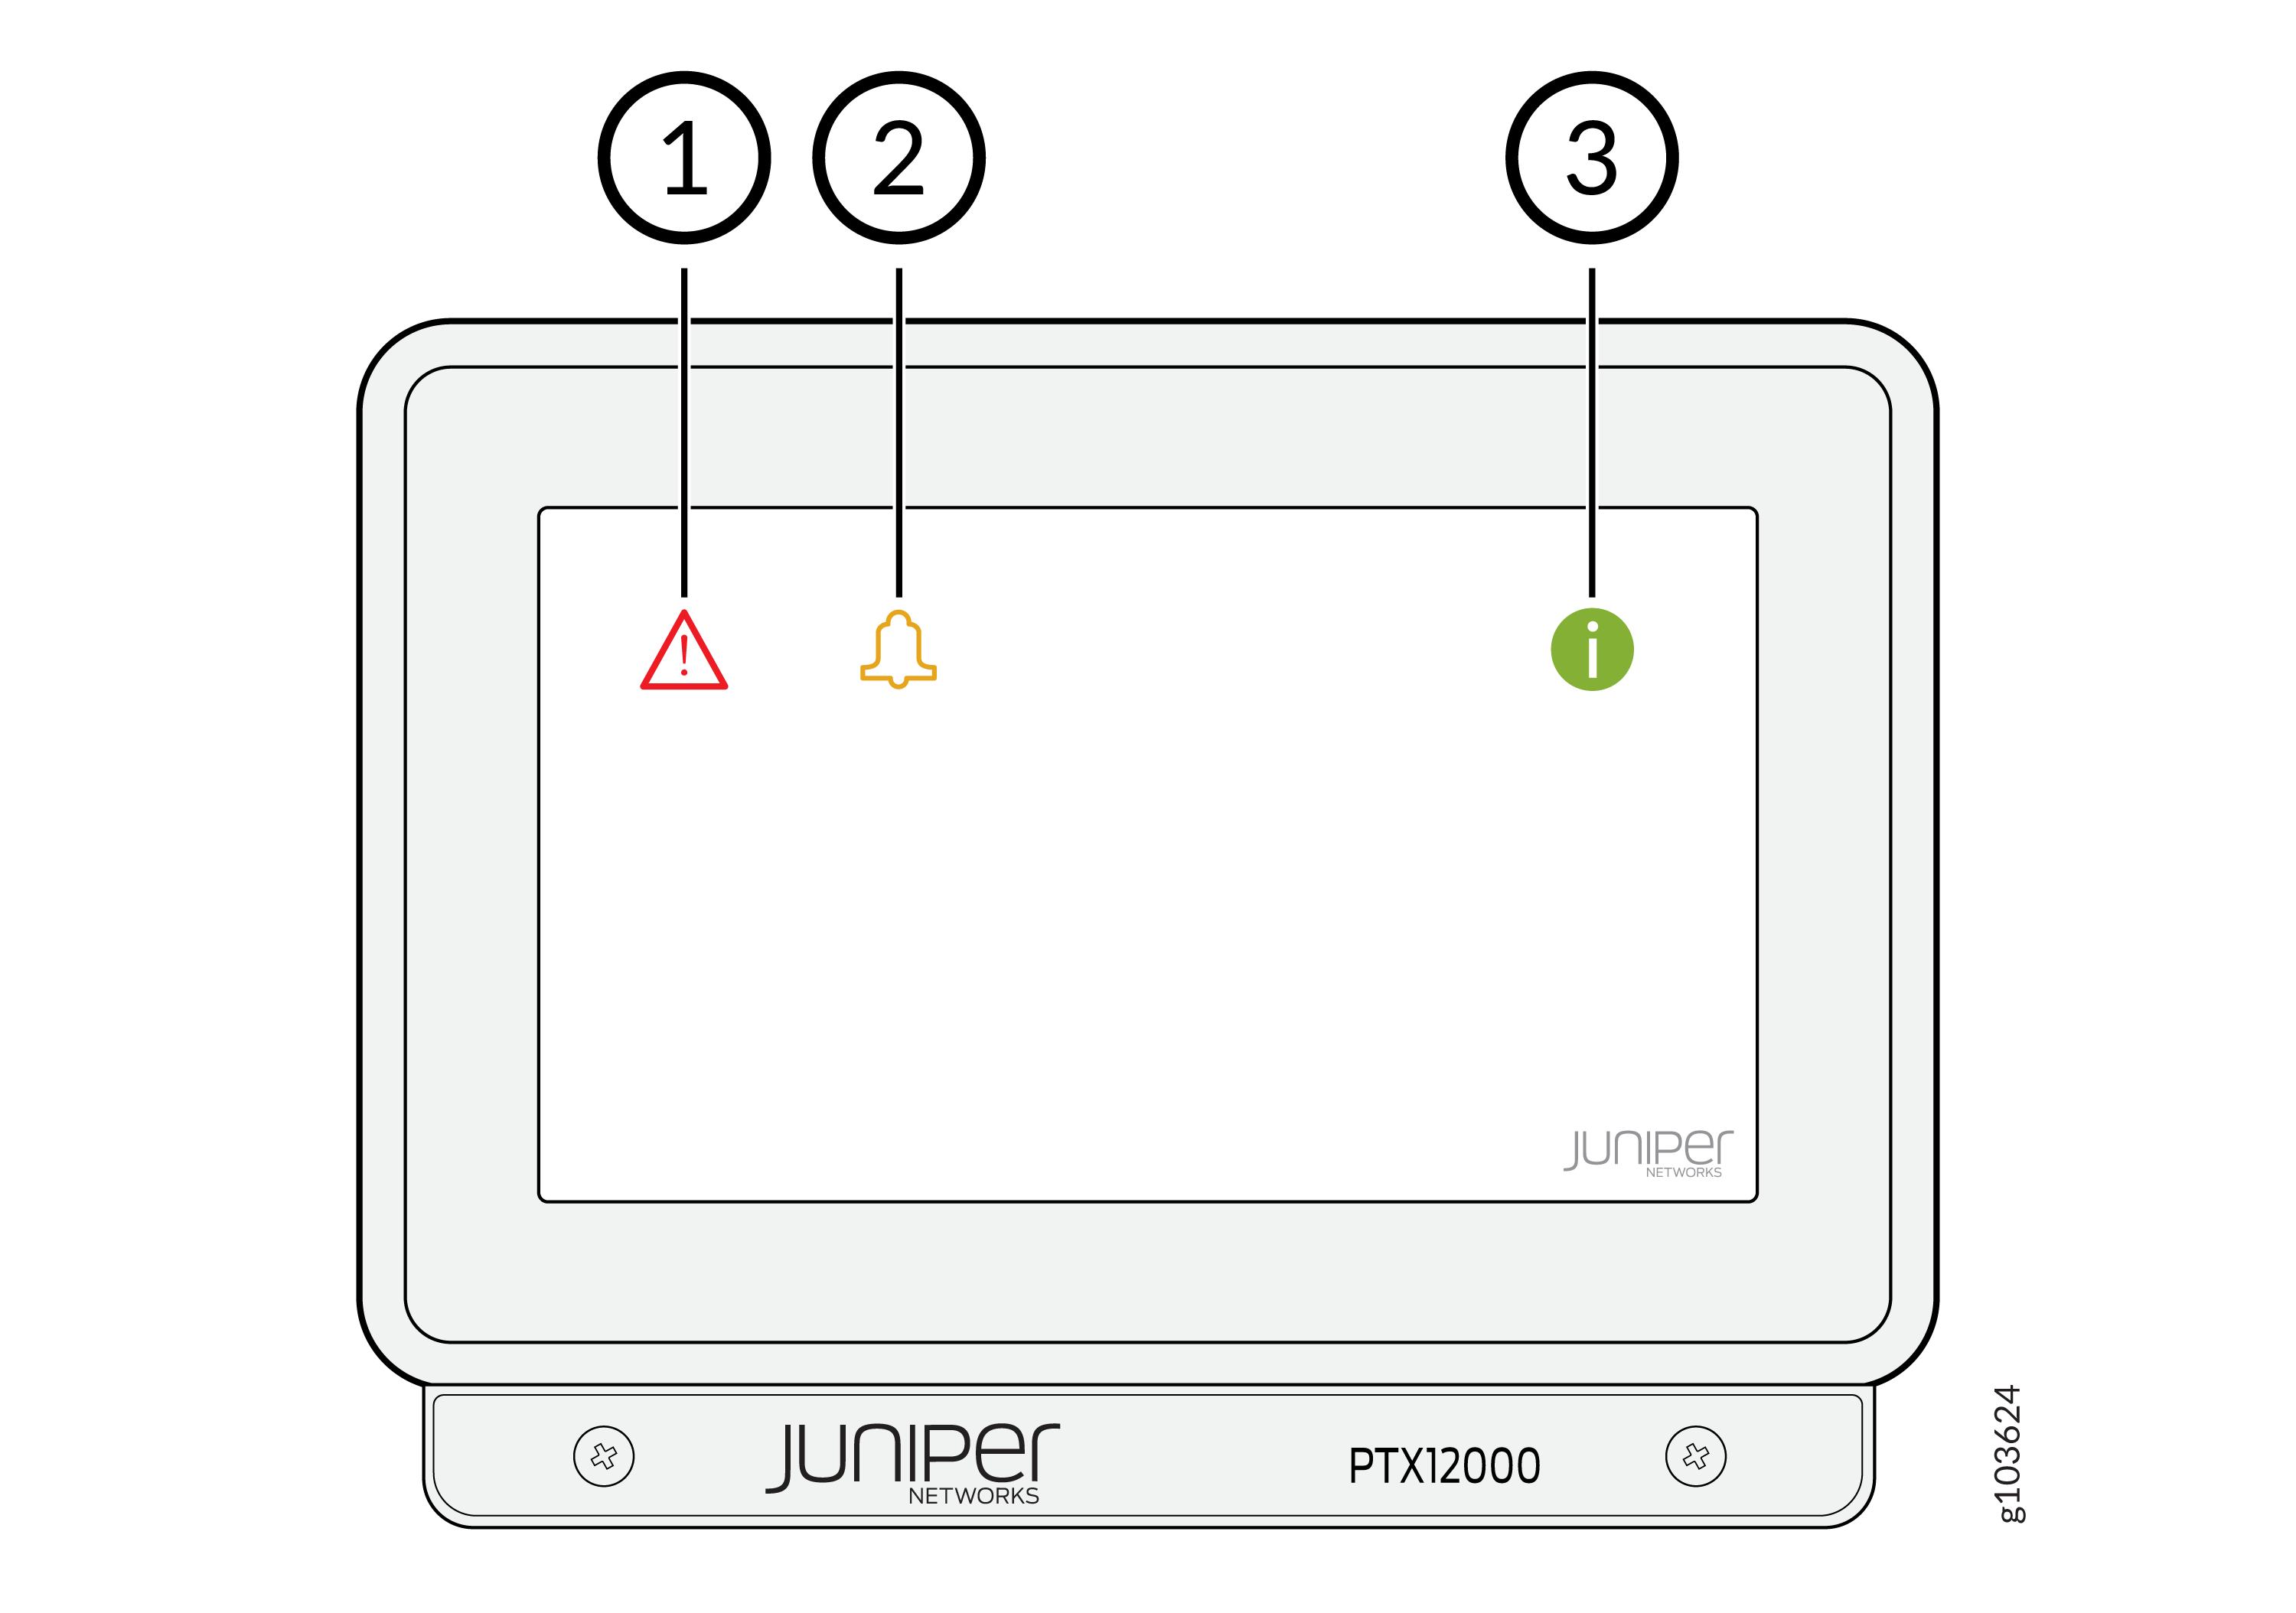
1 — Major alarm icon | 3 — Diagnostic information icon |
2 — Minor alarm icon |
If there is at least one major alarm, the major icon in the home screen of the status panel is lit in red color.
If there is at least one minor alarm, the minor alarm icon in the home screen of the status panel is lit in amber color.
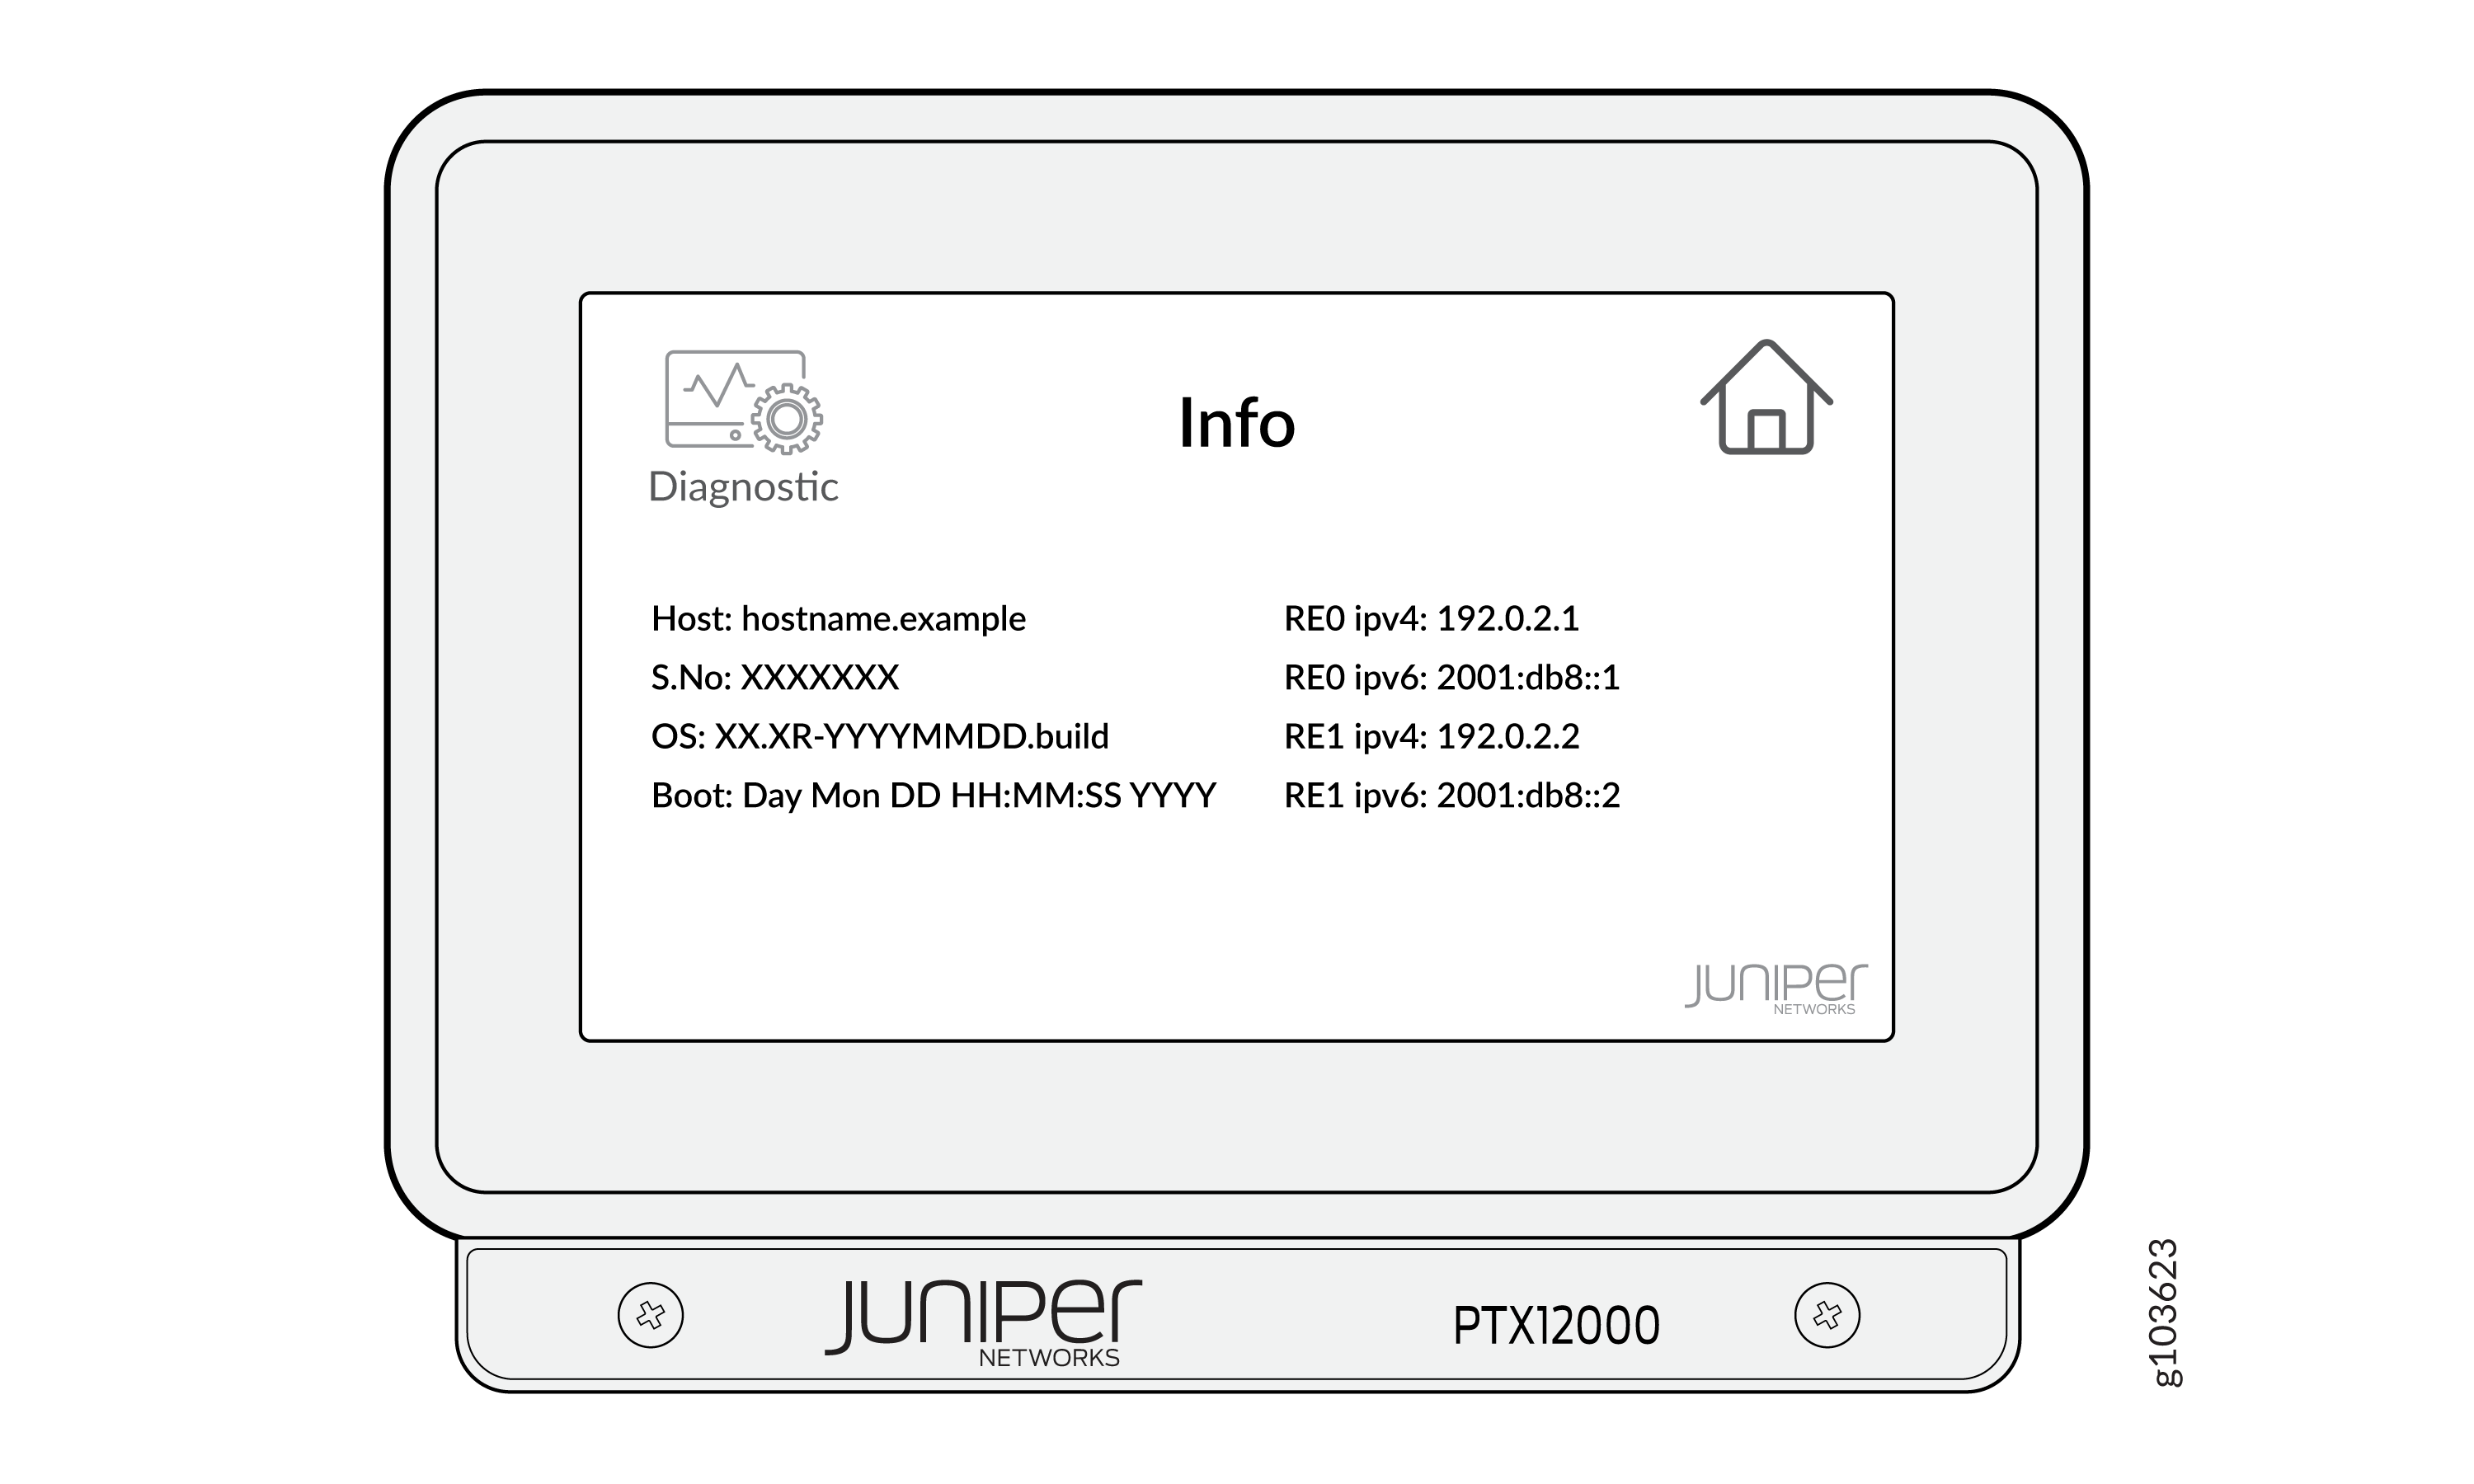
To view the diagnostic information about the status panel, click on the diagnostic information icon icon on the status panel.