Marvis 쿼리 언어를 사용하여 문제 해결
다음 예시를 사용하여 Marvis 쿼리를 사용하여 네트워크를 모니터링하고 문제를 해결하는 방법을 알아보십시오.
이벤트 및 디바이스 세부 정보 보기
문제를 해결하고 네트워크 동작을 이해하려면 이벤트 세부 정보 또는 디바이스 세부 정보를 확인해야 할 수 있습니다. LIST 쿼리를 사용하여 다음에 대한 세부 정보를 볼 수 있습니다.
-
액세스 포인트(AP)
-
클라이언트(유선 클라이언트 포함)
-
스위치
-
AP 이벤트
-
클라이언트 이벤트
-
스위치 이벤트
-
Mist Edge
-
Mist Edge 이벤트
표 1 및 표 2 에는 요구 사항에 따라 쿼리를 빌드하기 위한 참조로 사용할 수 있는 몇 가지 LIST 쿼리가 나와 있습니다.
| 보시려면 | 사용 |
|---|---|
| 특정 시간 간격 동안 AP에 대한 클라이언트 이벤트 | LIST ClientEvents WITH AccessPoint <AP name> DURING <time duration> |
| AP에 대한 모든 이벤트 | LIST ApEvents WITH AccessPoint <AP name> |
| AP에 대한 특정 유형의 이벤트 | LIST ApEvents WITH ApEventType <event-type> AND AccessPoint <ap-name> |
| 스위치에 대한 모든 이벤트 | LIST SwitchEvents WITH Switch <switch name> |
| 스위치에 대한 특정 유형의 이벤트 | LIST SwitchEvents WITH SwitchEventType <event-type> AND Switch <switch-name> |
| 특정 사이트에서 Mist Edge에 대한 모든 이벤트 | LIST MistEdgeEvents WITH Site <site-name> |
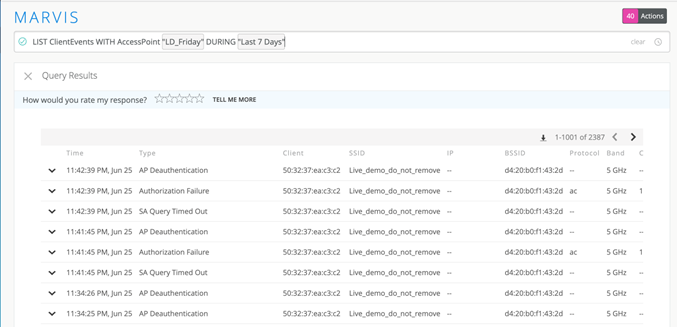
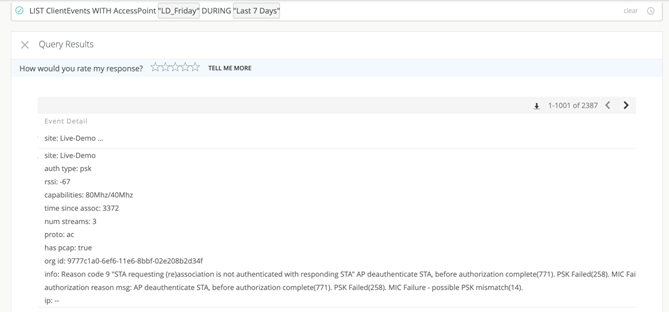
다음 예는 특정 AP와 관련된 모든 클라이언트에 대한 이벤트를 보여줍니다. 이벤트에 대한 자세한 내용을 보려면 표의 첫 번째 열에서 화살표를 클릭합니다.
이 예는 특정 이벤트 유형에 대한 목록을 보여줍니다.
| 보시려면 | 사용 |
|---|---|
| 사이트에서 특정 모델의 스위치 | LIST Switches WITH Model <model number> AND Site <site name> |
| AP에 연결된 클라이언트 | LIST Clients WITH AccessPoint <AP name> |
| 사이트에서 특정 모델의 AP | LIST APs WITH Model <model number> AND Site <site name> |
| 사이트의 모든 유선 클라이언트 | LIST WiredClients WITH Site <site name> |
|
사이트의 Mist Edge |
LIST MistEdges WITH Site <site name> |
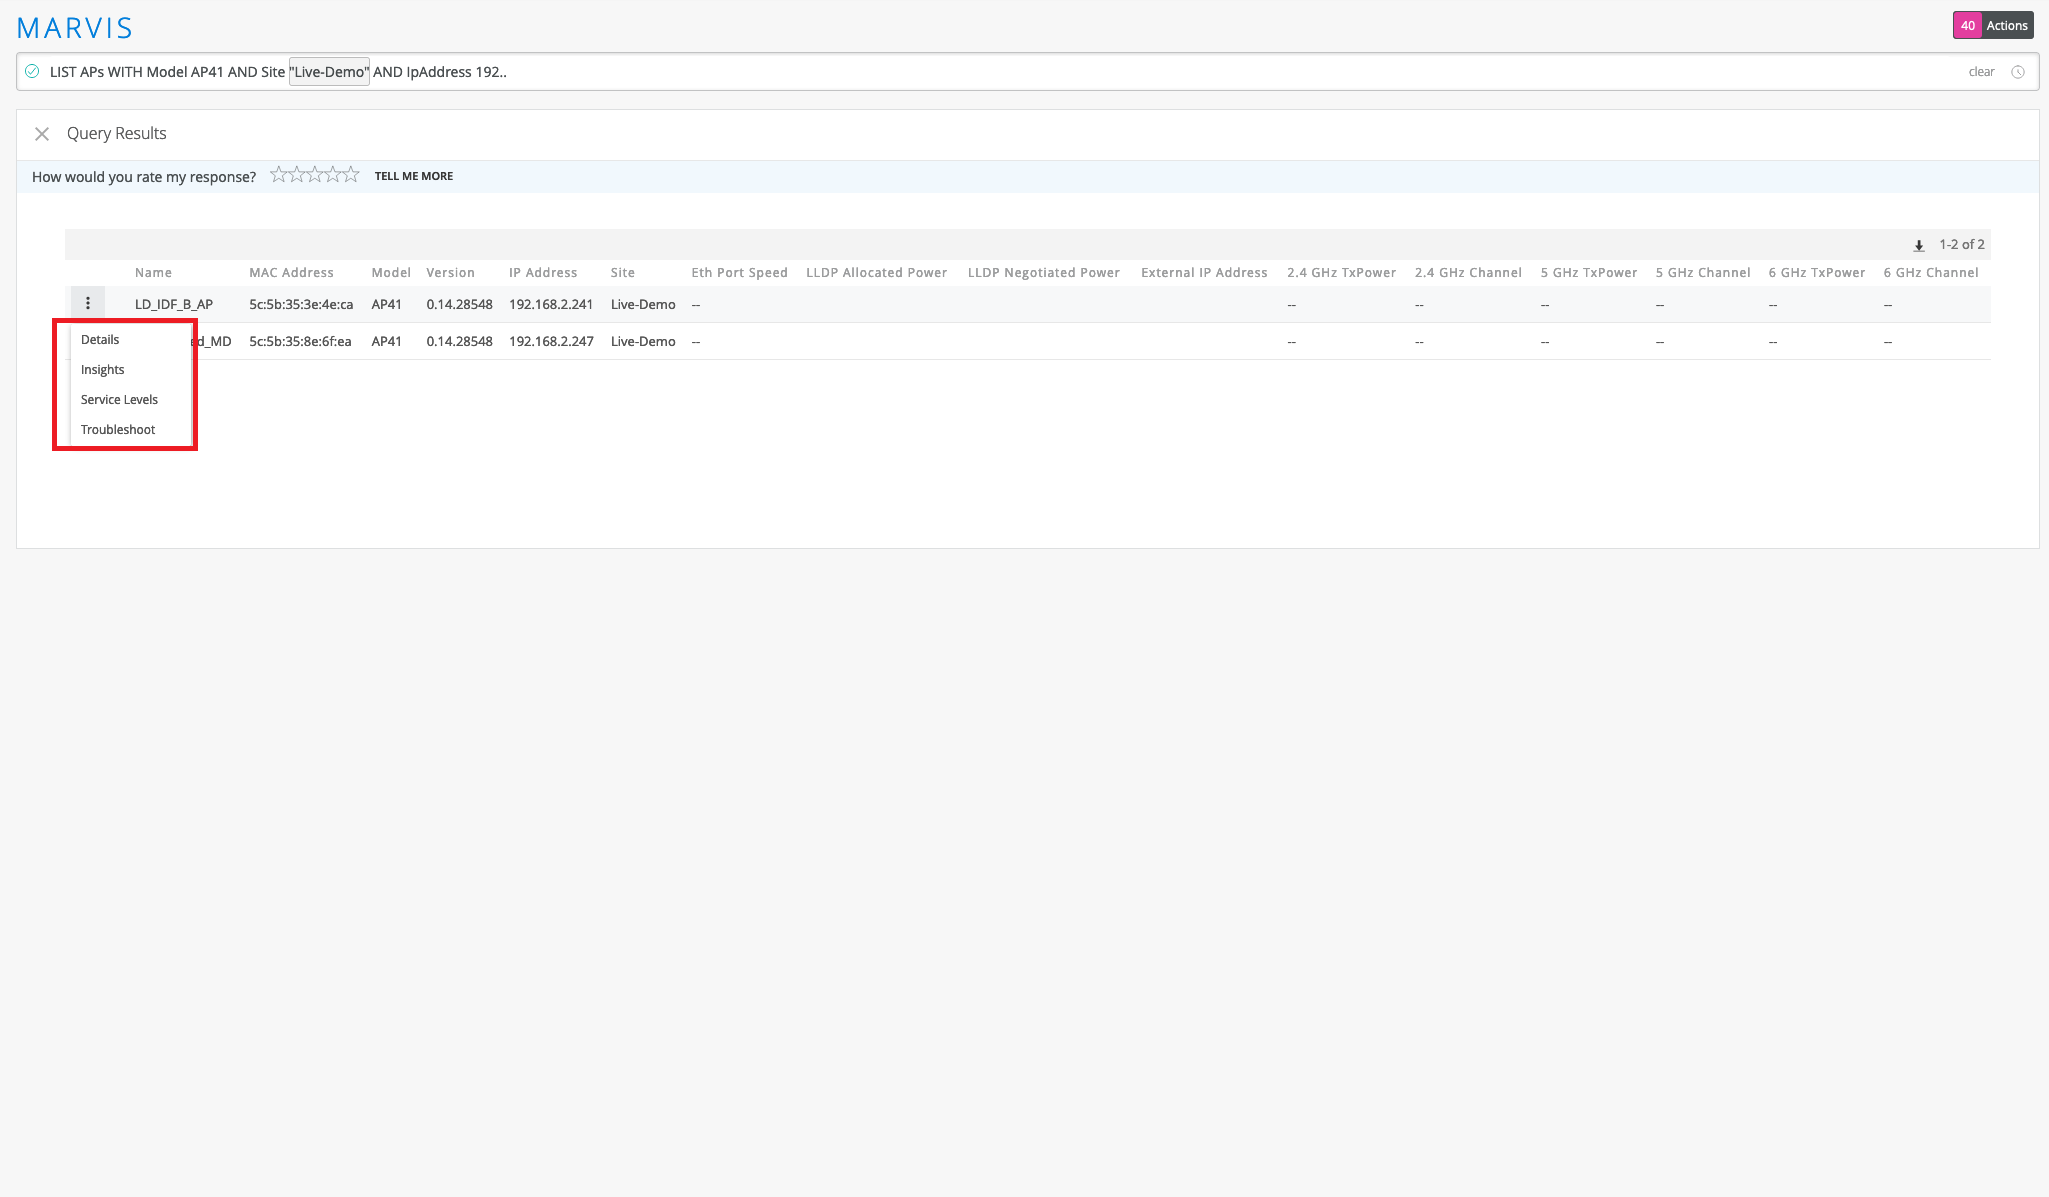
다음 예제는 LIST 쿼리의 출력을 보여줍니다. 부분 IP 주소를 입력하여 특정 서브넷에서 디바이스를 검색할 수 있습니다. 추가 작업을 위해 표의 왼쪽 상단 모서리에 있는 추가 옵션 아이콘을 클릭할 수 있습니다.
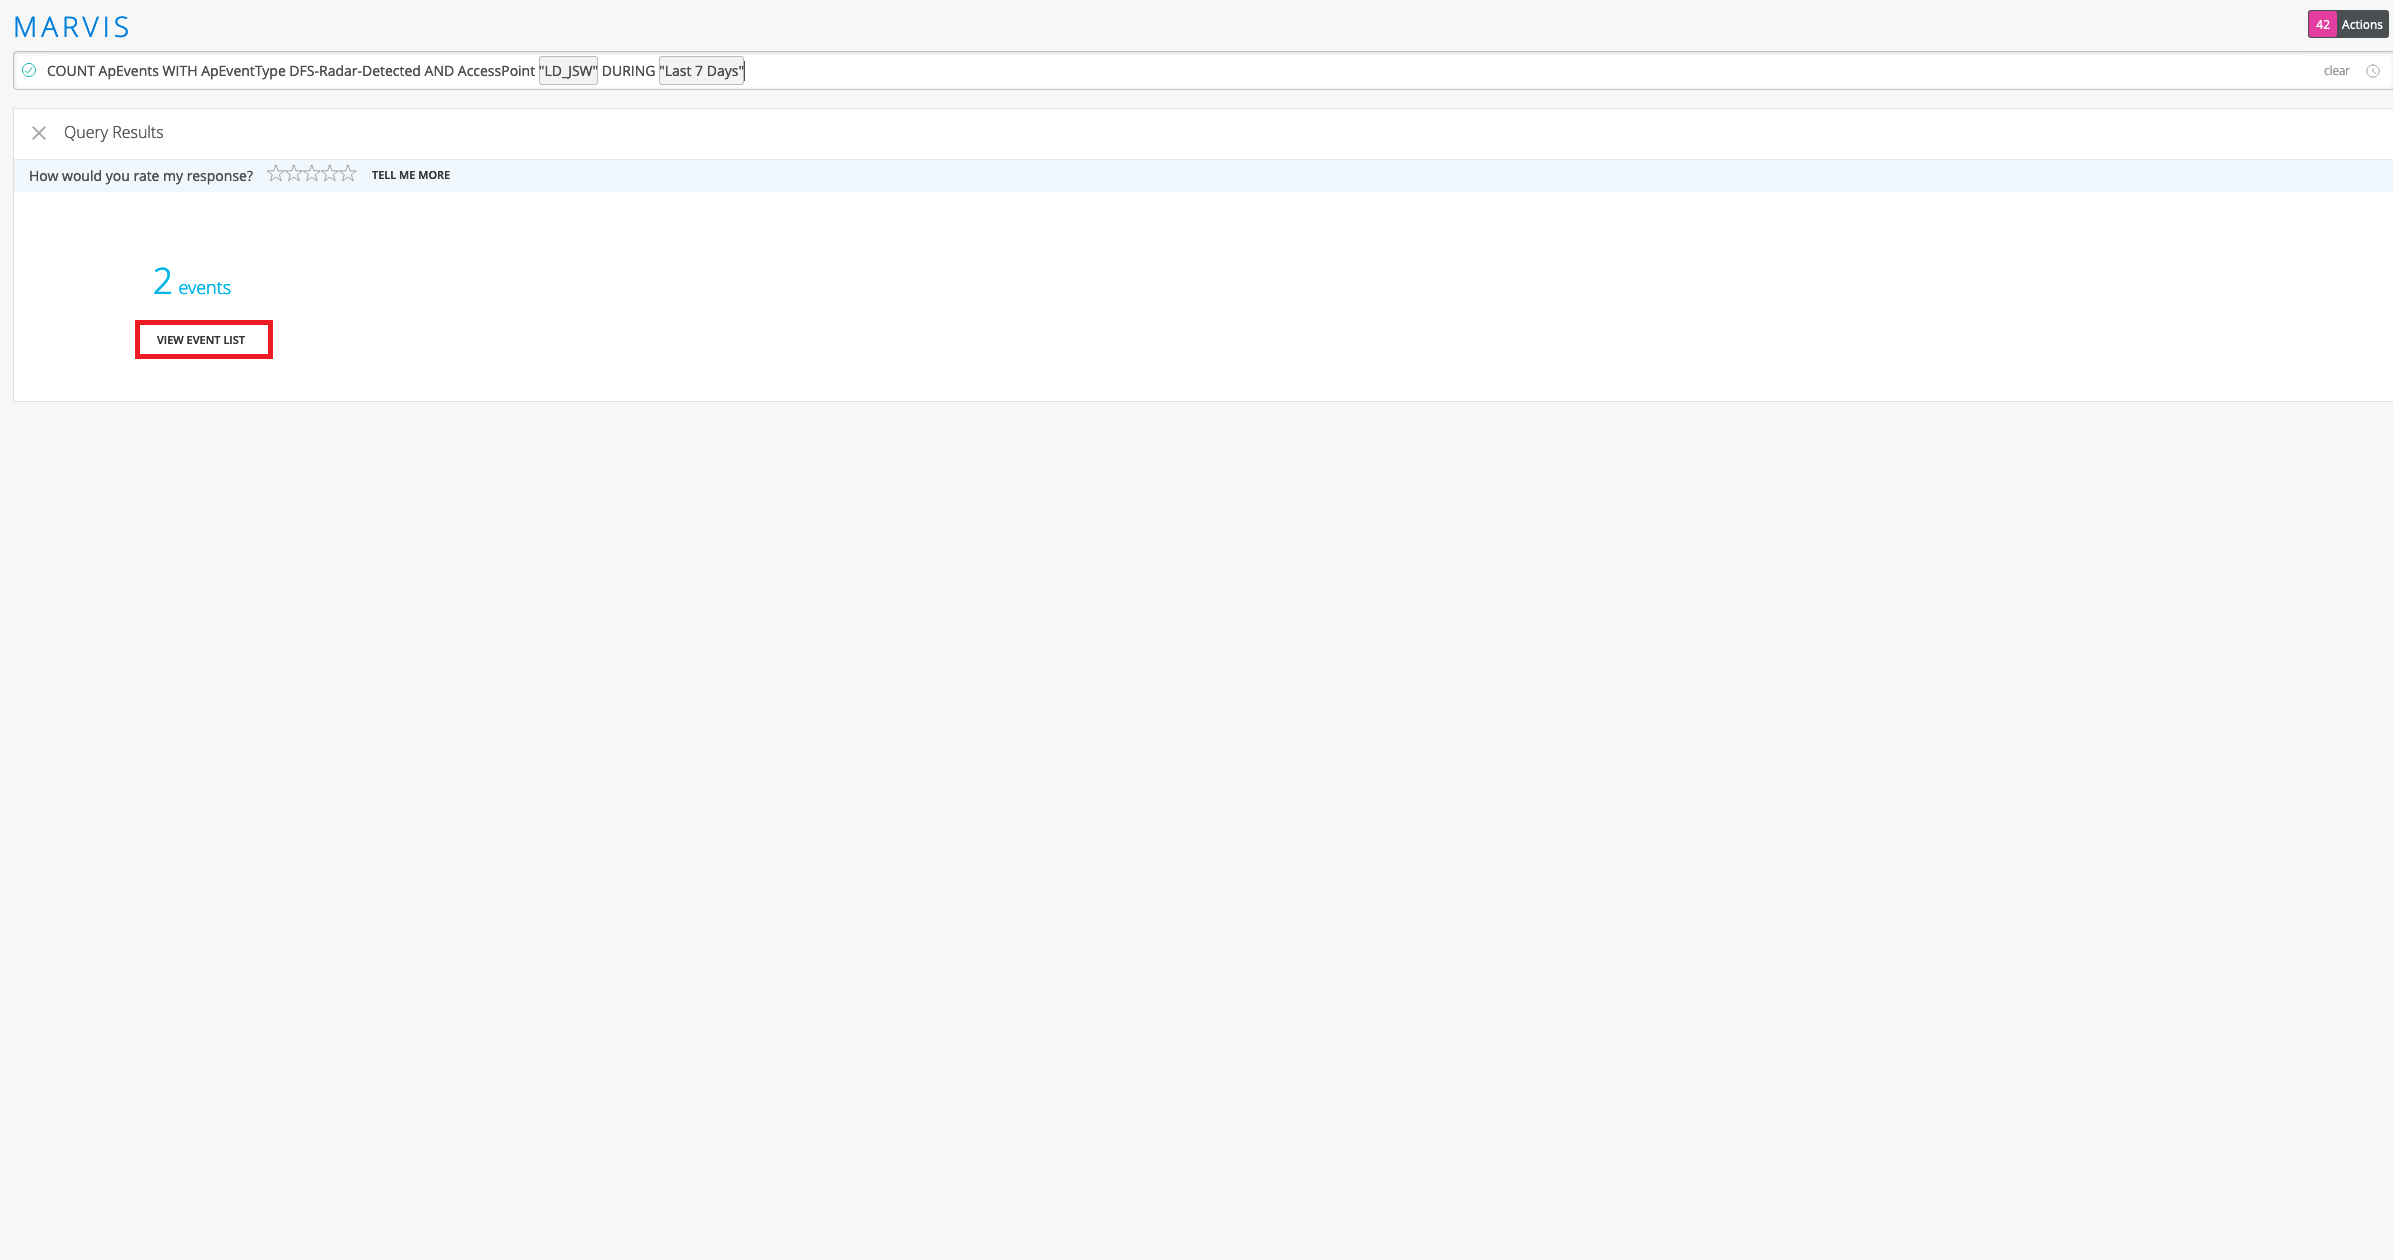
LIST 쿼리 외에도 COUNT 쿼리를 사용하여 쿼리와 일치하는 이벤트 또는 디바이스의 수를 가져올 수 있습니다. COUNT 쿼리는 LIST 쿼리와 동일한 구조를 사용합니다. 다음은 COUNT 쿼리에 대한 샘플 출력을 보여주는 스크린샷입니다. 이벤트 목록 보기를 클릭하여 이벤트 세부 정보를 볼 수 있습니다.
클라이언트의 로밍 세부 정보 보기
ROAMINGOF 쿼리를 사용하여 서로 다른 AP 간 로밍하는 클라이언트의 그래픽 보기를 볼 수 있습니다.
ROAMINGOF <client name> DURING <time interval>
클라이언트 상태 보기
STATUSOF 쿼리는 사이트 또는 무선 LAN(WLAN)에서 연결 문제에 직면한 클라이언트의 개요를 제공합니다. 쿼리 출력에는 가장 많은 수의 문제가 발생한 클라이언트부터 시작하여 클라이언트의 순위가 매겨진 목록이 표시됩니다. 이 쿼리를 사용하면 사이트에서 연결 문제가 있는 클라이언트를 빠르게 식별할 수 있습니다. 문제 해결 세션을 시작할 때 이 쿼리를 사용하여 영향을 받는 클라이언트를 식별할 수 있습니다. 그런 다음 클라이언트 세부 정보를 드릴다운하여 문제의 근본 원인을 찾을 수 있습니다. 클라이언트를 클릭하여 서비스 수준이나 인사이트를 확인하거나 Marvis에서 문제 해결 쿼리를 시작할 수 있습니다.
STATUSOF Clients WITH Site <site name>
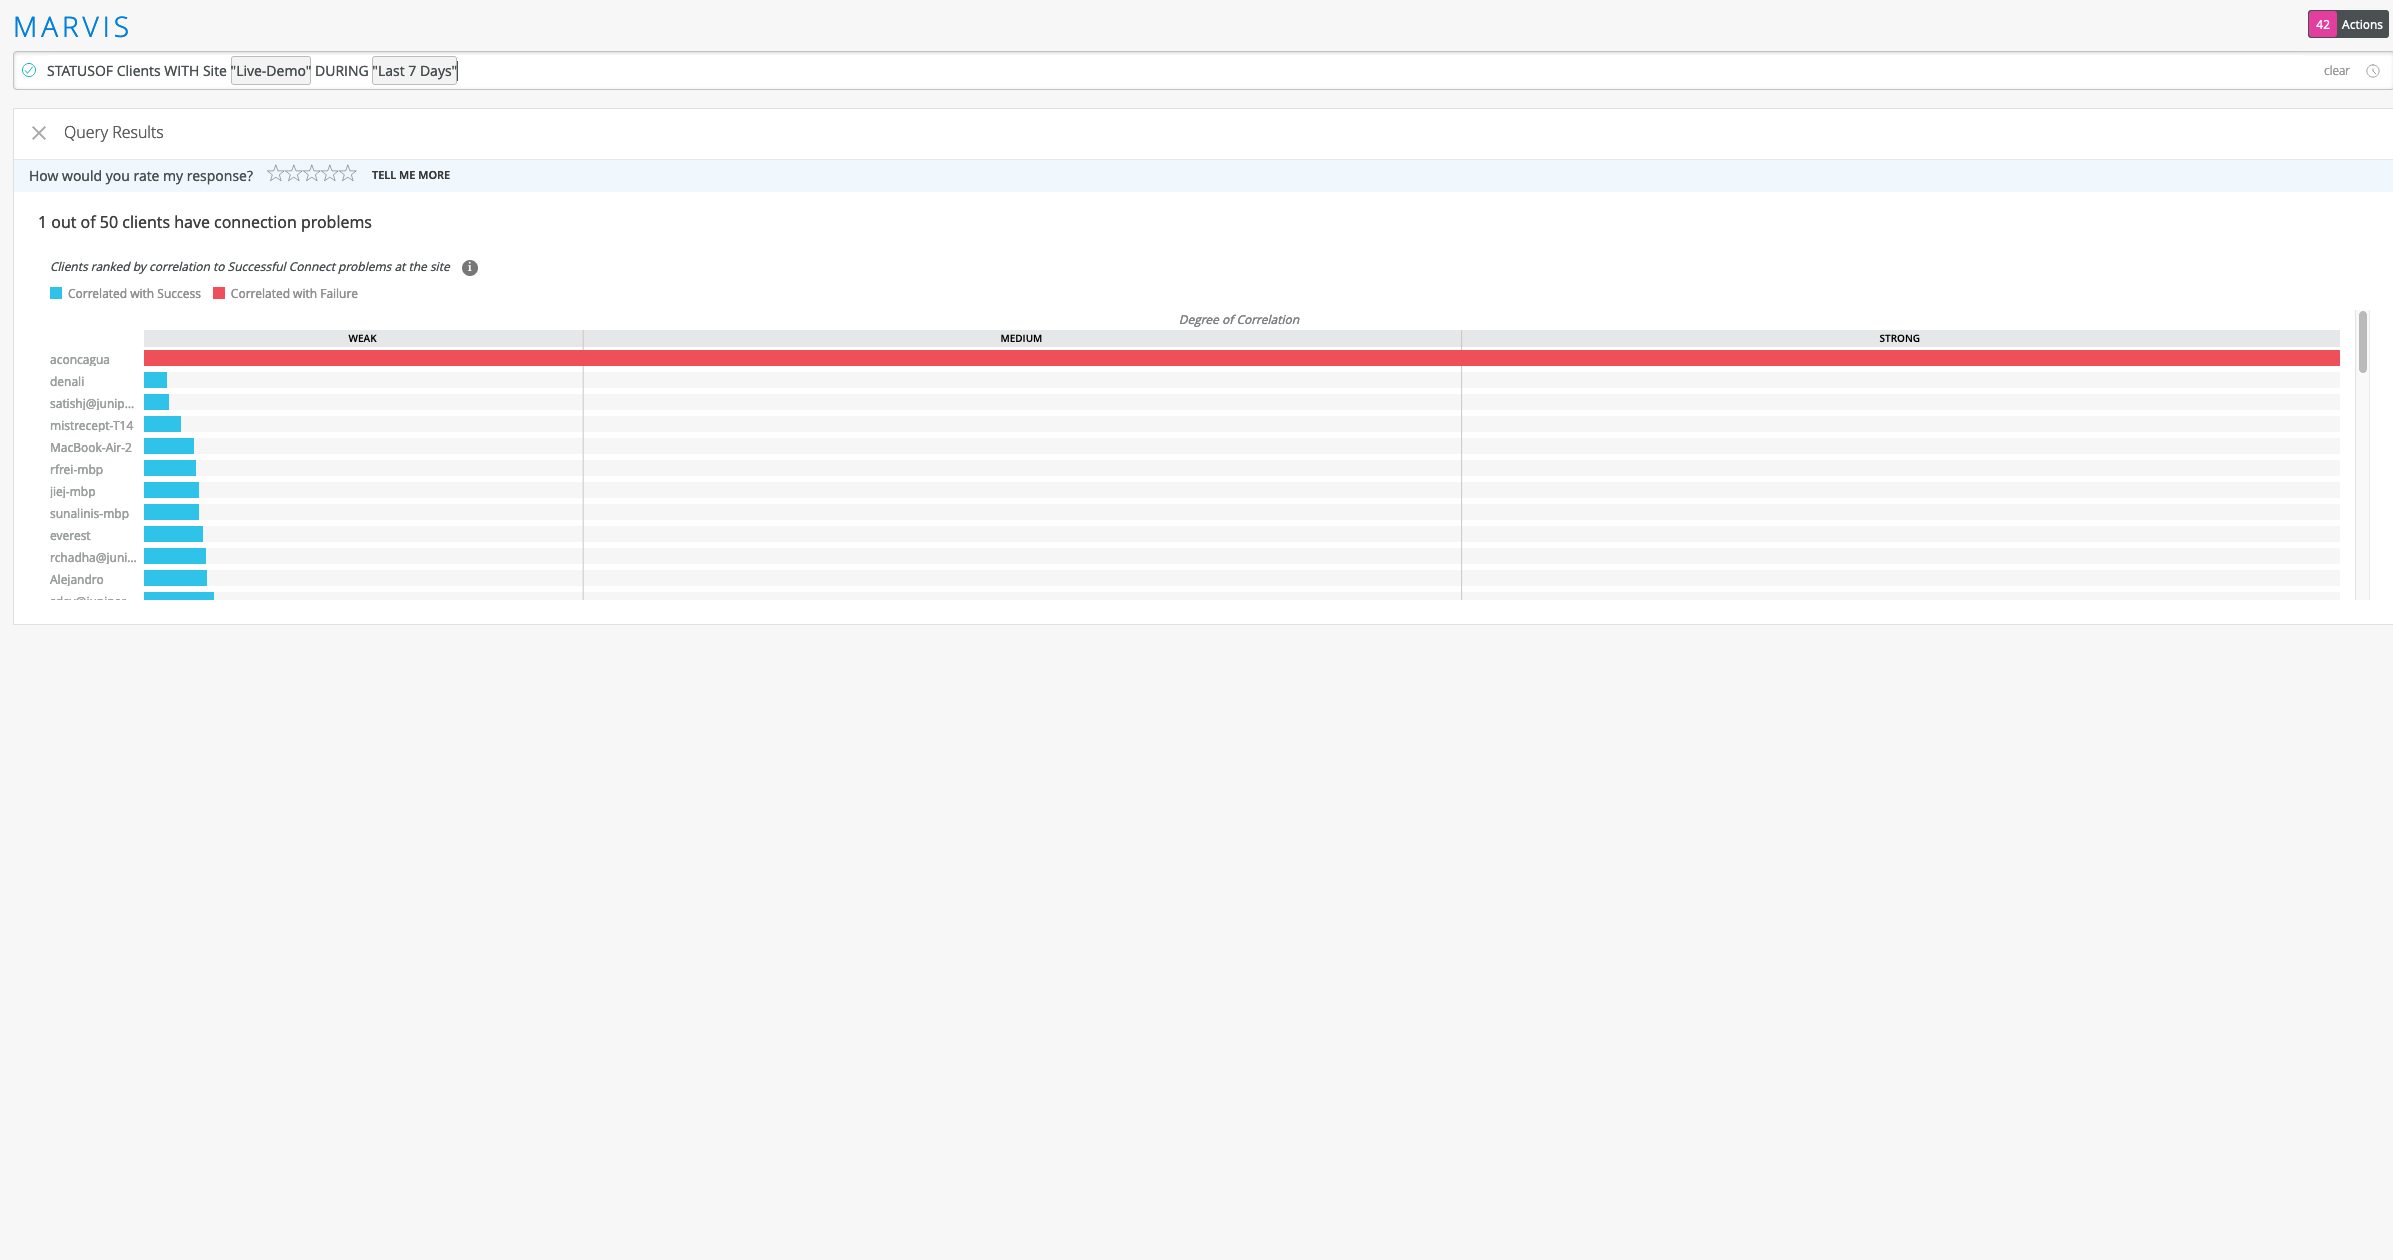
또한 커버리지 문제, 처리량 문제, 연결 문제 등과 같은 특정 문제에 직면한 클라이언트도 볼 수 있습니다. 예를 들어 쿼리 STATUSOF Clients WITH Problem Capacity 에는 조직에서 용량 문제가 발생하는 모든 클라이언트가 나열됩니다.
AP, 사이트 또는 클라이언트 문제 해결
표 3 에는 사이트, 클라이언트 또는 AP의 문제를 해결하는 데 사용할 수 있는 몇 가지 TROUBLEHOOT 쿼리가 나와 있습니다.
| 문제를 해결하려면 | 사용 |
|---|---|
| 클라이언트, AP 또는 사이트 | TROUBLESHOOT <client/site/AP name> |
| 연결 문제가 있는 무선 클라이언트, AP 또는 사이트 | TROUBLESHOOT <client/site/AP name> WITH Problem SlowToConnect
TROUBLESHOOT <client/site/AP name> WITH Problem UnableToConnect |
| 특정 기간 동안 연결 문제에 직면한 무선 클라이언트, AP 또는 사이트 | TROUBLESHOOT <client/site/AP name> WITH Problem UnableToConnect DURING <time duration> |
다음 스크린샷은 쿼리의 출력을 보여줍니다. TROUBLESHOOT <site name> WITH Problem UnableToConnect Marvis가 문제의 원인, 대역, 문제가 발생한 WLAN과 같은 데이터를 제공하는 것을 볼 수 있습니다.

각 범주를 클릭하여 더 자세한 내용으로 드릴다운할 수 있습니다. 서비스 수준 범주를 클릭하면 Marvis가 다음 스크린샷과 같이 문제에 대한 자세한 정보를 제공합니다.
AP, 사이트 또는 클라이언트 찾기
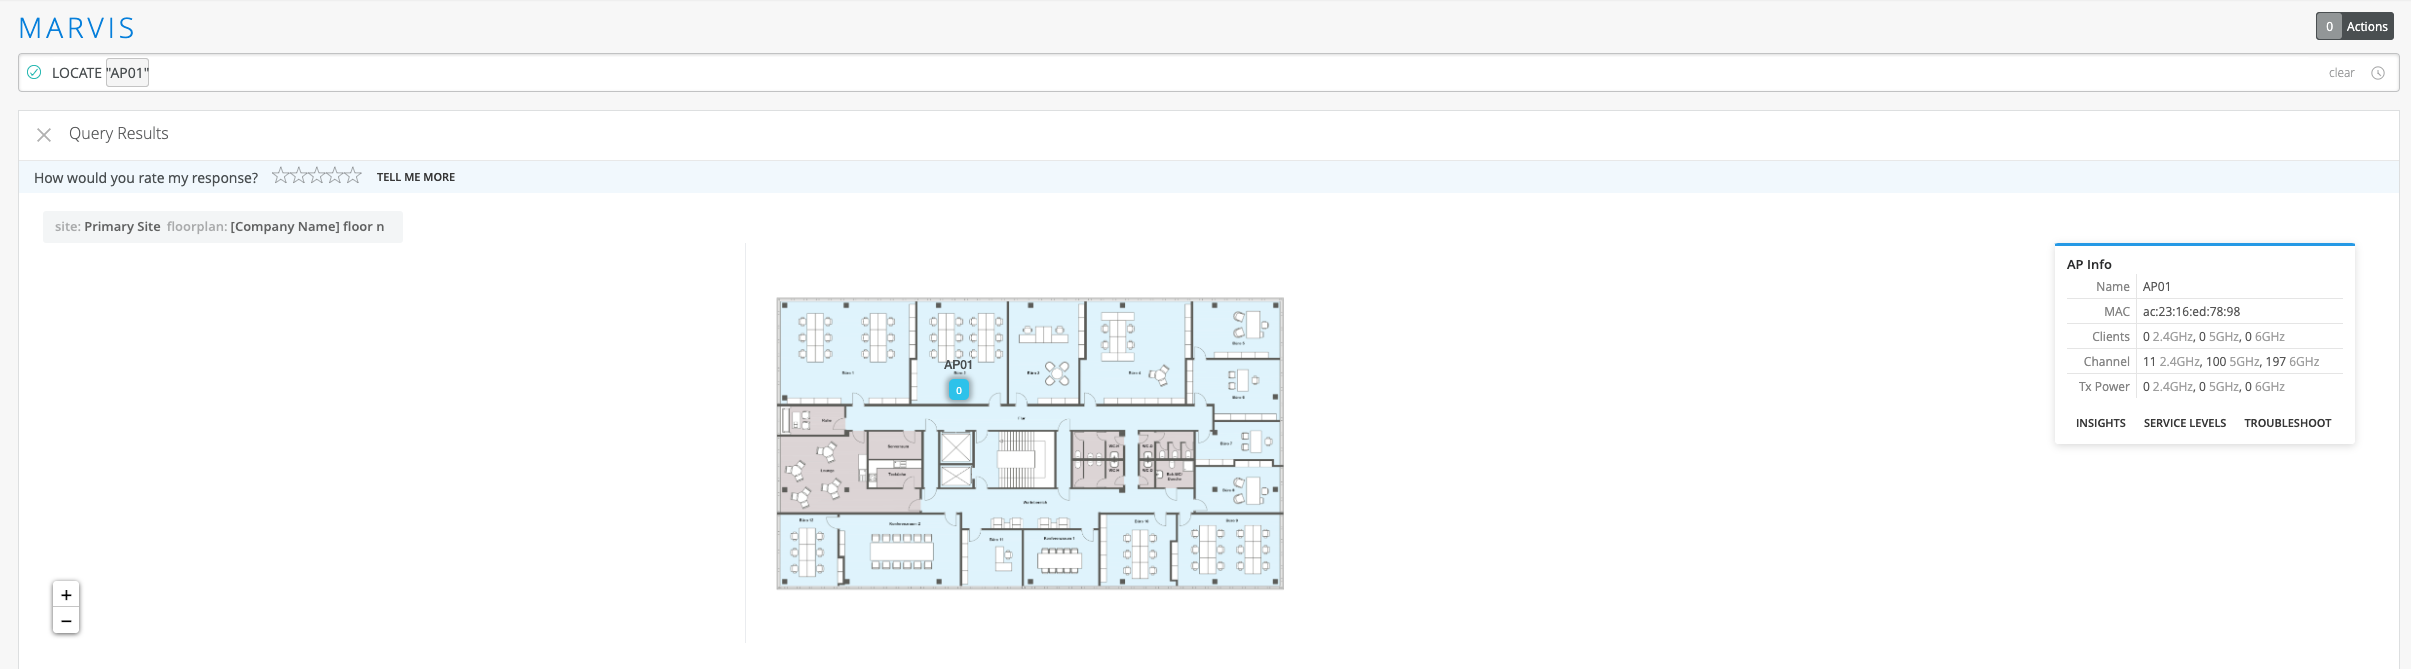
LOCATE 쿼리를 사용하여 사이트, AP 또는 클라이언트를 찾을 수 있습니다. 쿼리 출력에는 조직 > 사이트 구성에서 구성한 사이트 위치의 맵 보기가 표시됩니다. AP와 클라이언트의 경우 Marvis가 평면도에 이러한 디바이스의 위치를 표시합니다. 또한 Marvis는 추가 정보를 표시하고 인사이트, 서비스 수준 및 문제 해결 페이지에 대한 링크를 제공합니다.
AP의 채널 사용률 보기
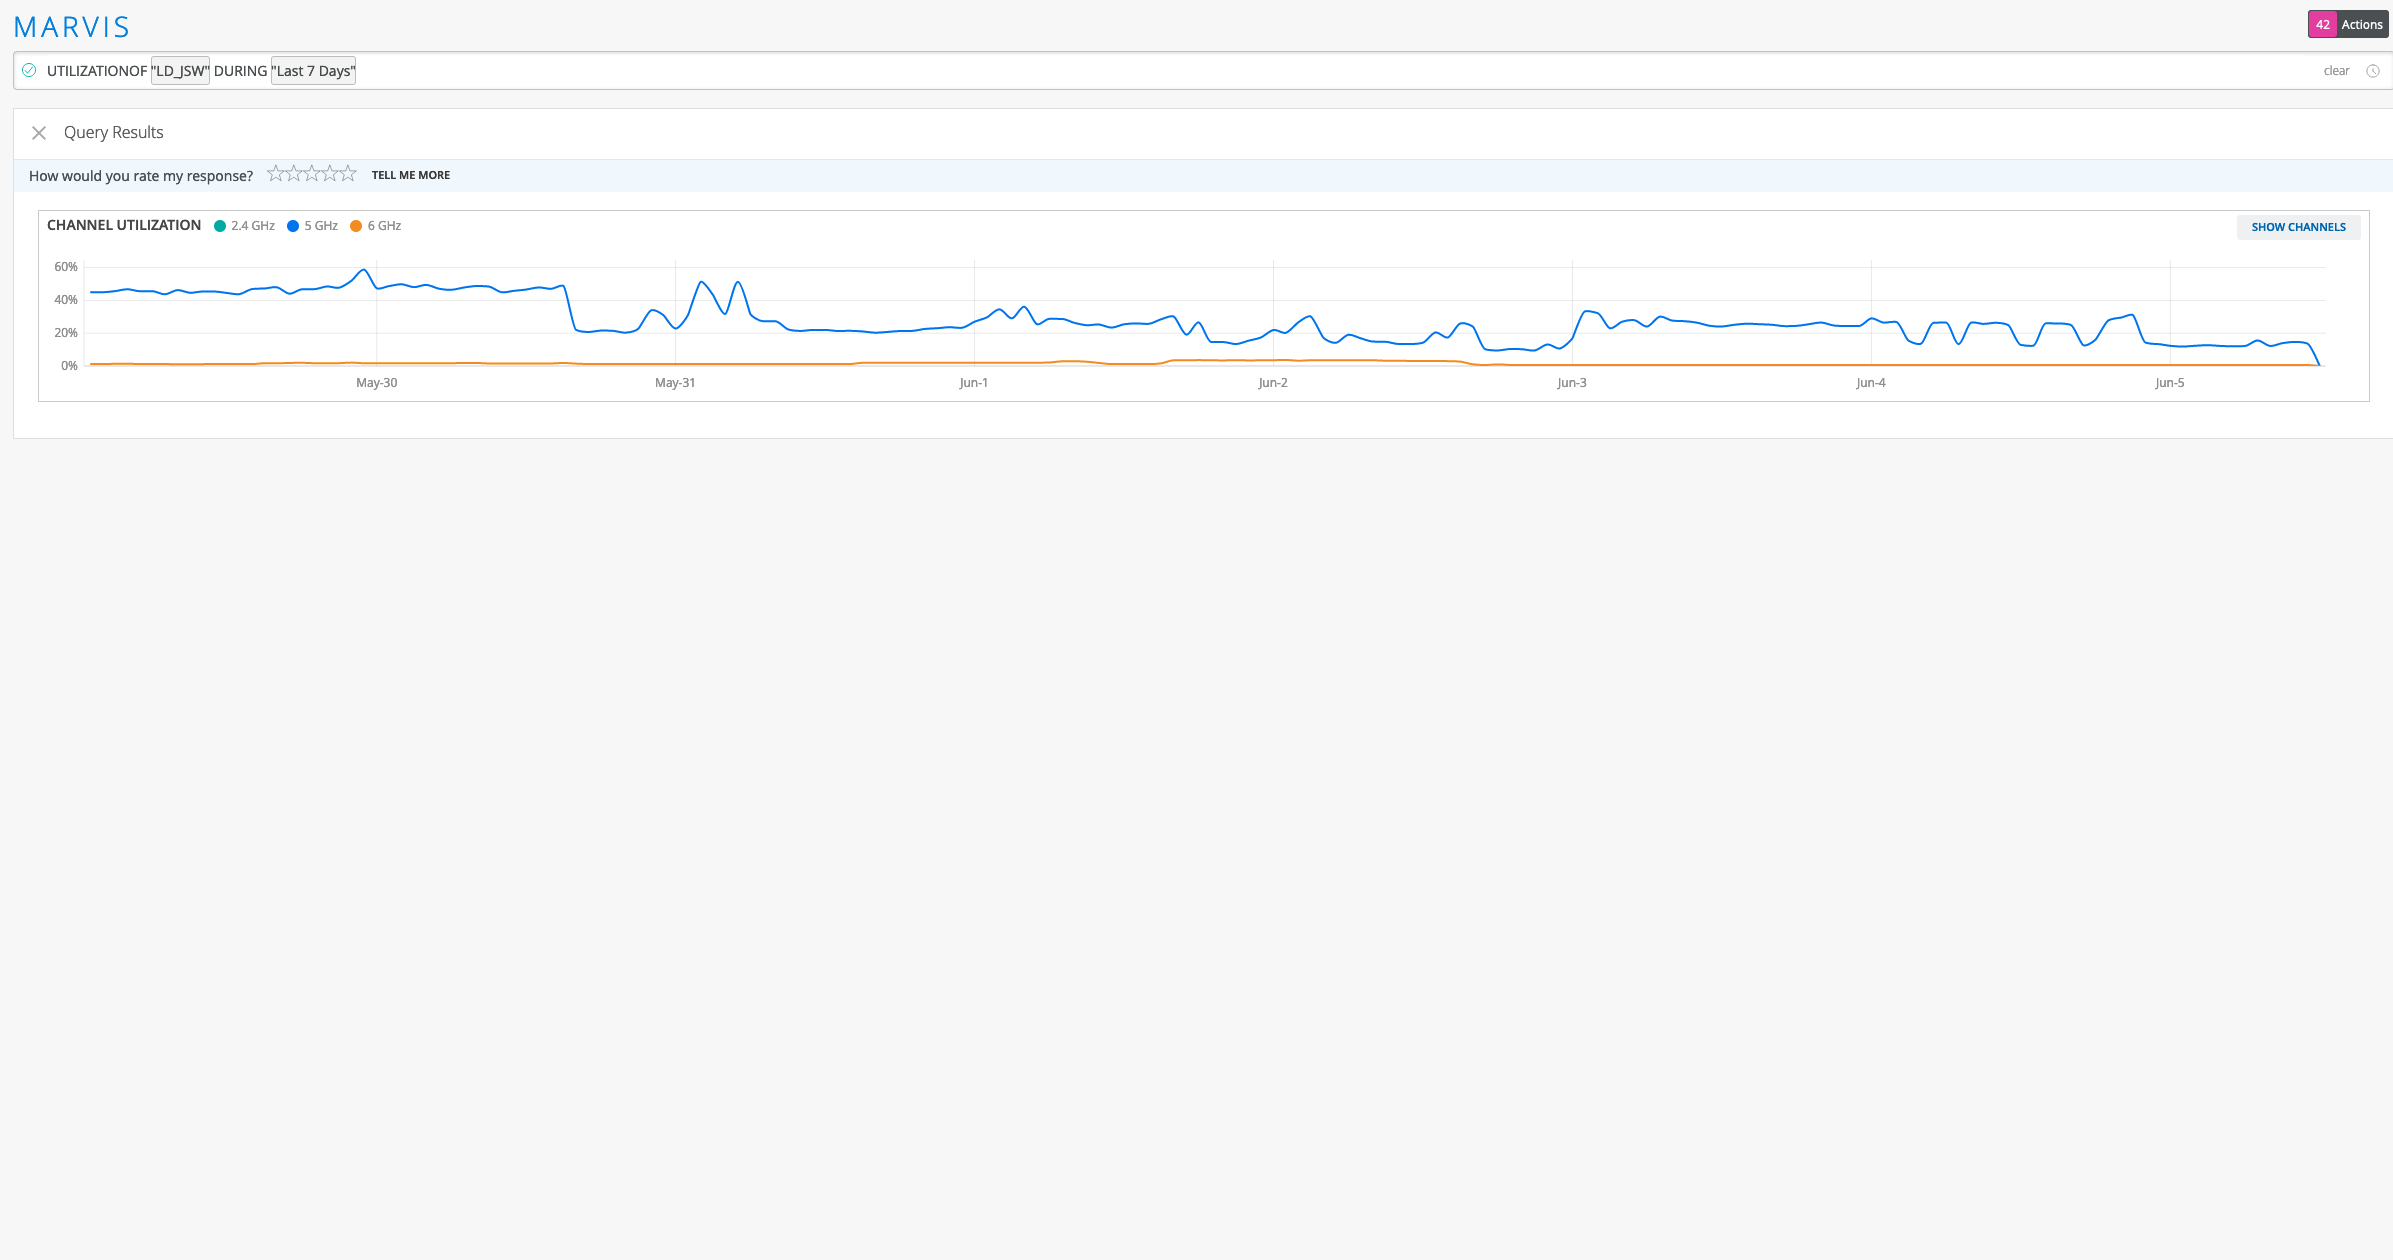
UTILIZATIONOF 쿼리를 사용하여 AP가 브로드캐스트하는 채널과 2.4GHz, 5GHz, 6GHz 대역 간의 사용 수준을 볼 수 있습니다. 채널 표시 를 클릭하여 AP가 사용하는 모든 특정 채널의 분석을 볼 수 있습니다.