対話型アシスタント「Marvis」を使用した特定の接続問題のトラブルシューティング

対話型アシスタントMarvisを使用して、特定の接続に関する問題をトラブルシューティングする方法について説明します。

対話型アシスタント「Marvis」を使用して接続の問題をトラブルシューティングする方法について理解できるように、トラブルシューティングの例をいくつか紹介します。

認証失敗のトラブルシューティング

認証の失敗は、RADIUSサーバーが応答しない、クライアントが認証プロセスを完了できないなど、さまざまな理由で発生する可能性があります。この例では、対話型アシスタントMarvisを使用して、サイトとクライアントの両方の認証エラーをトラブルシューティングする方法を示しています。

サイトでの認証エラーをトラブルシューティングするには:

  1. Marvis対話型アシスタントウィンドウで、 troubleshoot の後にサイト名を入力します。期間を指定することもできます。

    この例では、Marvisが無線ネットワーク内の認証の問題を特定することがわかります。
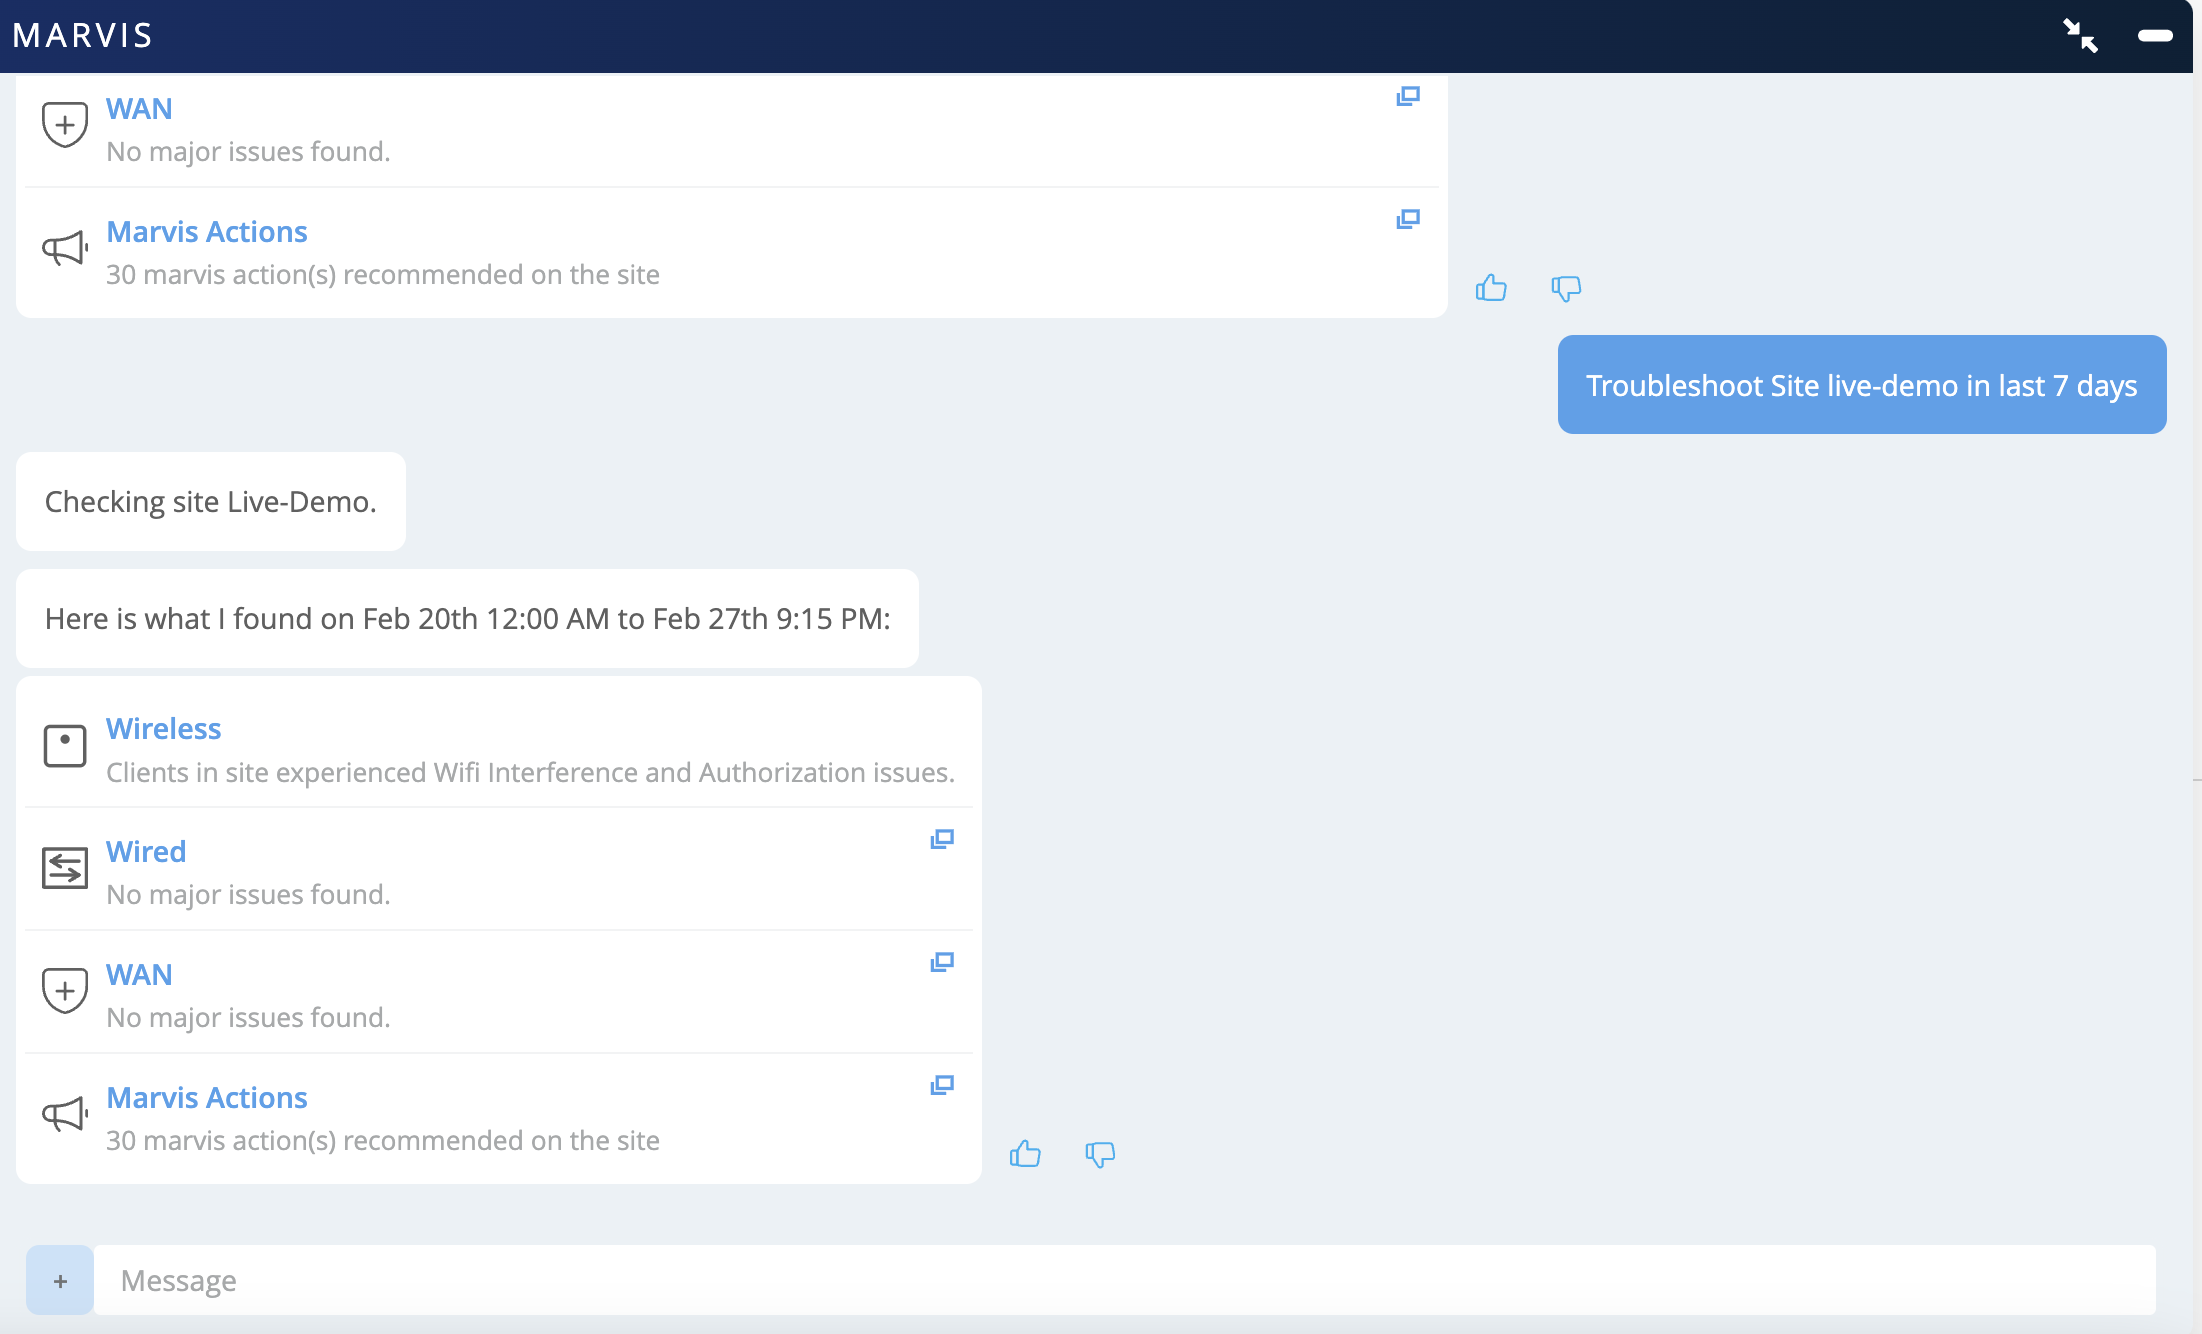
    Troubleshooting interface for MARVIS analyzing site Live-Demo from February 20th 12:00 AM to February 27th 9:15 PM. Wireless shows WiFi interference and authorization issues. Wired and WAN report no major issues. Marvis recommends 30 actions. Includes button to troubleshoot site and options for user feedback.

  2. [ ワイヤレス] カテゴリをクリックすると、問題の詳細が表示されます。この例では、サイトのクライアントが認証エラーに直面した確率が36%だったとMarvisが報告していることがわかります。
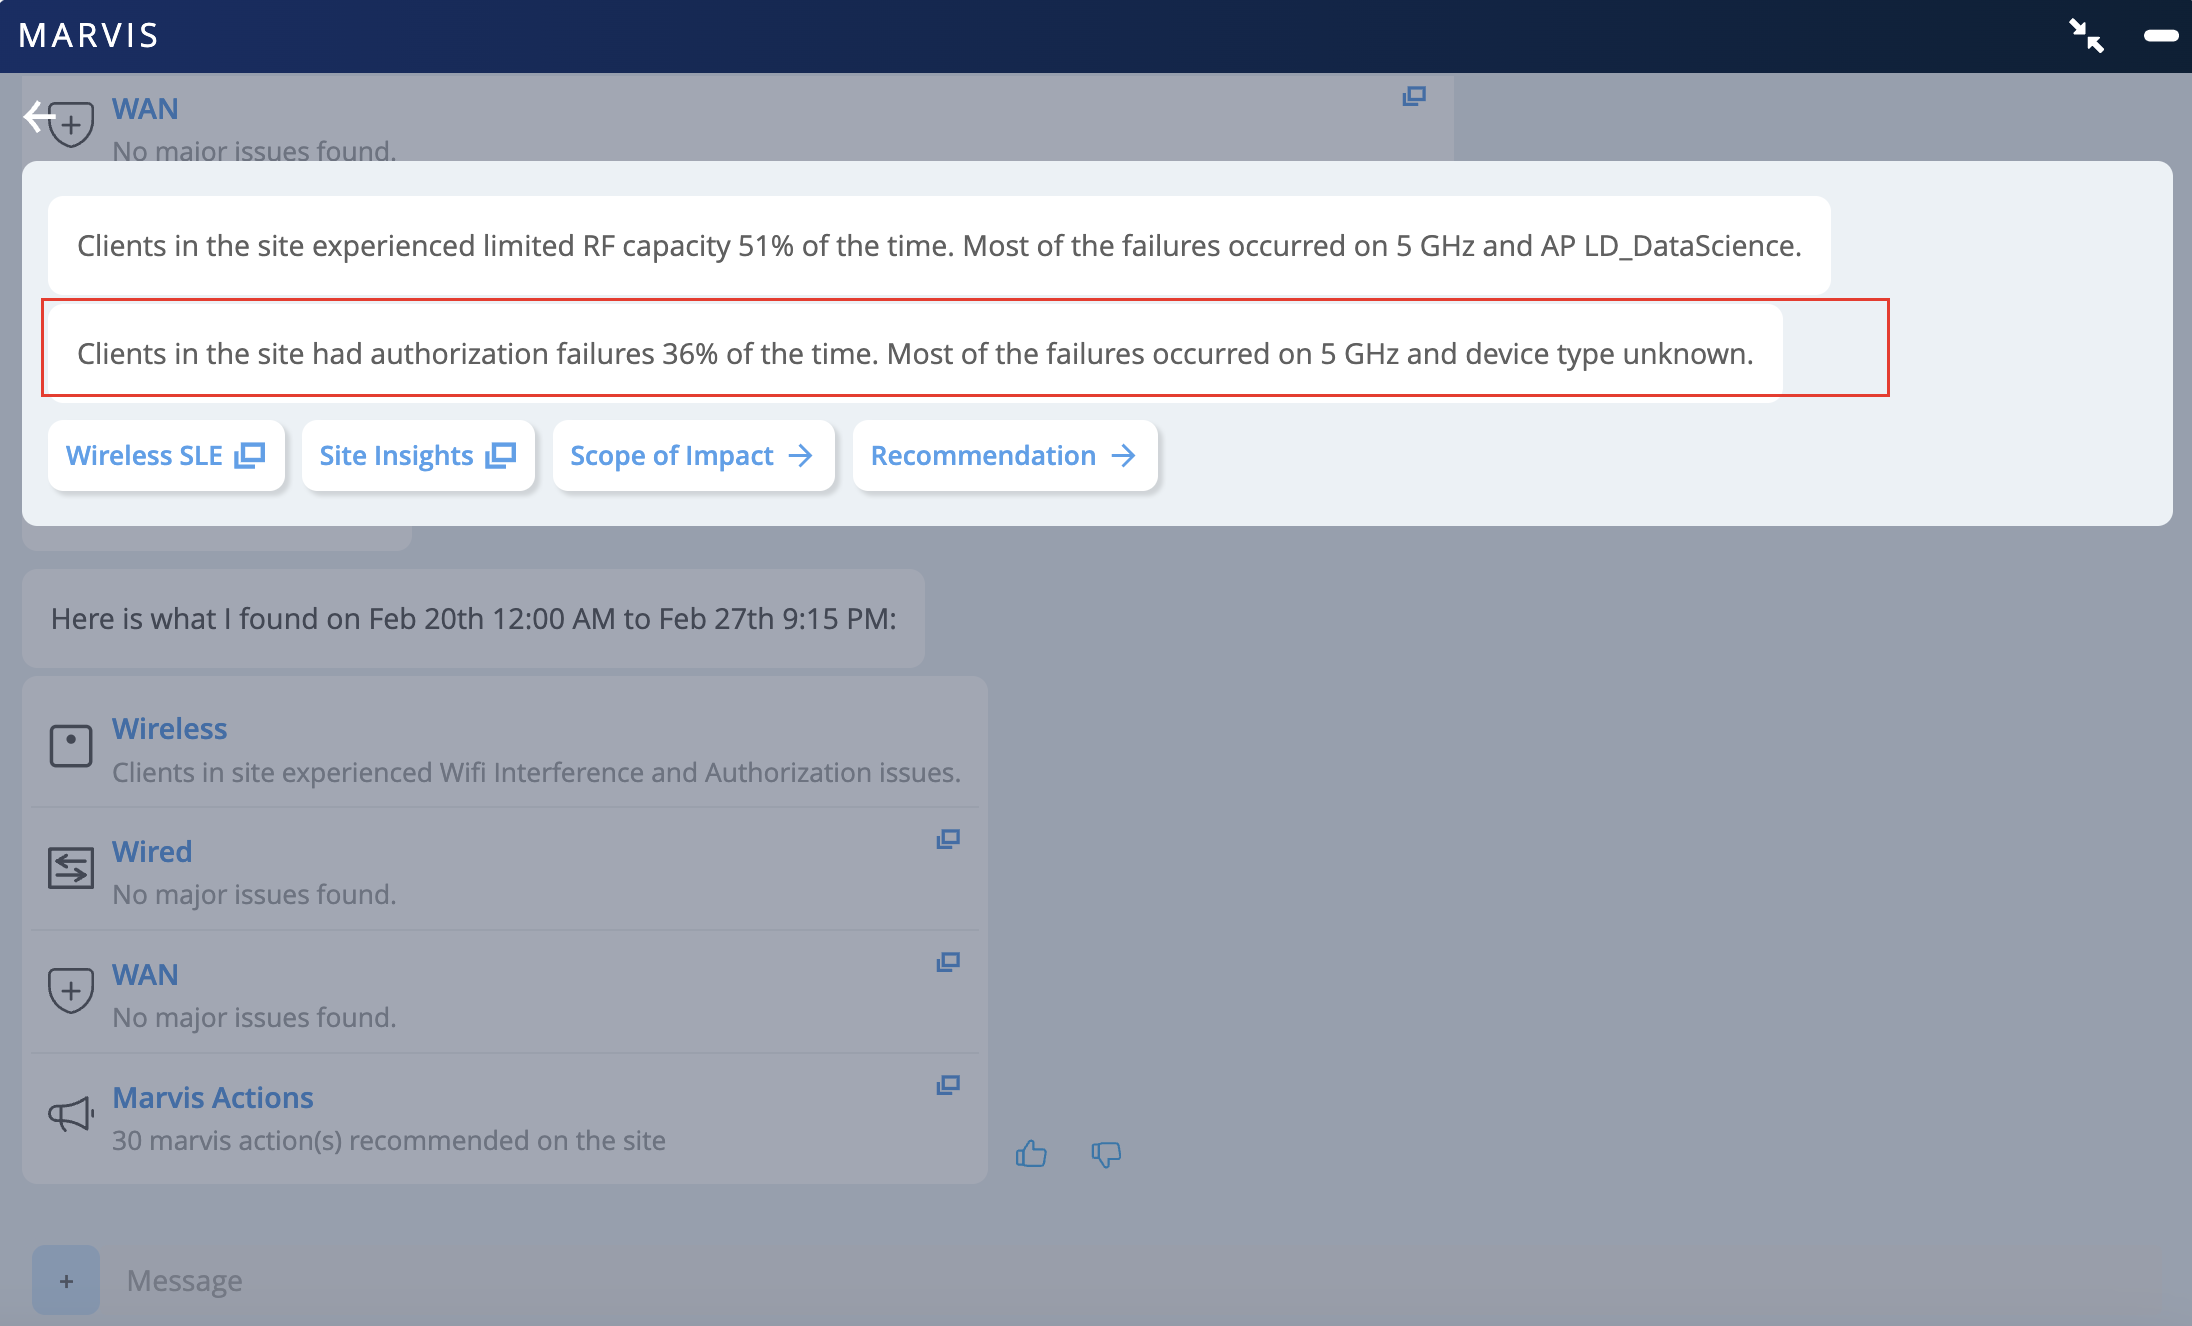
    Network monitoring tool screenshot summarizing wireless issues, wired and WAN status, and Marvis recommendations. Wireless issues include RF capacity failures 51 percent of the time and authorization failures 36 percent of the time, mostly on the 5 GHz band linked to AP LD_DataScience. Wired and WAN connections show no major issues. System suggests 30 actions to resolve site issues. Timestamped February 20th to February 27th.

表示されたオプションを使用して、さらに調査できます。

影響の範囲

影響の範囲は、問題が発生したすべてのクライアントをグラフィカルに表示します。右側のドロップダウンリストを使用して、無線LAN(WLAN)、アクセスポイント(AP)、または無線帯域に基づいて情報を表示することもできます。
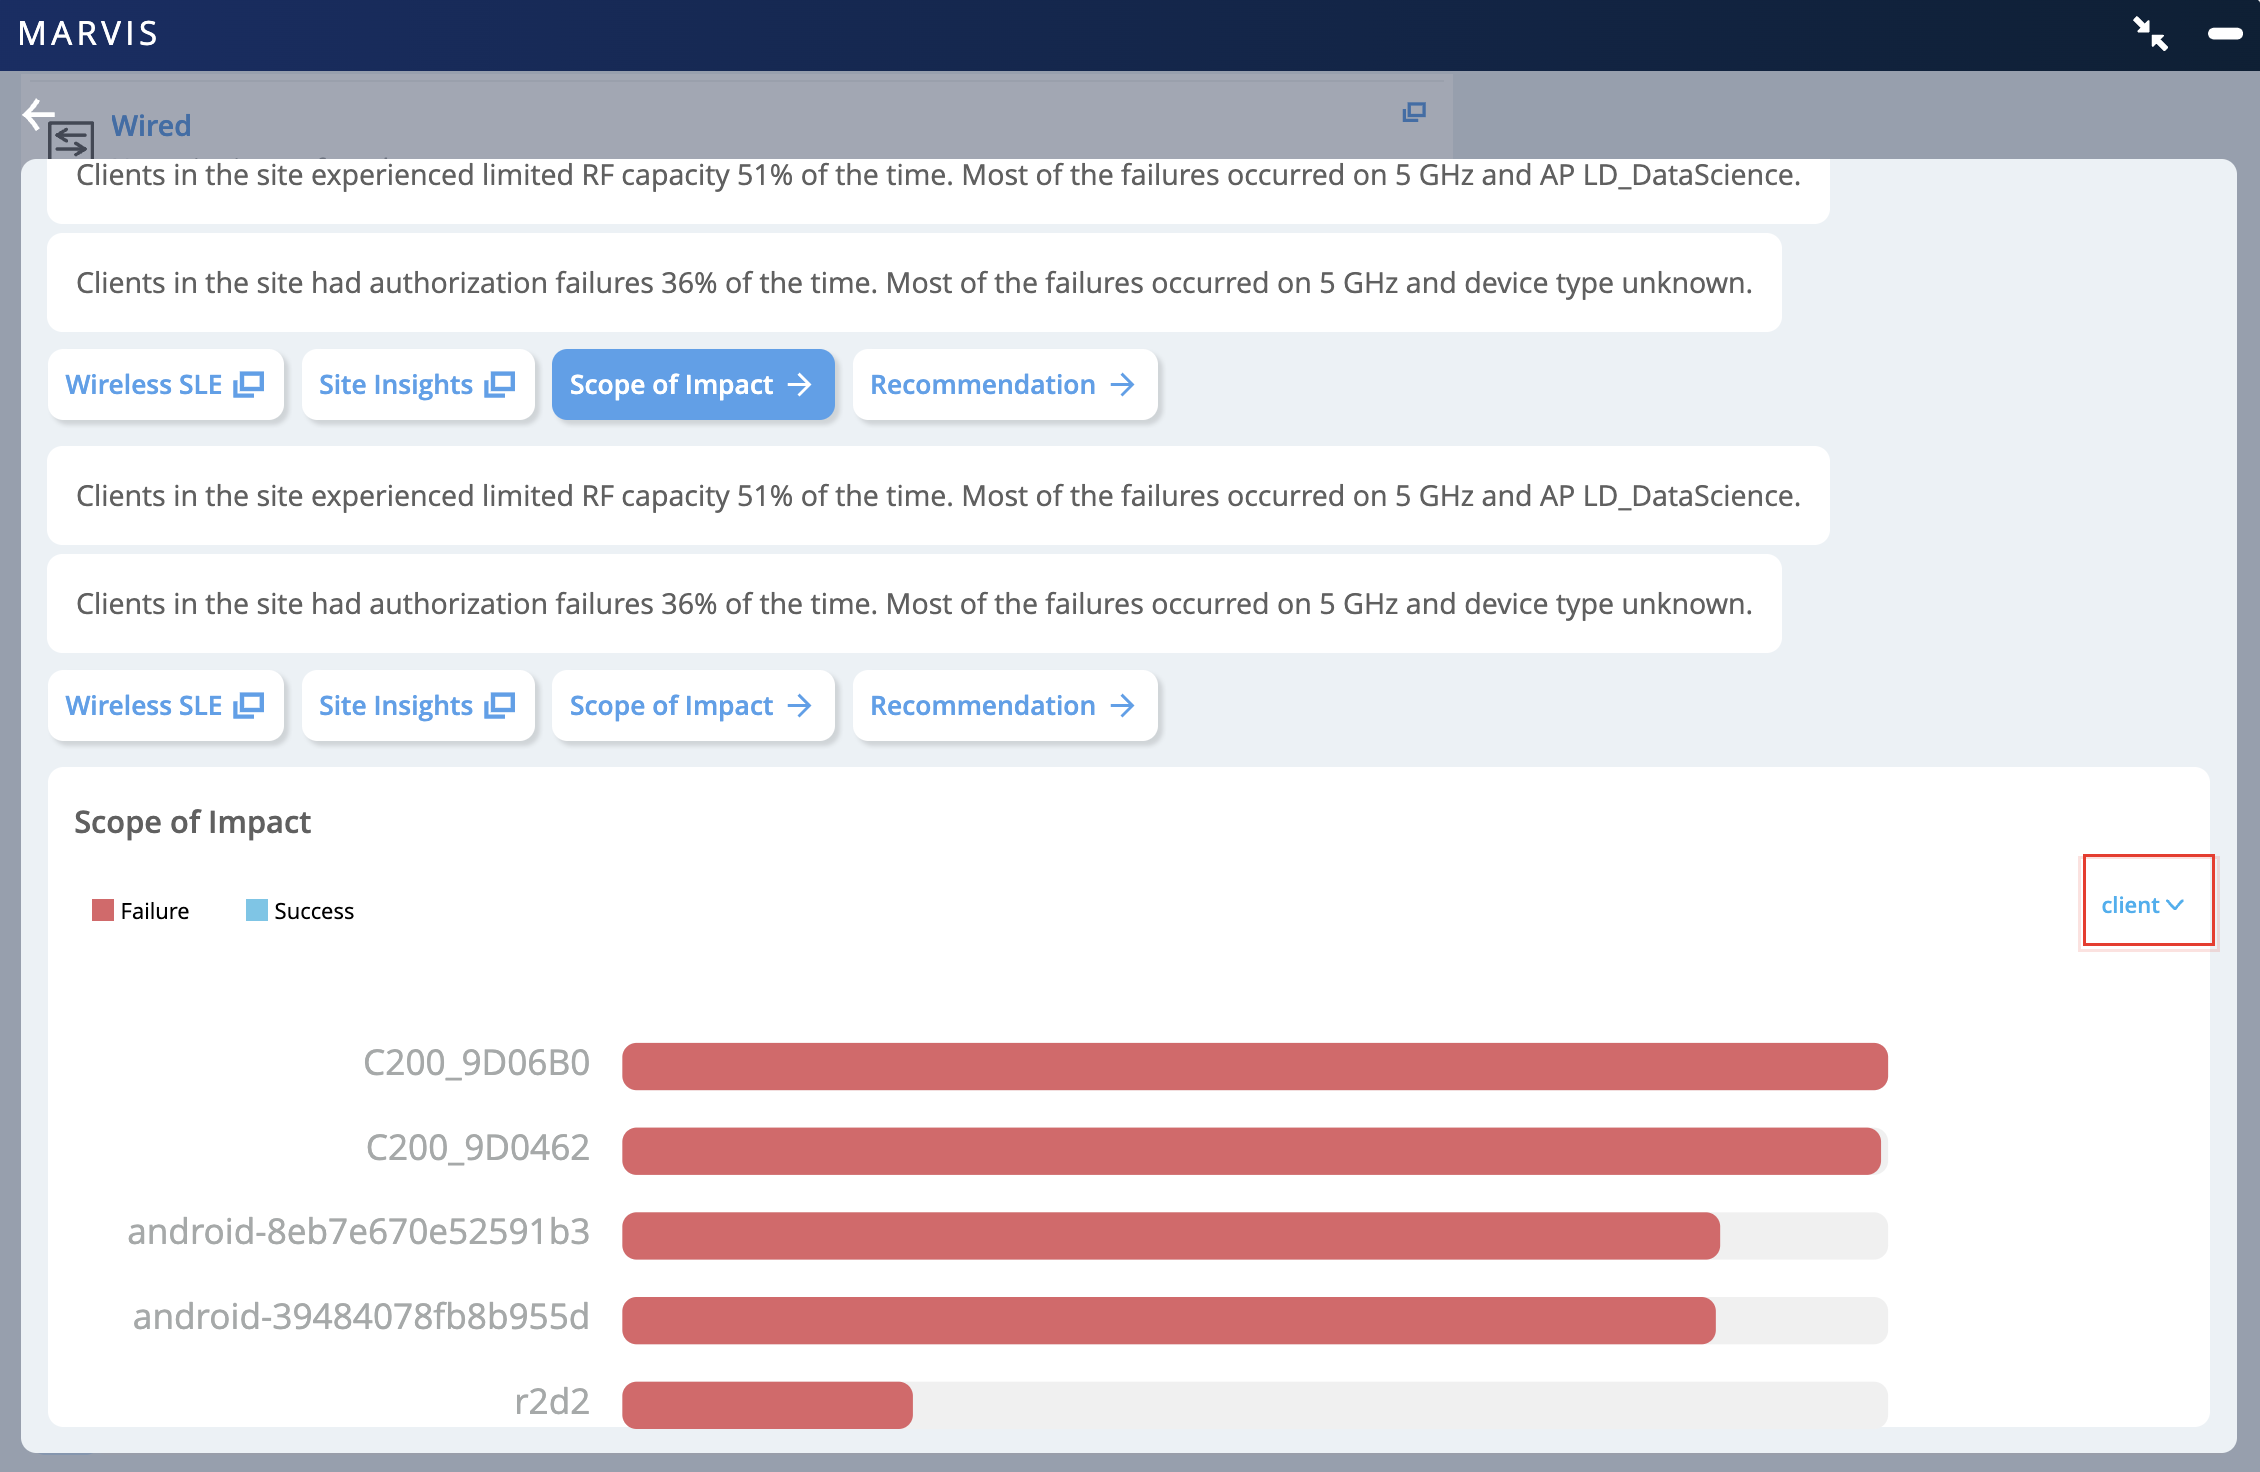
Network monitoring dashboard from Marvis showing wireless performance issues. Summary highlights RF capacity issues 51 percent of the time and authorization failures 36 percent of the time, mostly on 5 GHz band. Tabs include Wireless SLE, Site Insights, Scope of Impact, and Recommendation. Bar chart displays client impact with red bars for failures and blue bars for successes. Dropdown menu allows filtering by client.

無線SLE

無線SLEダッシュボードには、サイトレベルのインサイトとSLE分類子が表示されます。この例では、接続の成功したサービス レベル期待値 (SLE) で、接続の 64% が成功したことがわかります。
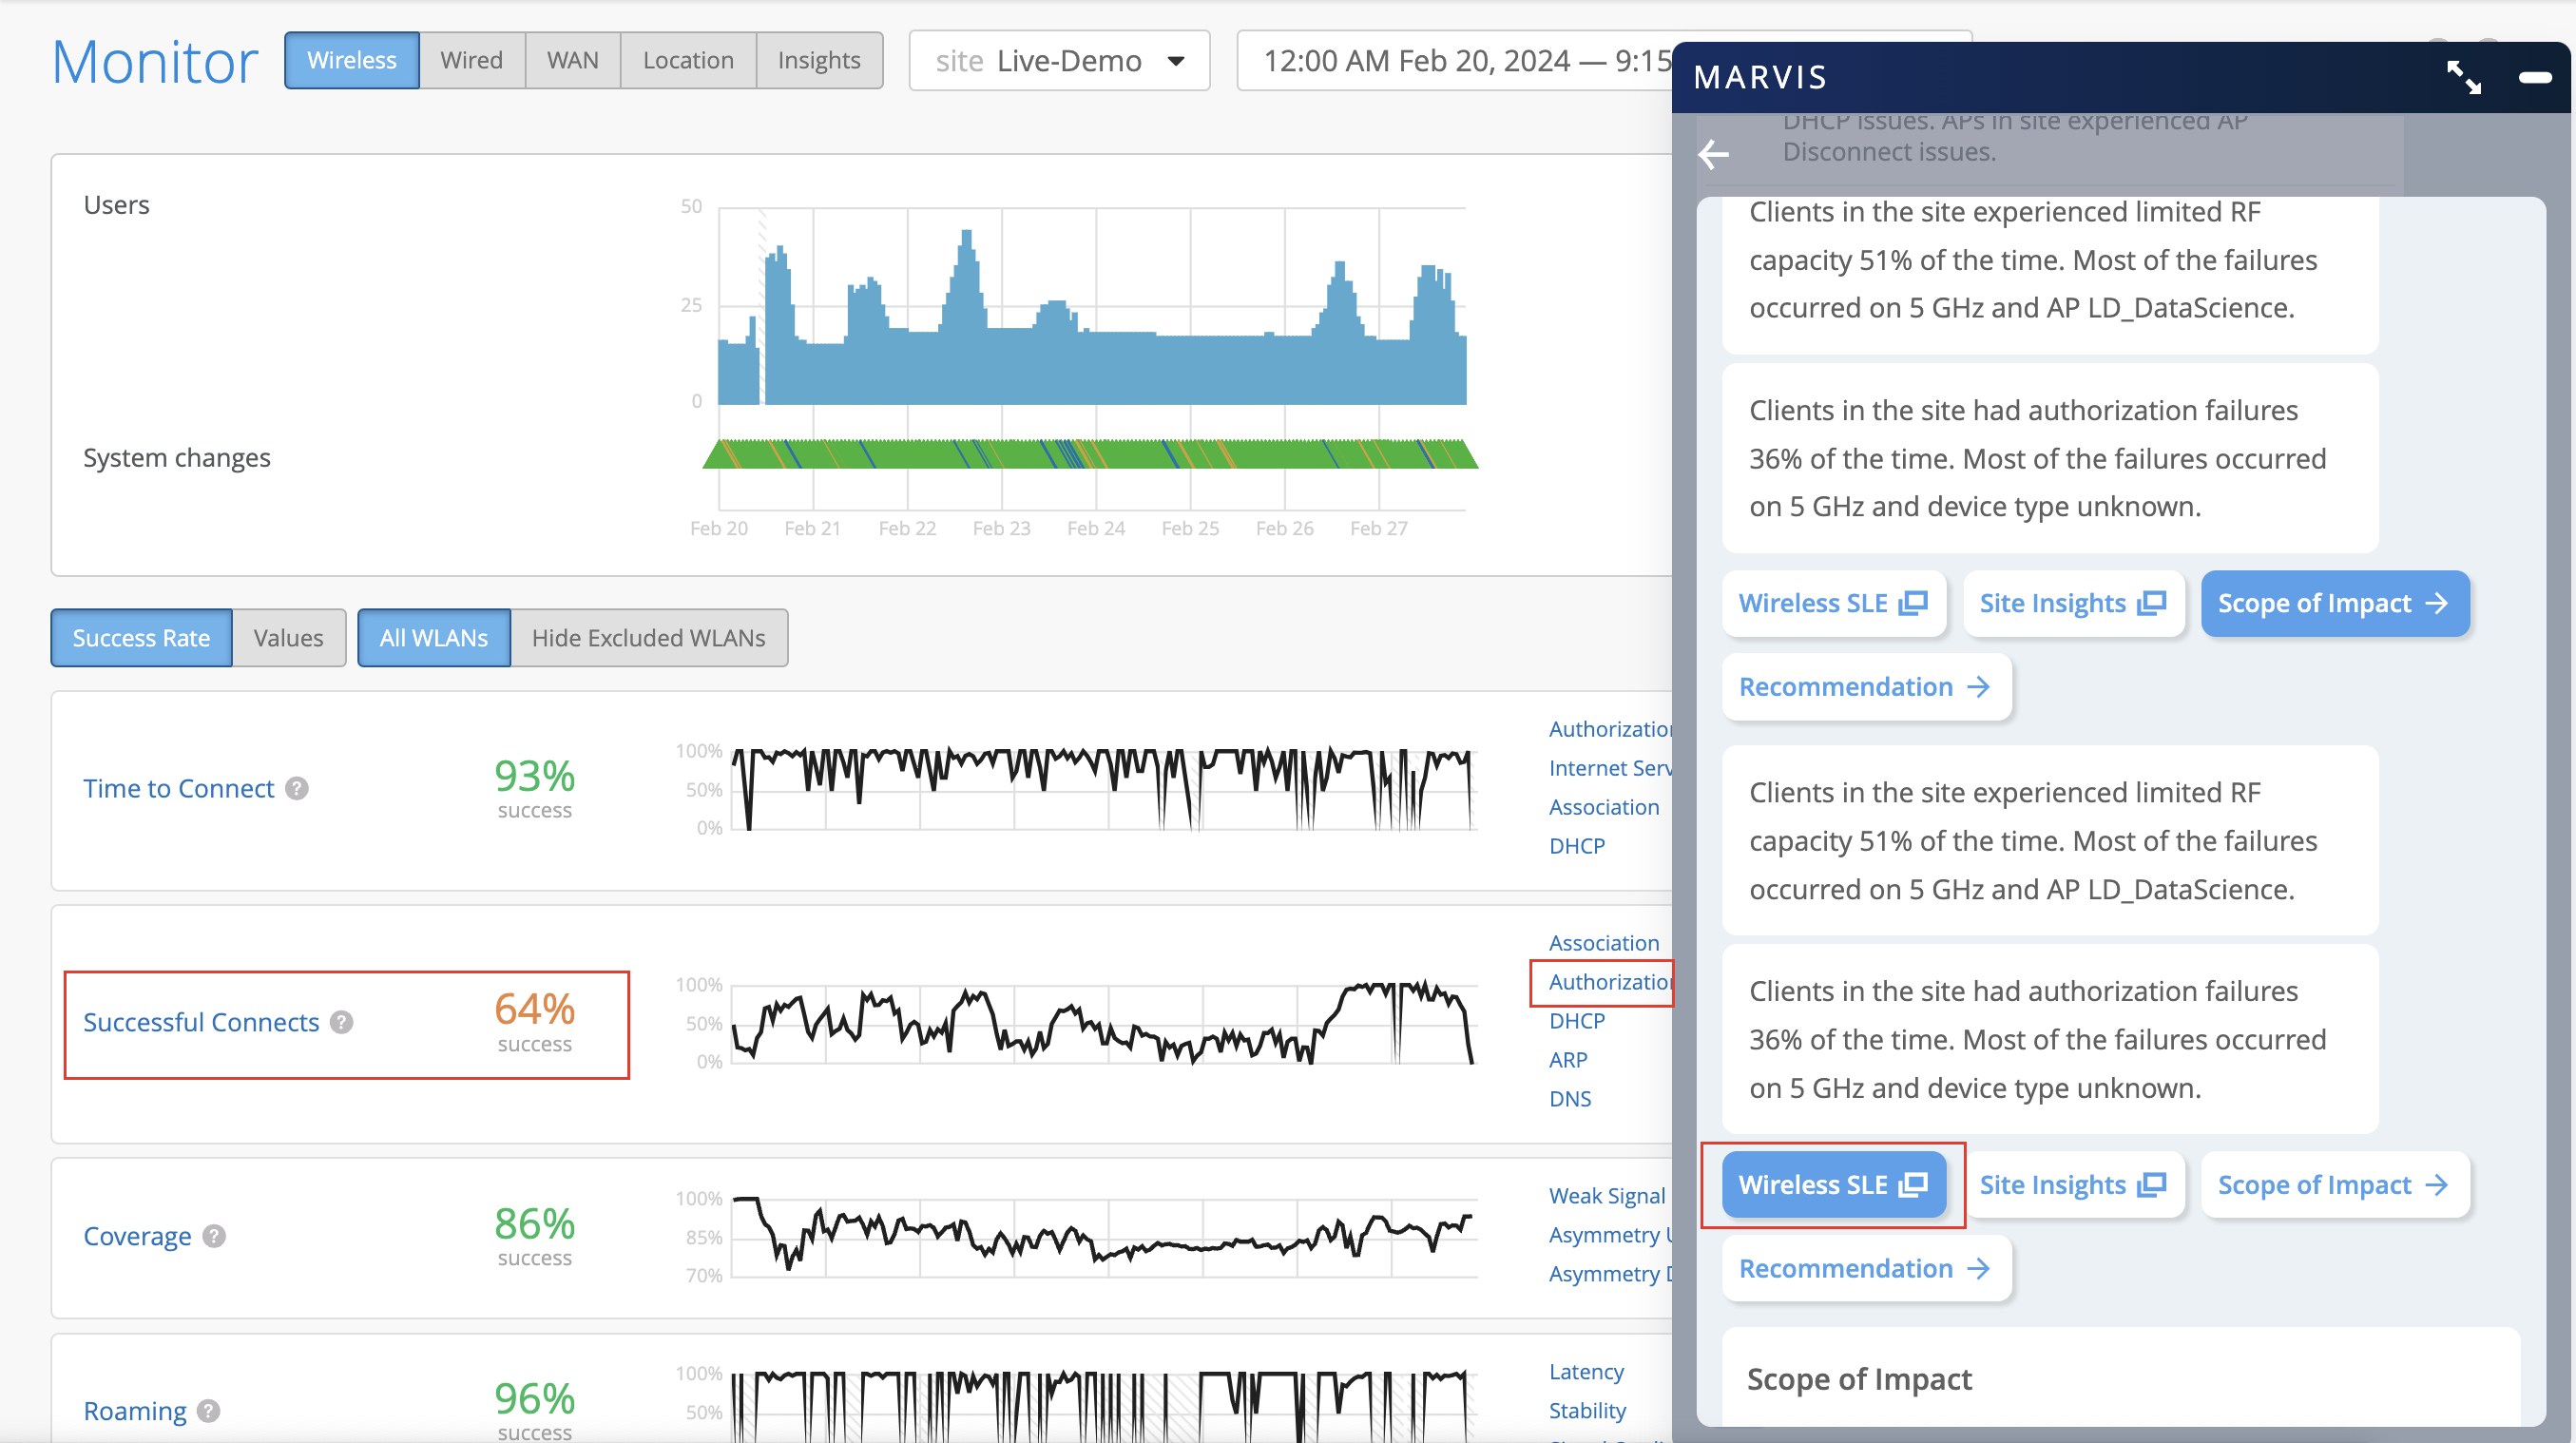
Network monitoring dashboard showing wireless performance metrics and issues. Key data includes 64 percent successful connects, highlighted in red. MARVIS panel lists issues like limited RF capacity and authorization failures on 5 GHz, with recommendations for resolution.

右側の 認証 分類子をクリックして、根本原因分析ページを表示します。このページでは、詳細な情報を提供します。ページ上の各タブを確認できます。例えば、「配布」タブを使用して、問題が以下の全体で観察されているかどうかを判断できます。

  • すべてのAPまたは特定のAP

  • すべてのユーザーまたは特定のユーザー

  • すべてのWLANまたは特定のWLAN

  • すべてのデバイスタイプまたは特定のデバイスタイプ

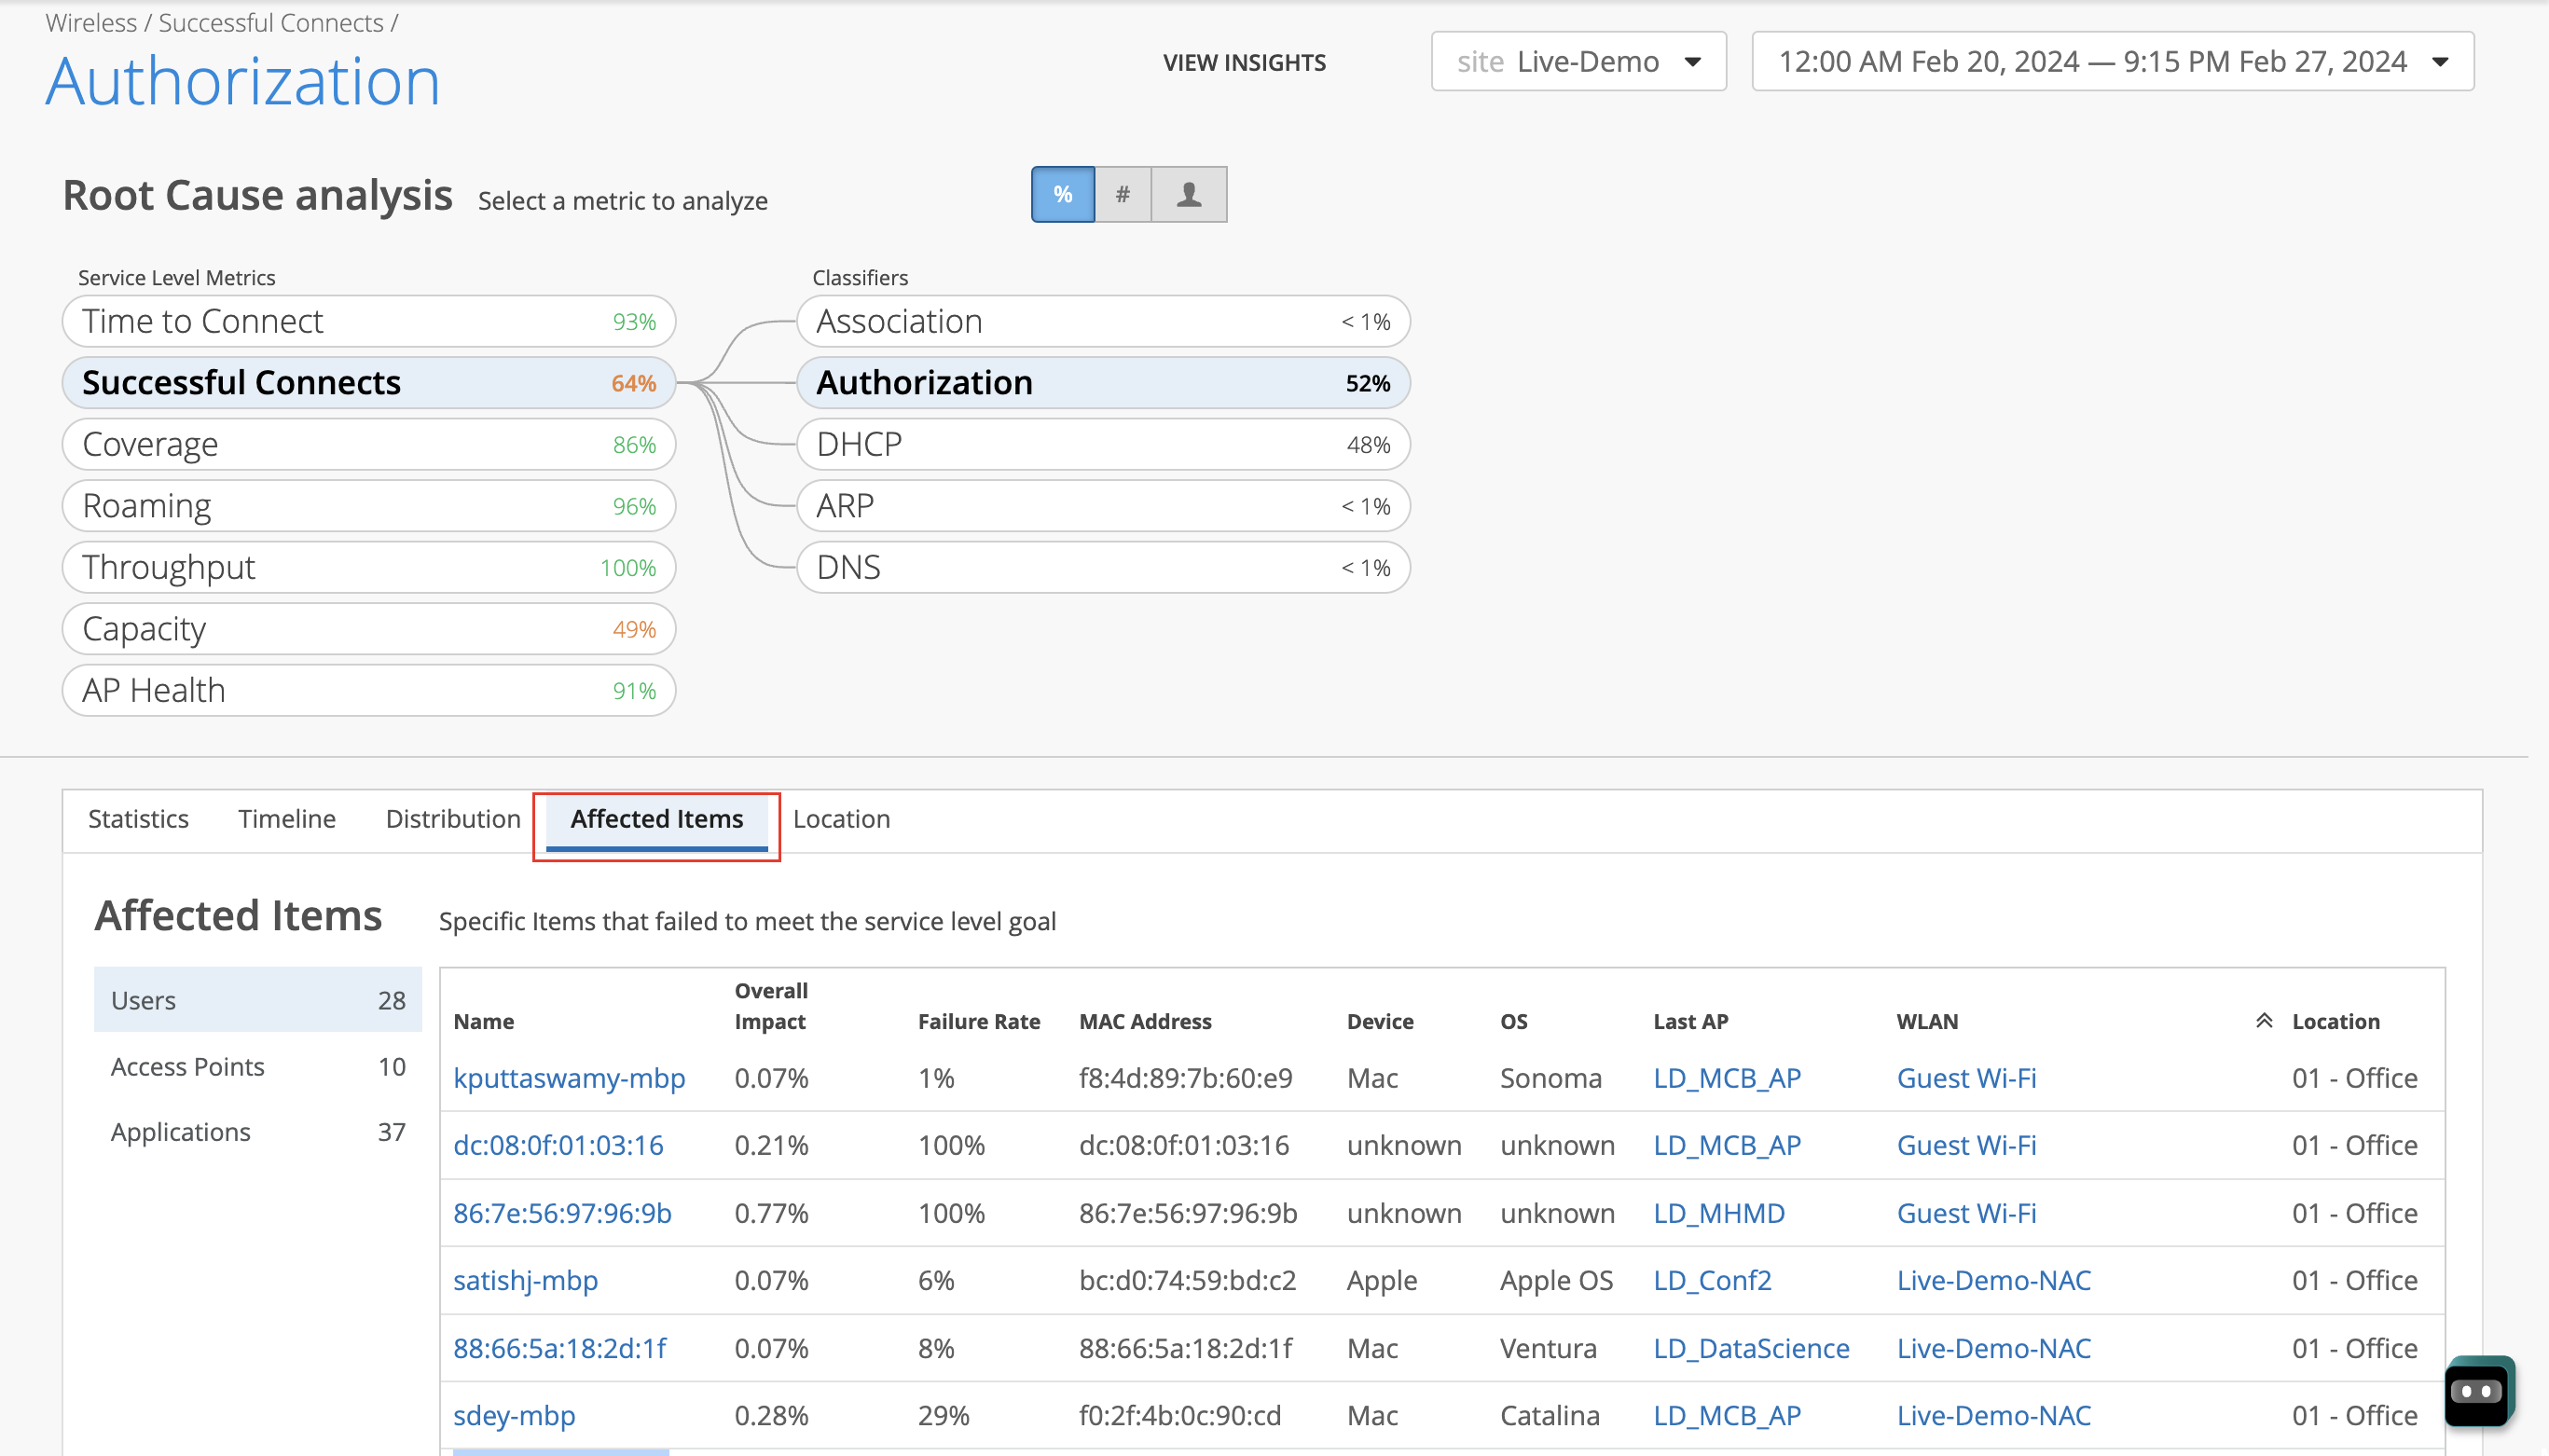
Dashboard analyzing wireless network performance, highlighting Successful Connects with a 64 percent success rate and Authorization as a major classifier with 52 percent impact. Includes root cause analysis metrics, affected items with failure details, and filters set to Live-Demo from February 20, 2024, to February 27, 2024.

影響を受けるアイテムタブには、影響を受けるユーザー、AP、アプリケーションが表示されます。ユーザーをクリックすると、さらにドリルダウンできます。失敗率列は、ユーザーが常に接続に失敗するかどうかを示します。次の例に示すように、長期間にわたって100%の障害率が発生しているユーザーは、Marvis Actionsの[Persistently Failing Clients]カテゴリに表示されます。
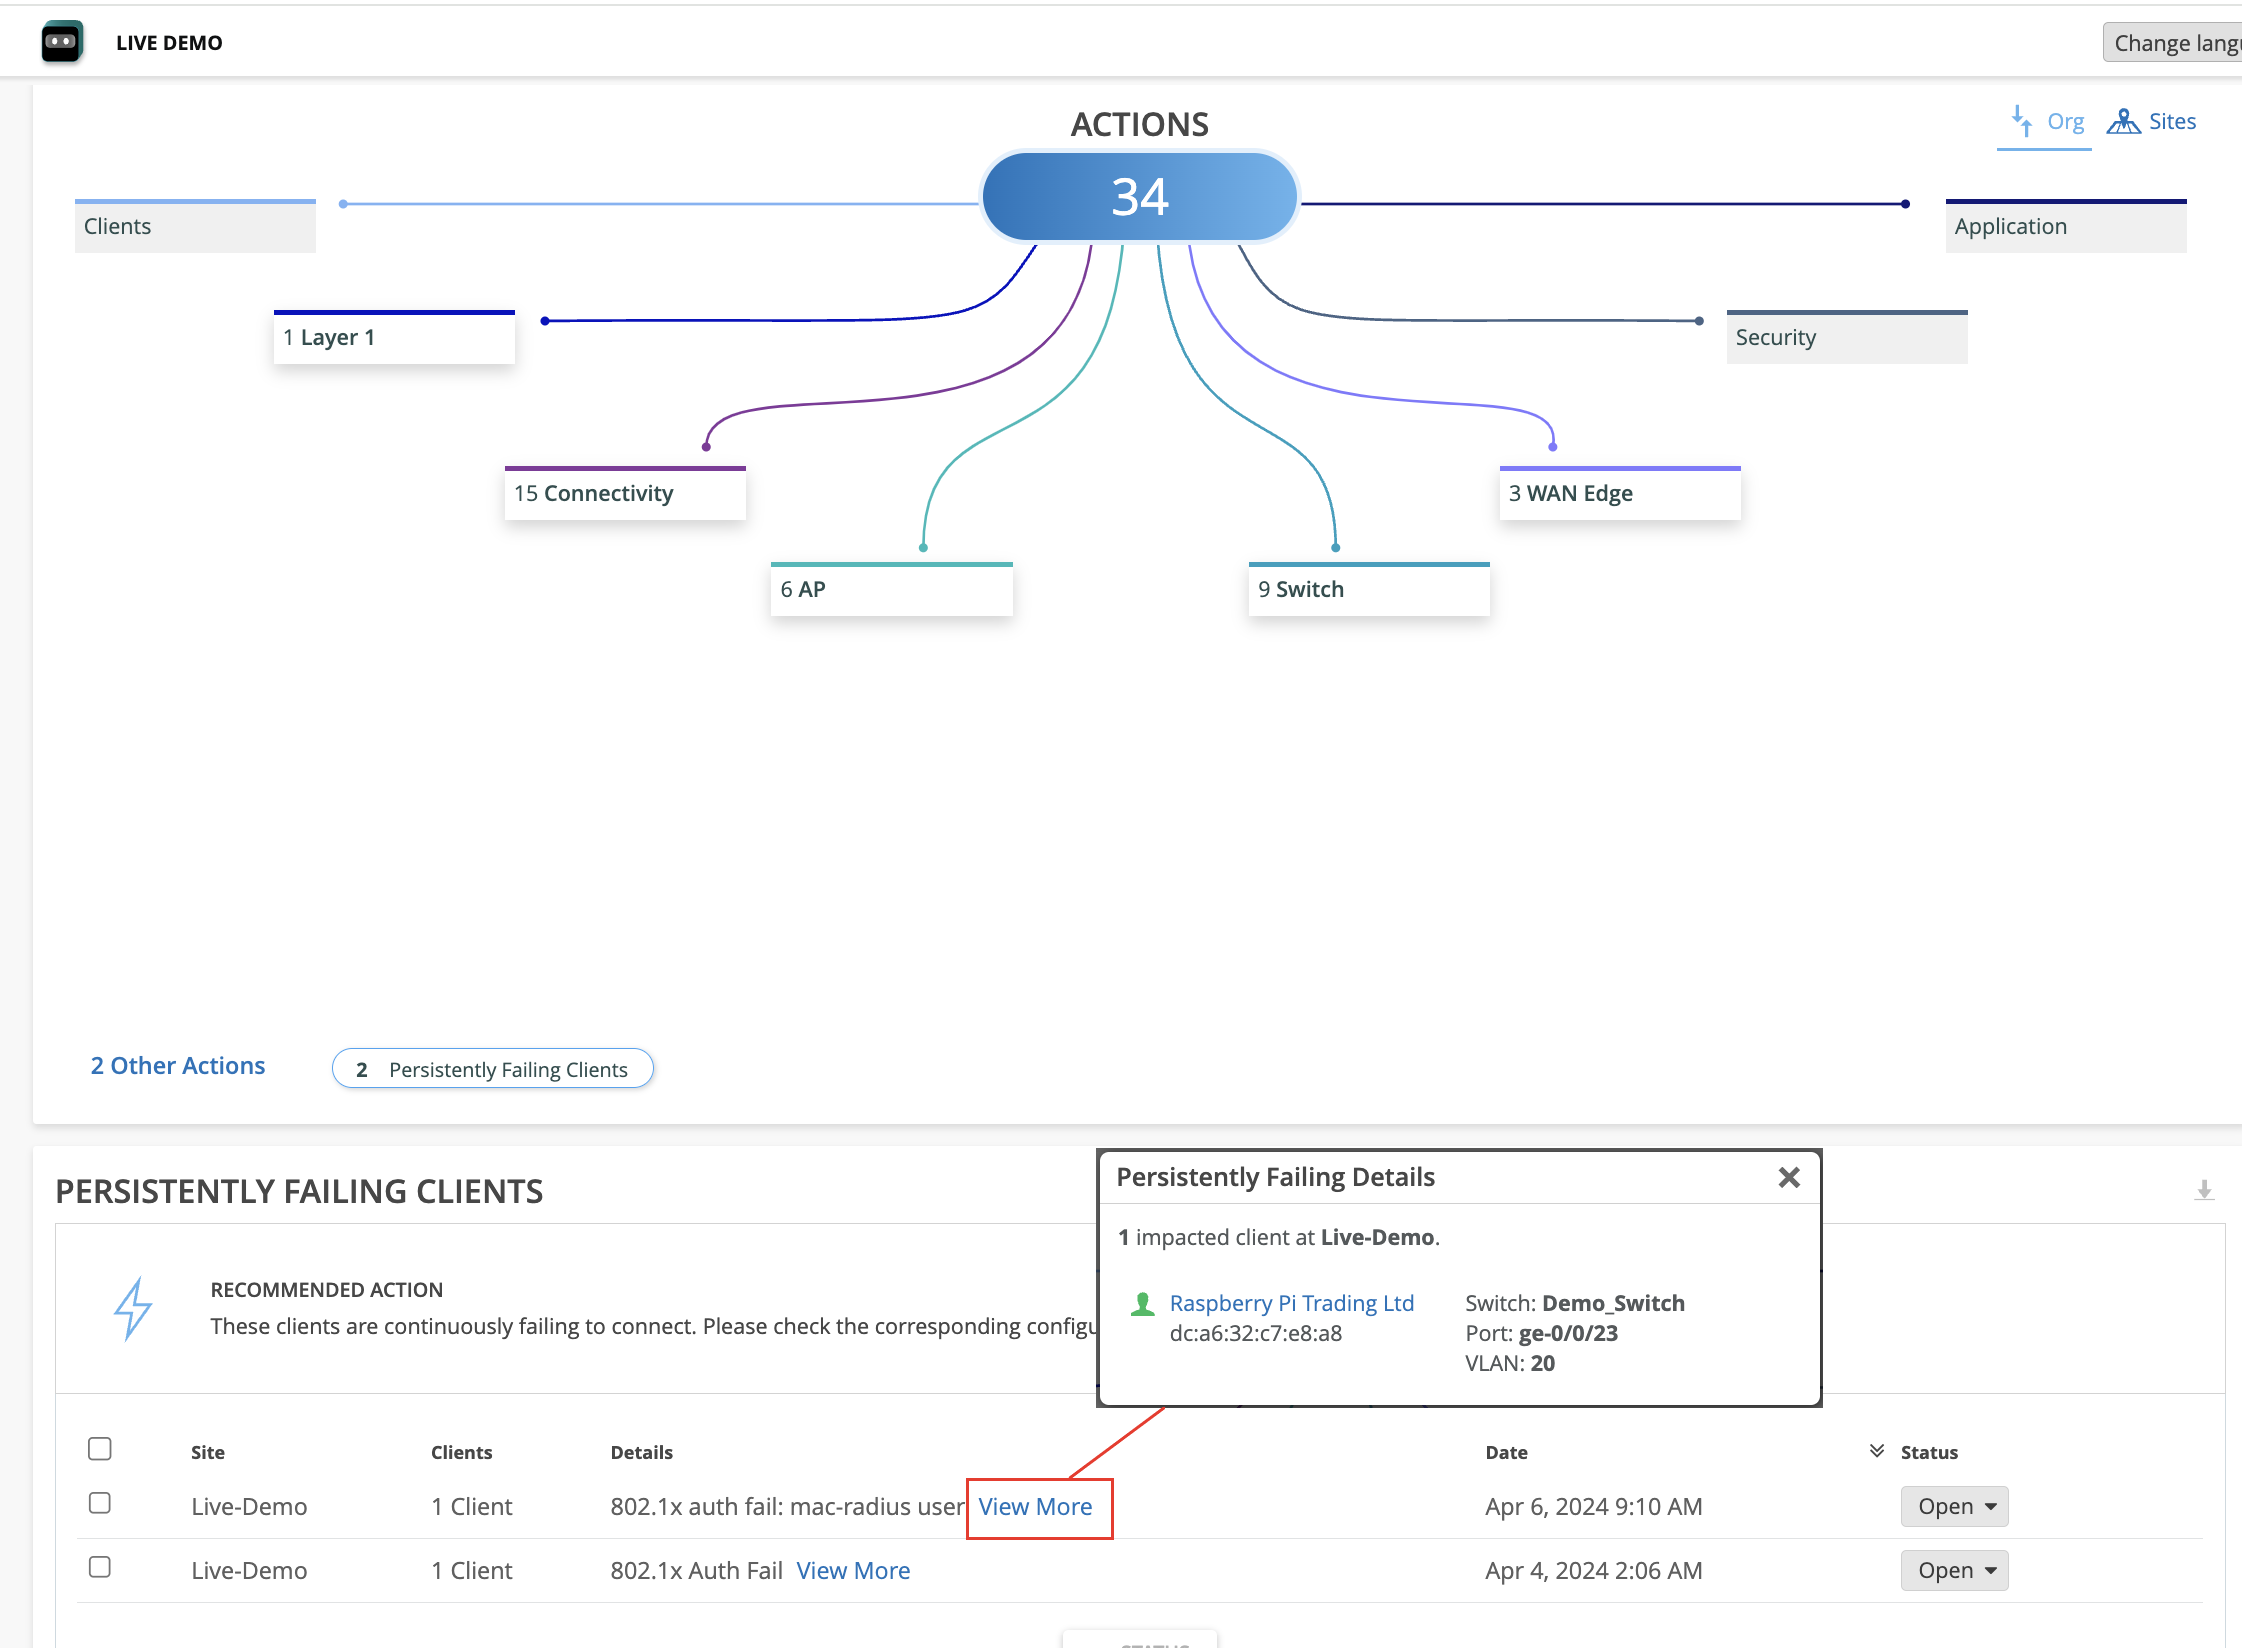
Dashboard showing network issues: 34 actions categorized into Clients, Connectivity, AP, Switch, WAN Edge, Application, and Security. Bottom section lists persistently failing clients with site names, failure details, timestamps, and statuses. Detailed view includes client name, MAC address, switch name, port, and VLAN. Options for filtering by organization or site and changing language are available.

クライアントの認証エラーをトラブルシューティングするには:

  1. Marvis対話型アシスタントウィンドウで、 tshoot client の後にクライアントのMACアドレス名またはホスト名を入力します。次の例では、Marvisがクライアントの認証エラーを検出していることがわかります。
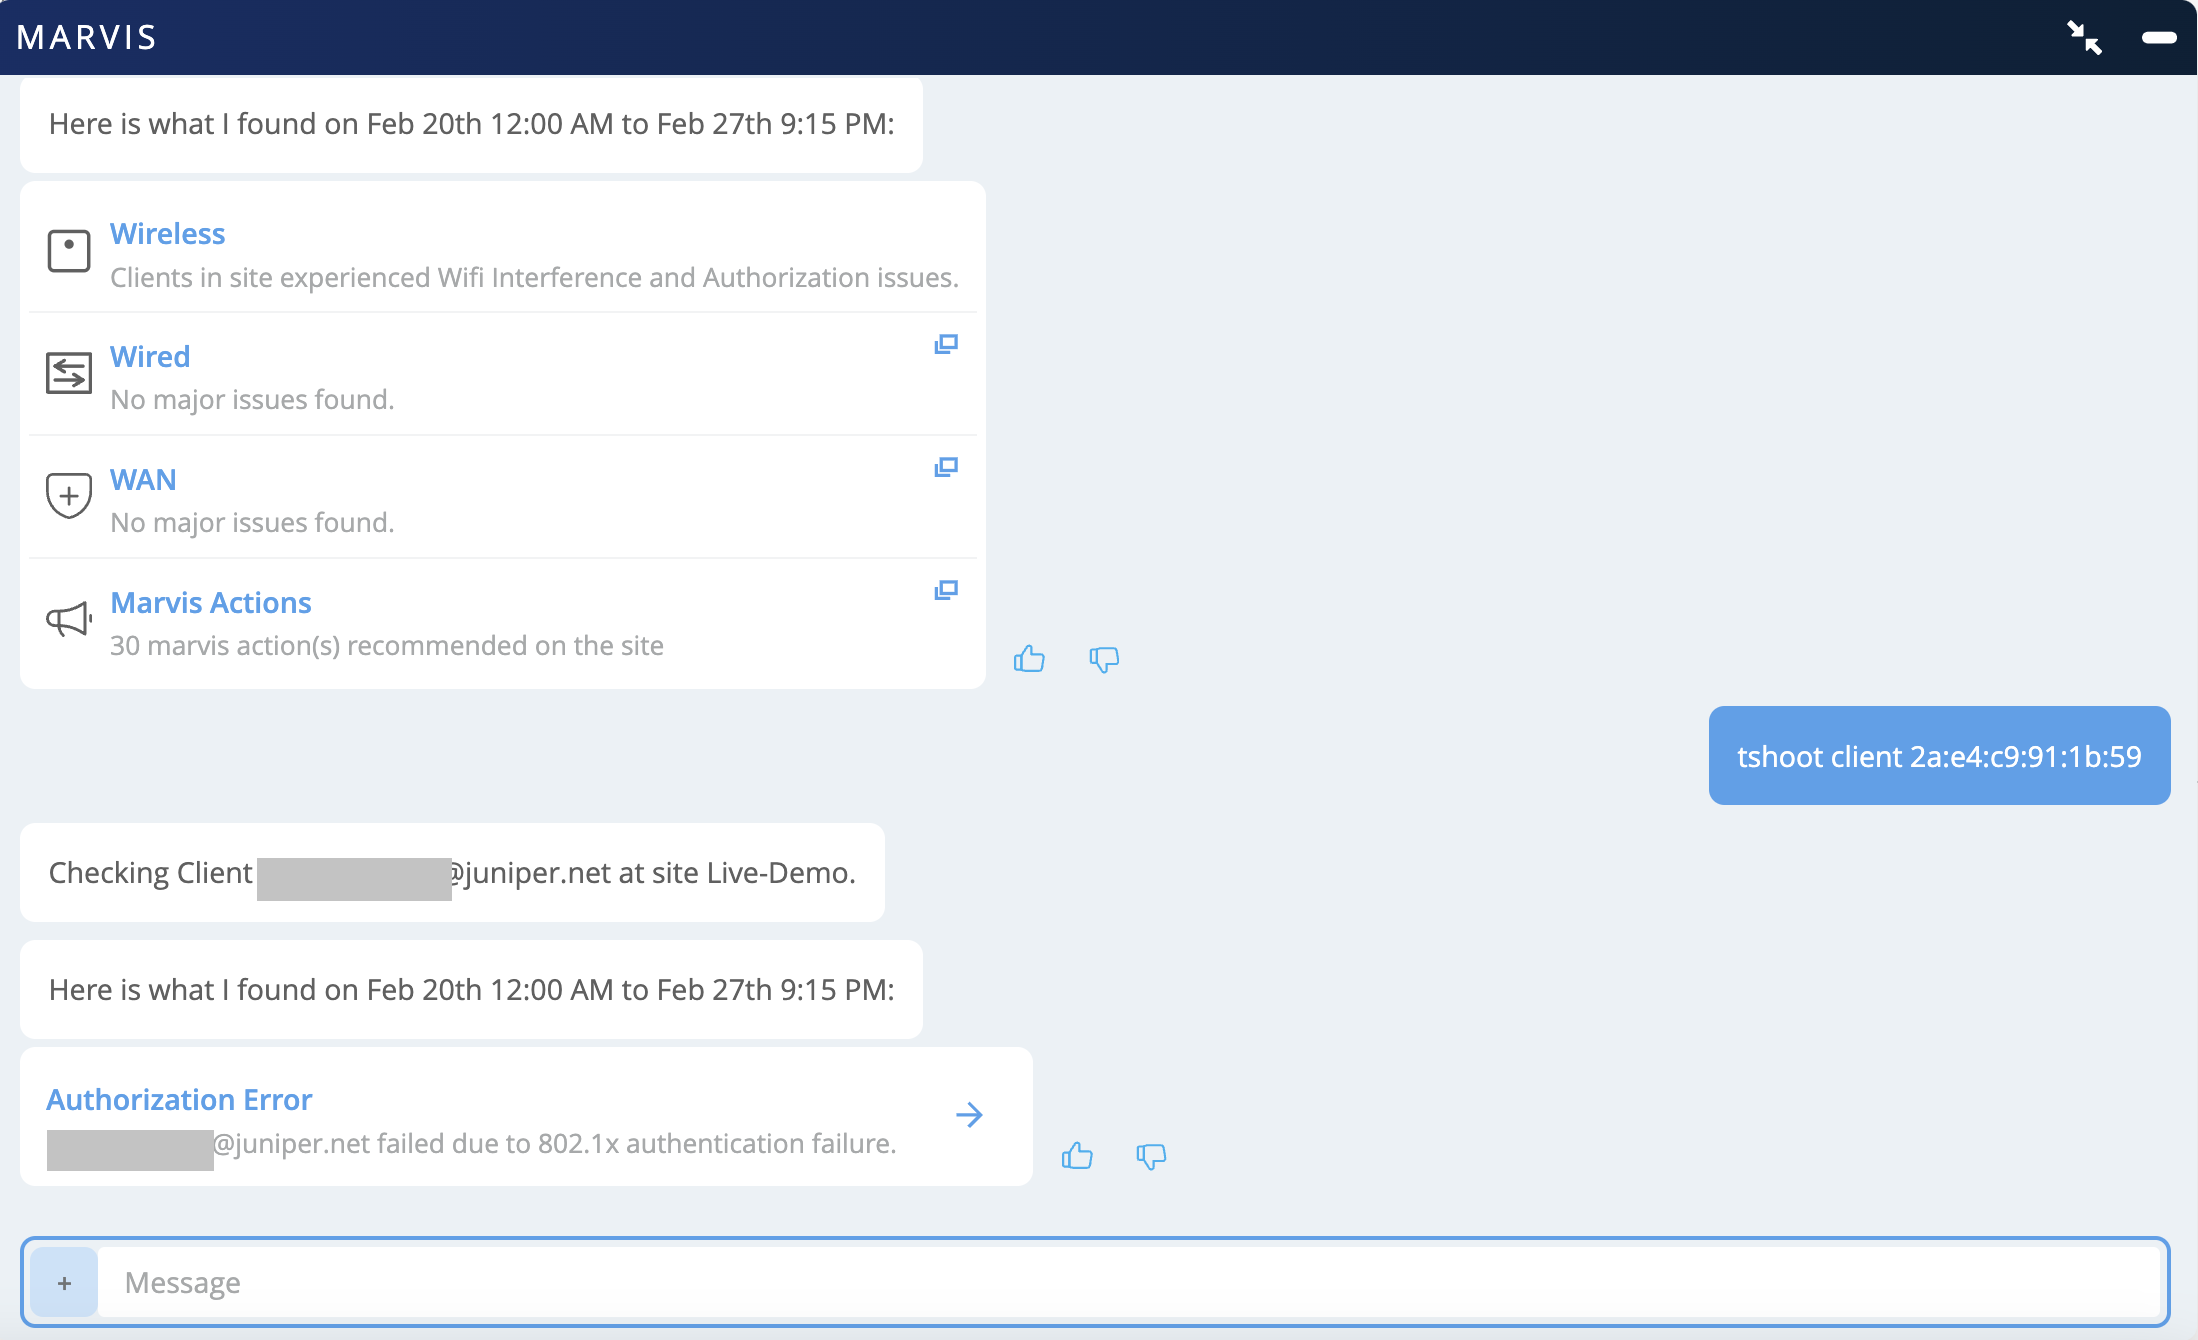
    Troubleshooting interface from Marvis showing network diagnostics. Summary includes WiFi interference and authorization issues, 30 recommended actions, and an 802.1x authentication failure for a specific client. Feedback options available.

  2. 認証 エラー をクリックすると、詳細が表示されます。この例では、クライアントが100%の確率で認証エラーに直面したことをMarvisが報告していることがわかります。
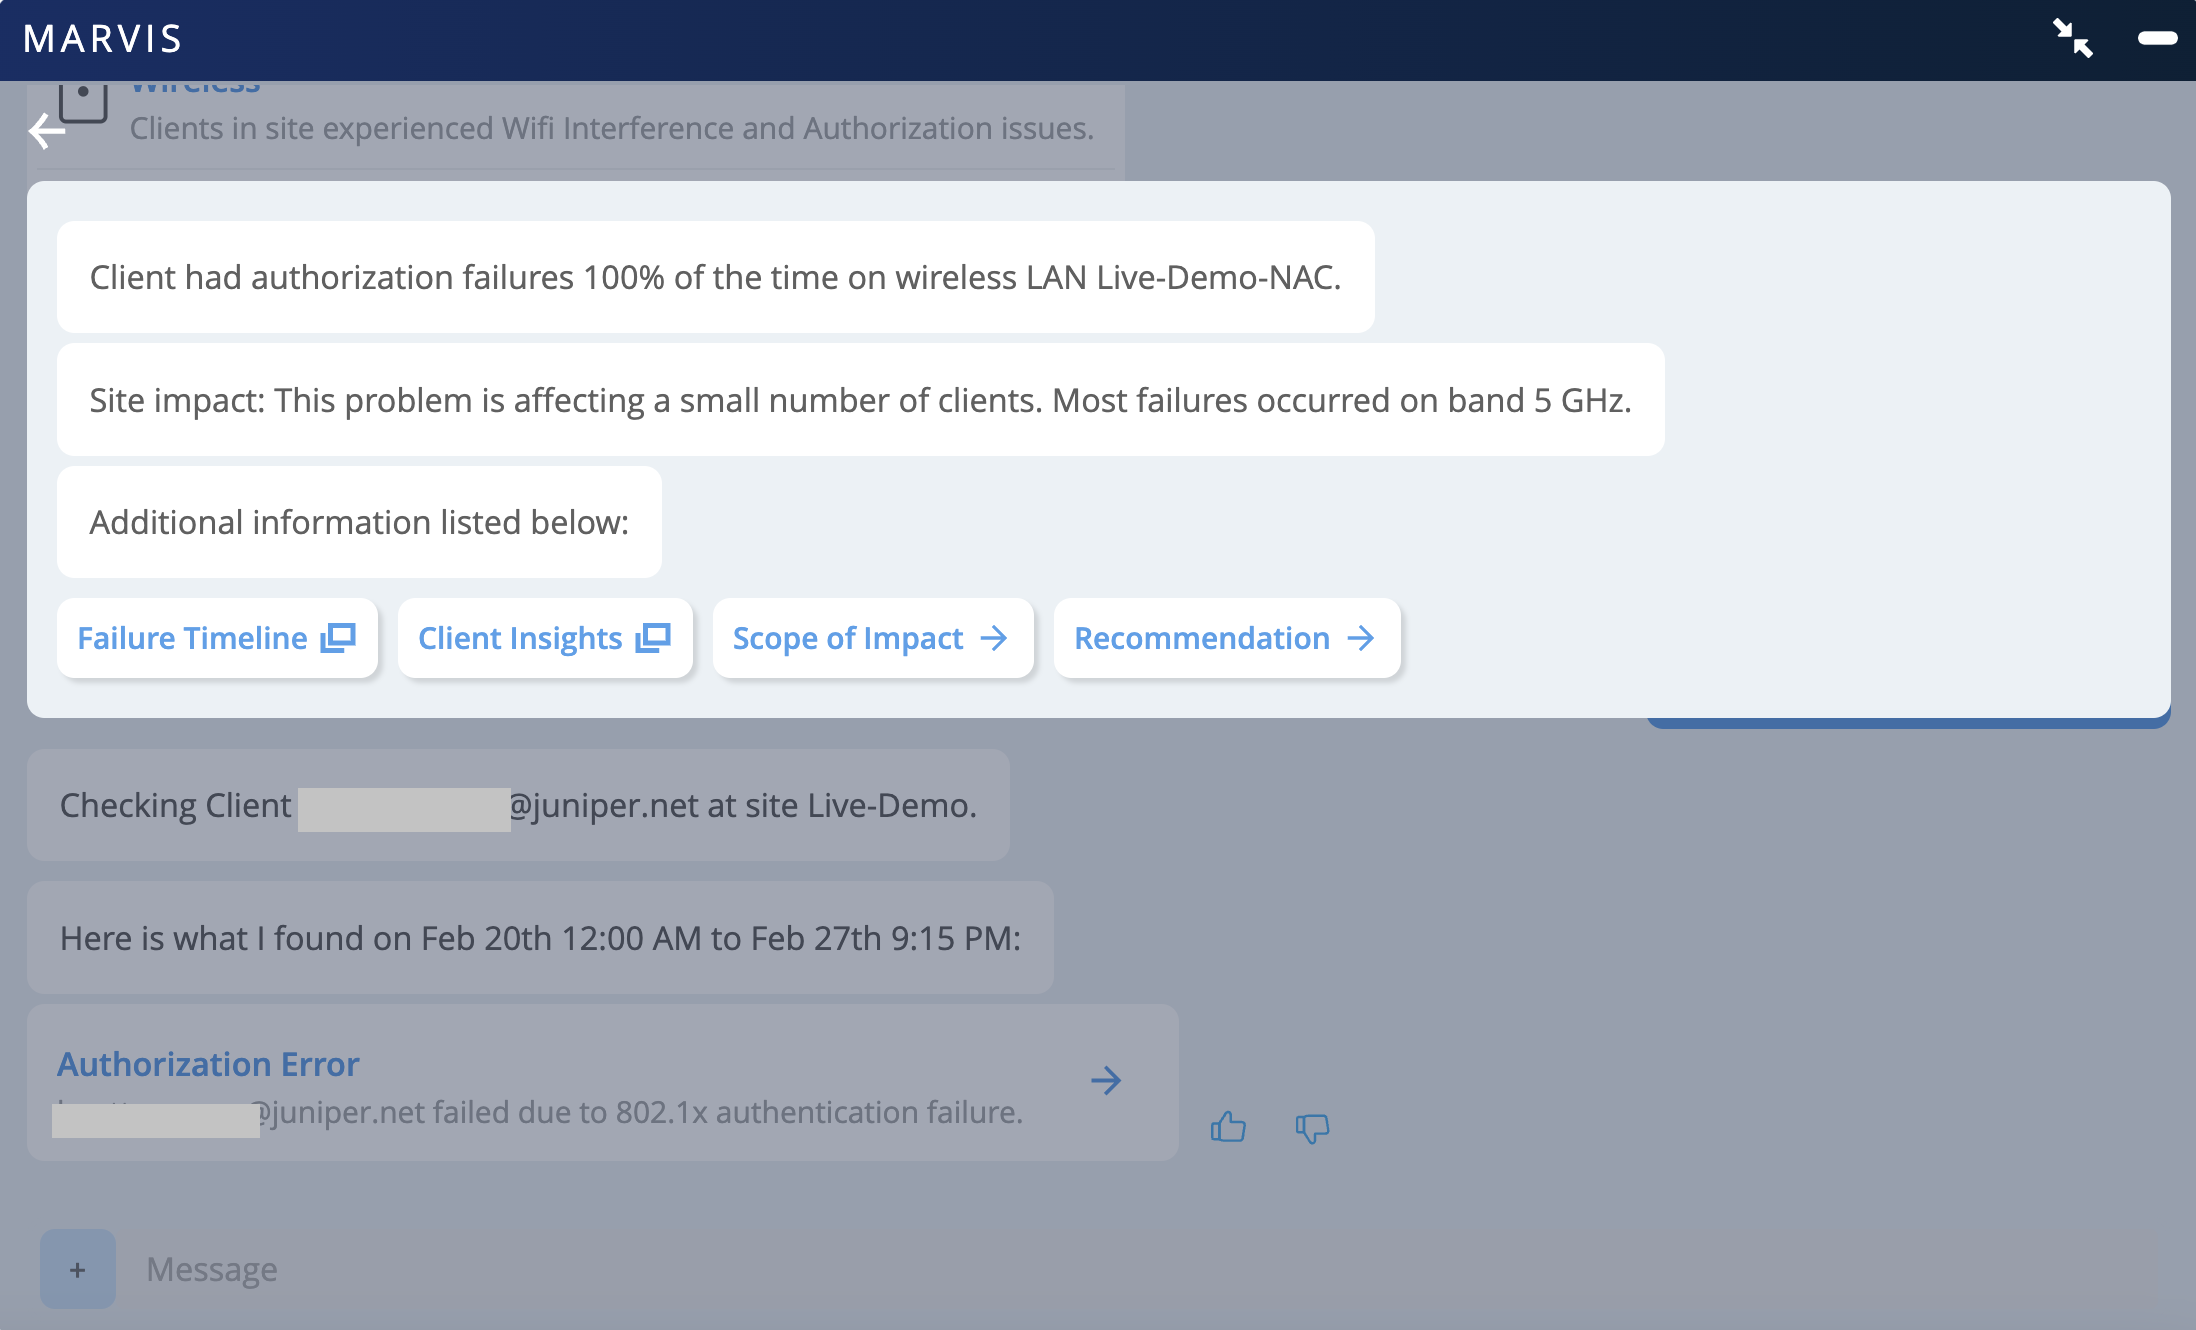
    Client experiencing 100 percent authorization failures on wireless LAN Live-Demo-NAC due to 802.1x authentication issues from Feb 20th to Feb 27th. Most failures occurred on the 5 GHz band. Options for further investigation include Failure Timeline, Client Insights, Scope of Impact, and Recommendation.

    Marvisは、Marvis Actionsページの接続カテゴリでもこの問題を報告します。

クライアント固有の問題を調査しているので、[ クライアントインサイト]をクリックします。クライアントイベントセクションには、クライアントに関連するすべてのイベントが一覧表示されます。認証失敗イベントをクリックすると、失敗の理由を確認できます。
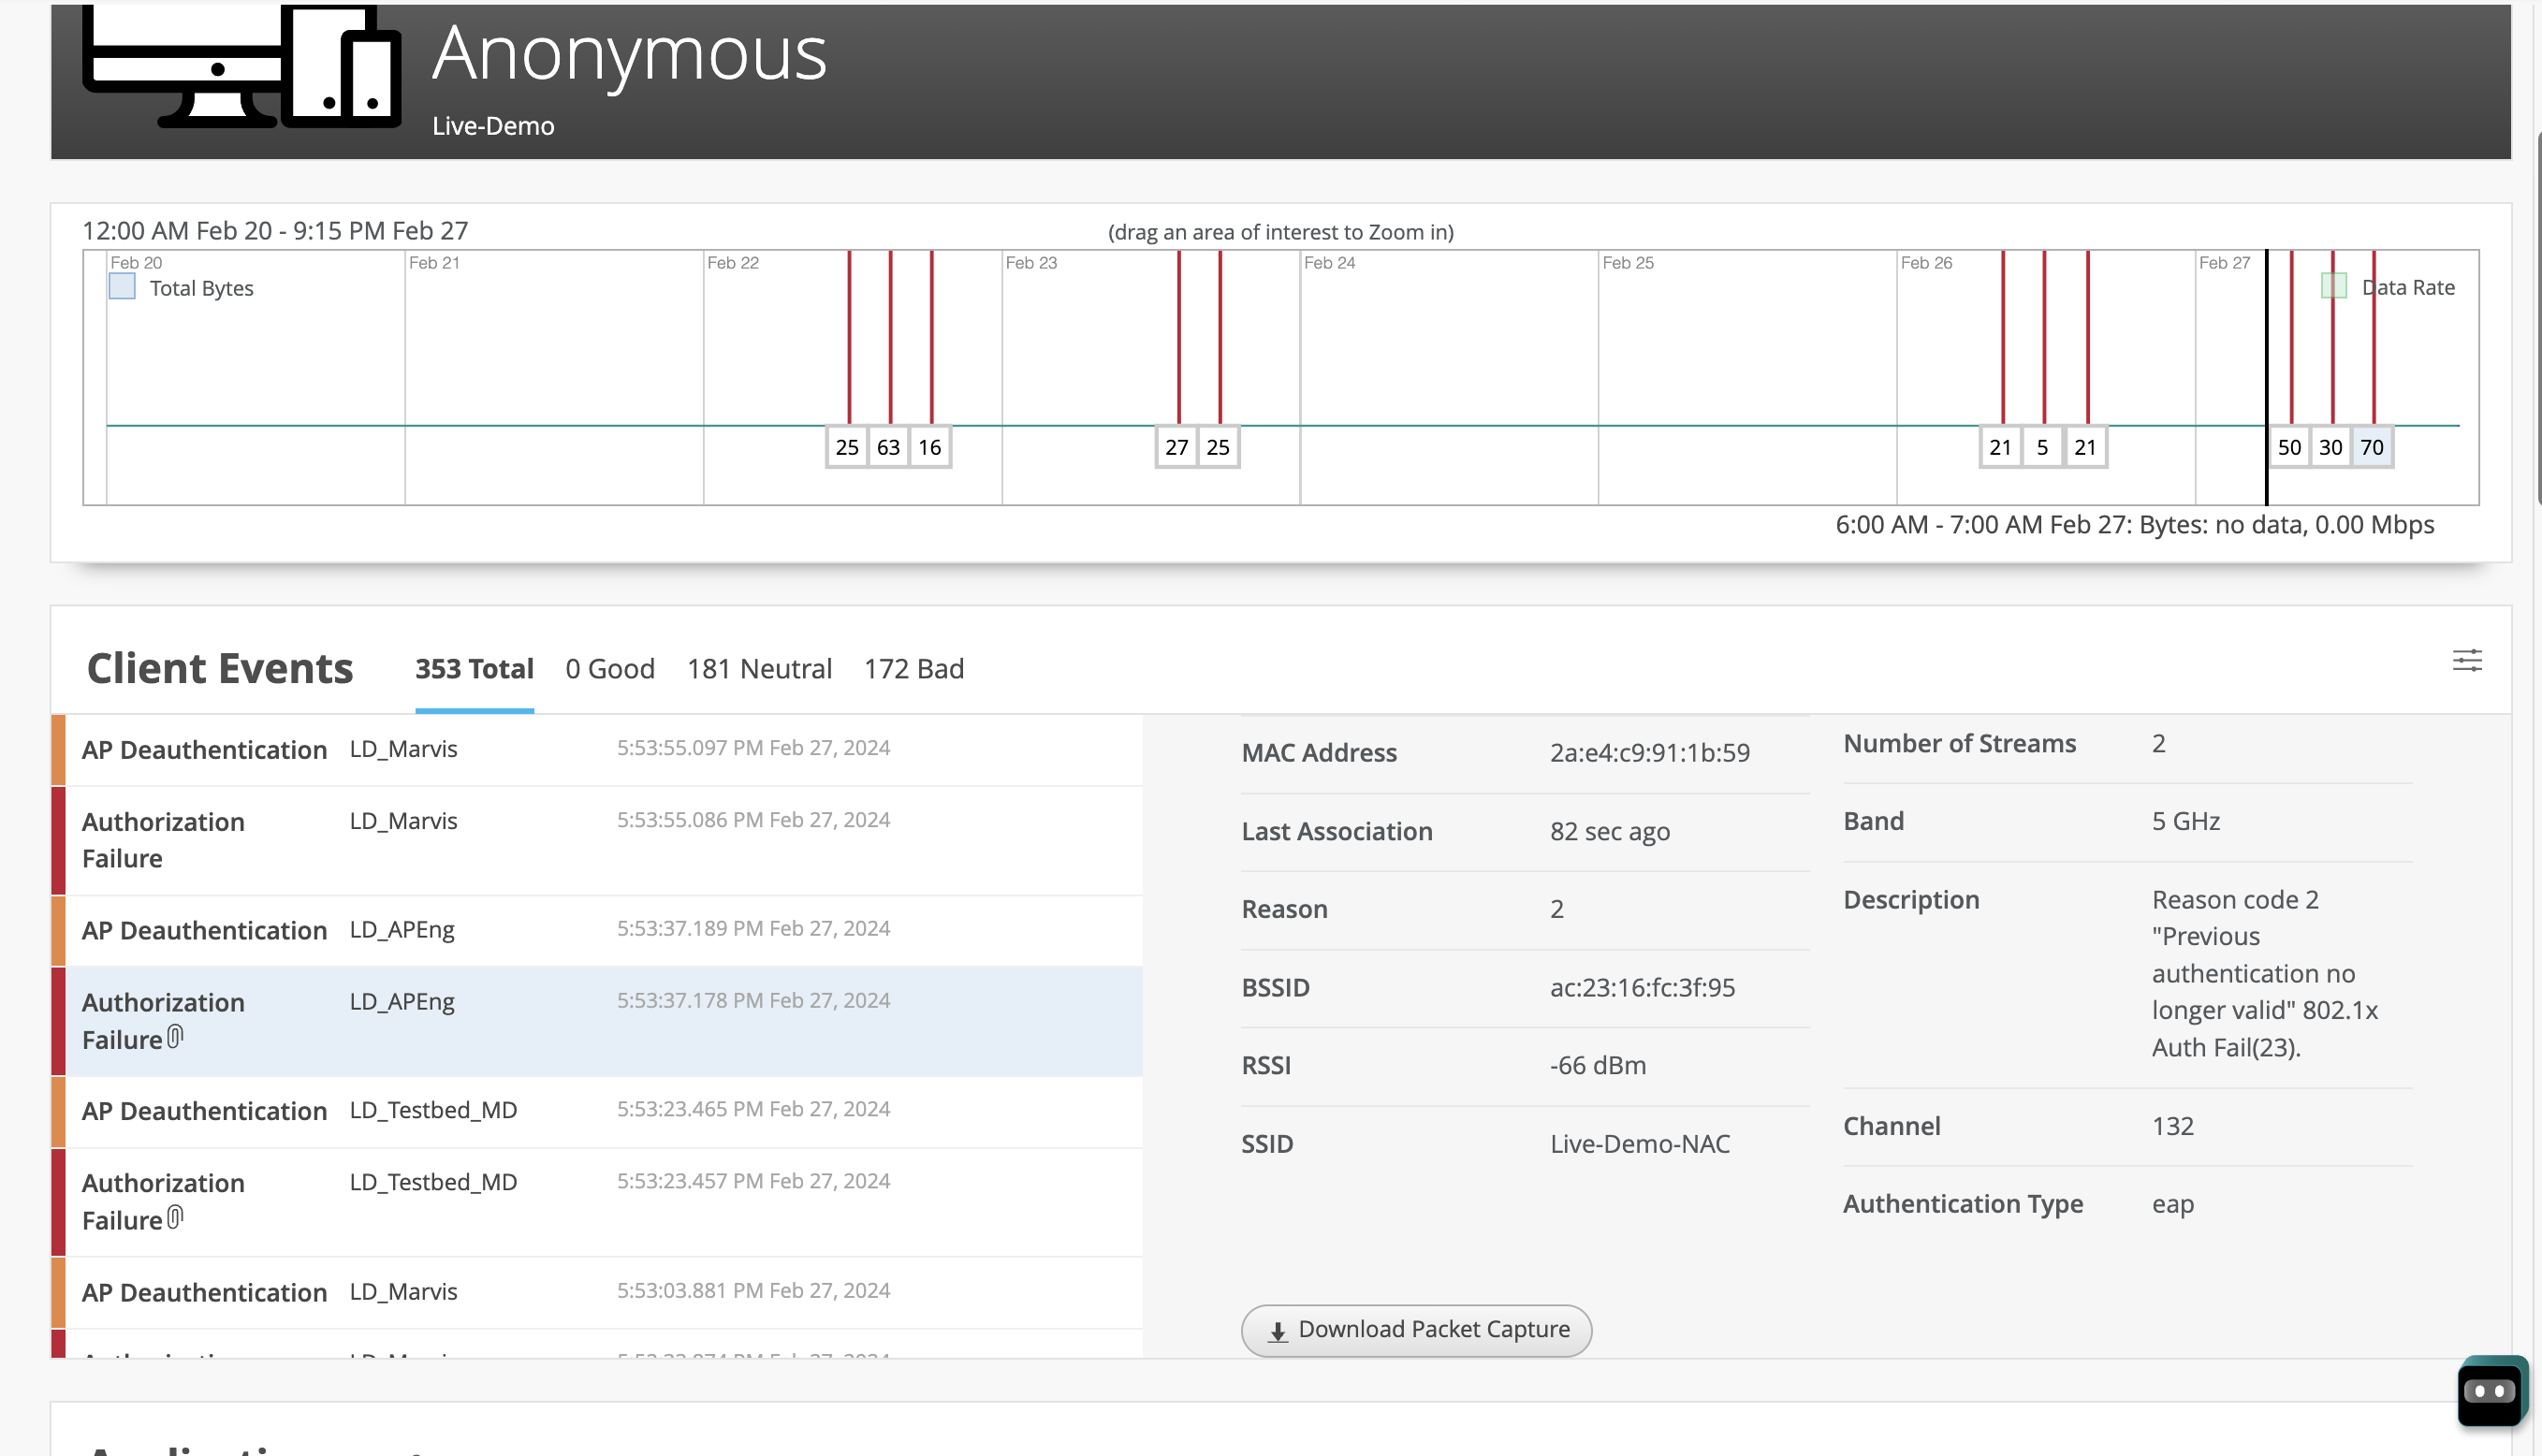
Network monitoring dashboard showing data usage graph from February 20 to 27, client events like AP Deauthentication, client details including MAC Address and RSSI, and a download packet capture button.

認証失敗のパケットキャプチャをダウンロードすることもできます。これはサンプルパケットキャプチャです。クライアントがID要求に応答せず、クライアントID応答を提供せずに接続を繰り返し試みていることがわかります。
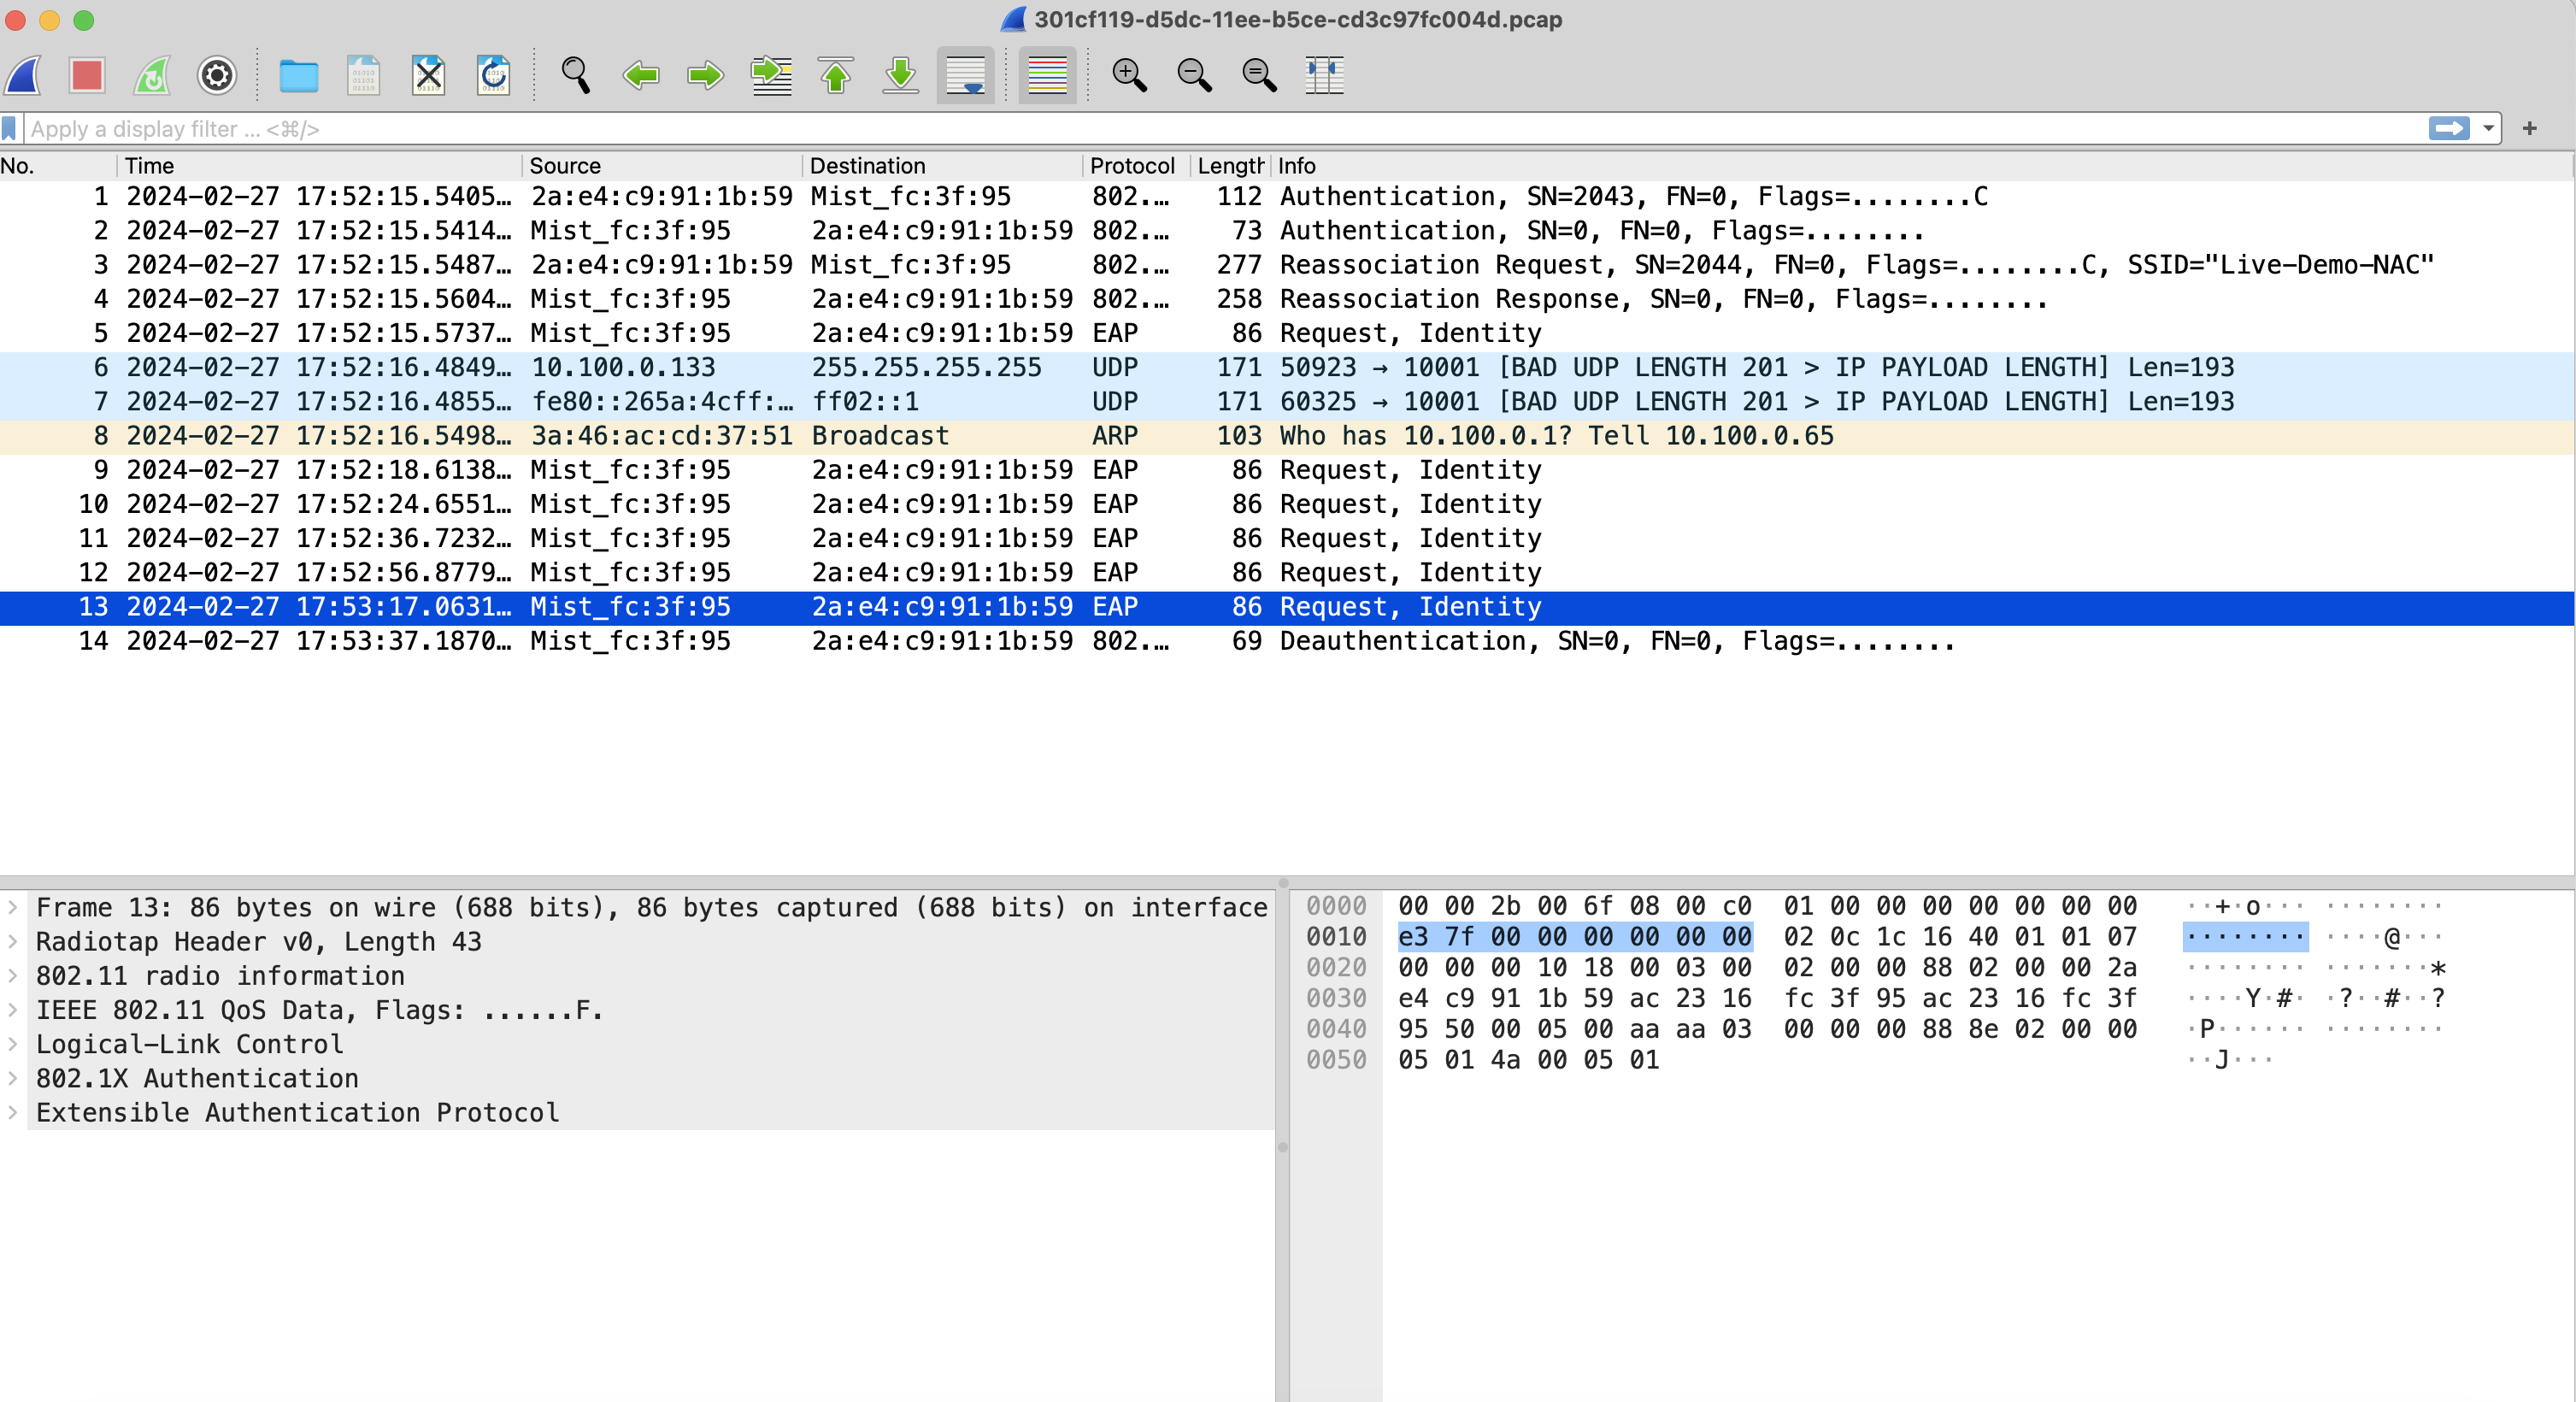
Wireshark interface analyzing network packet capture with highlighted EAP Request Identity message, showing packet list, details, and raw data bytes.

DHCPの問題のトラブルシューティング

ダイナミックホスト構成プロトコル(DHCP)サーバーからの応答がないために、クライアントがIPアドレスを取得できないと、接続の問題に直面する可能性があります。

DHCPの問題をトラブルシューティングするには:

  1. Marvis対話型アシスタントウィンドウで、 tshoot client の後にクライアントのMACアドレス名またはホスト名を入力します。次の例では、Marvisがネットワーク内のDHCPの問題を検出していることがわかります。
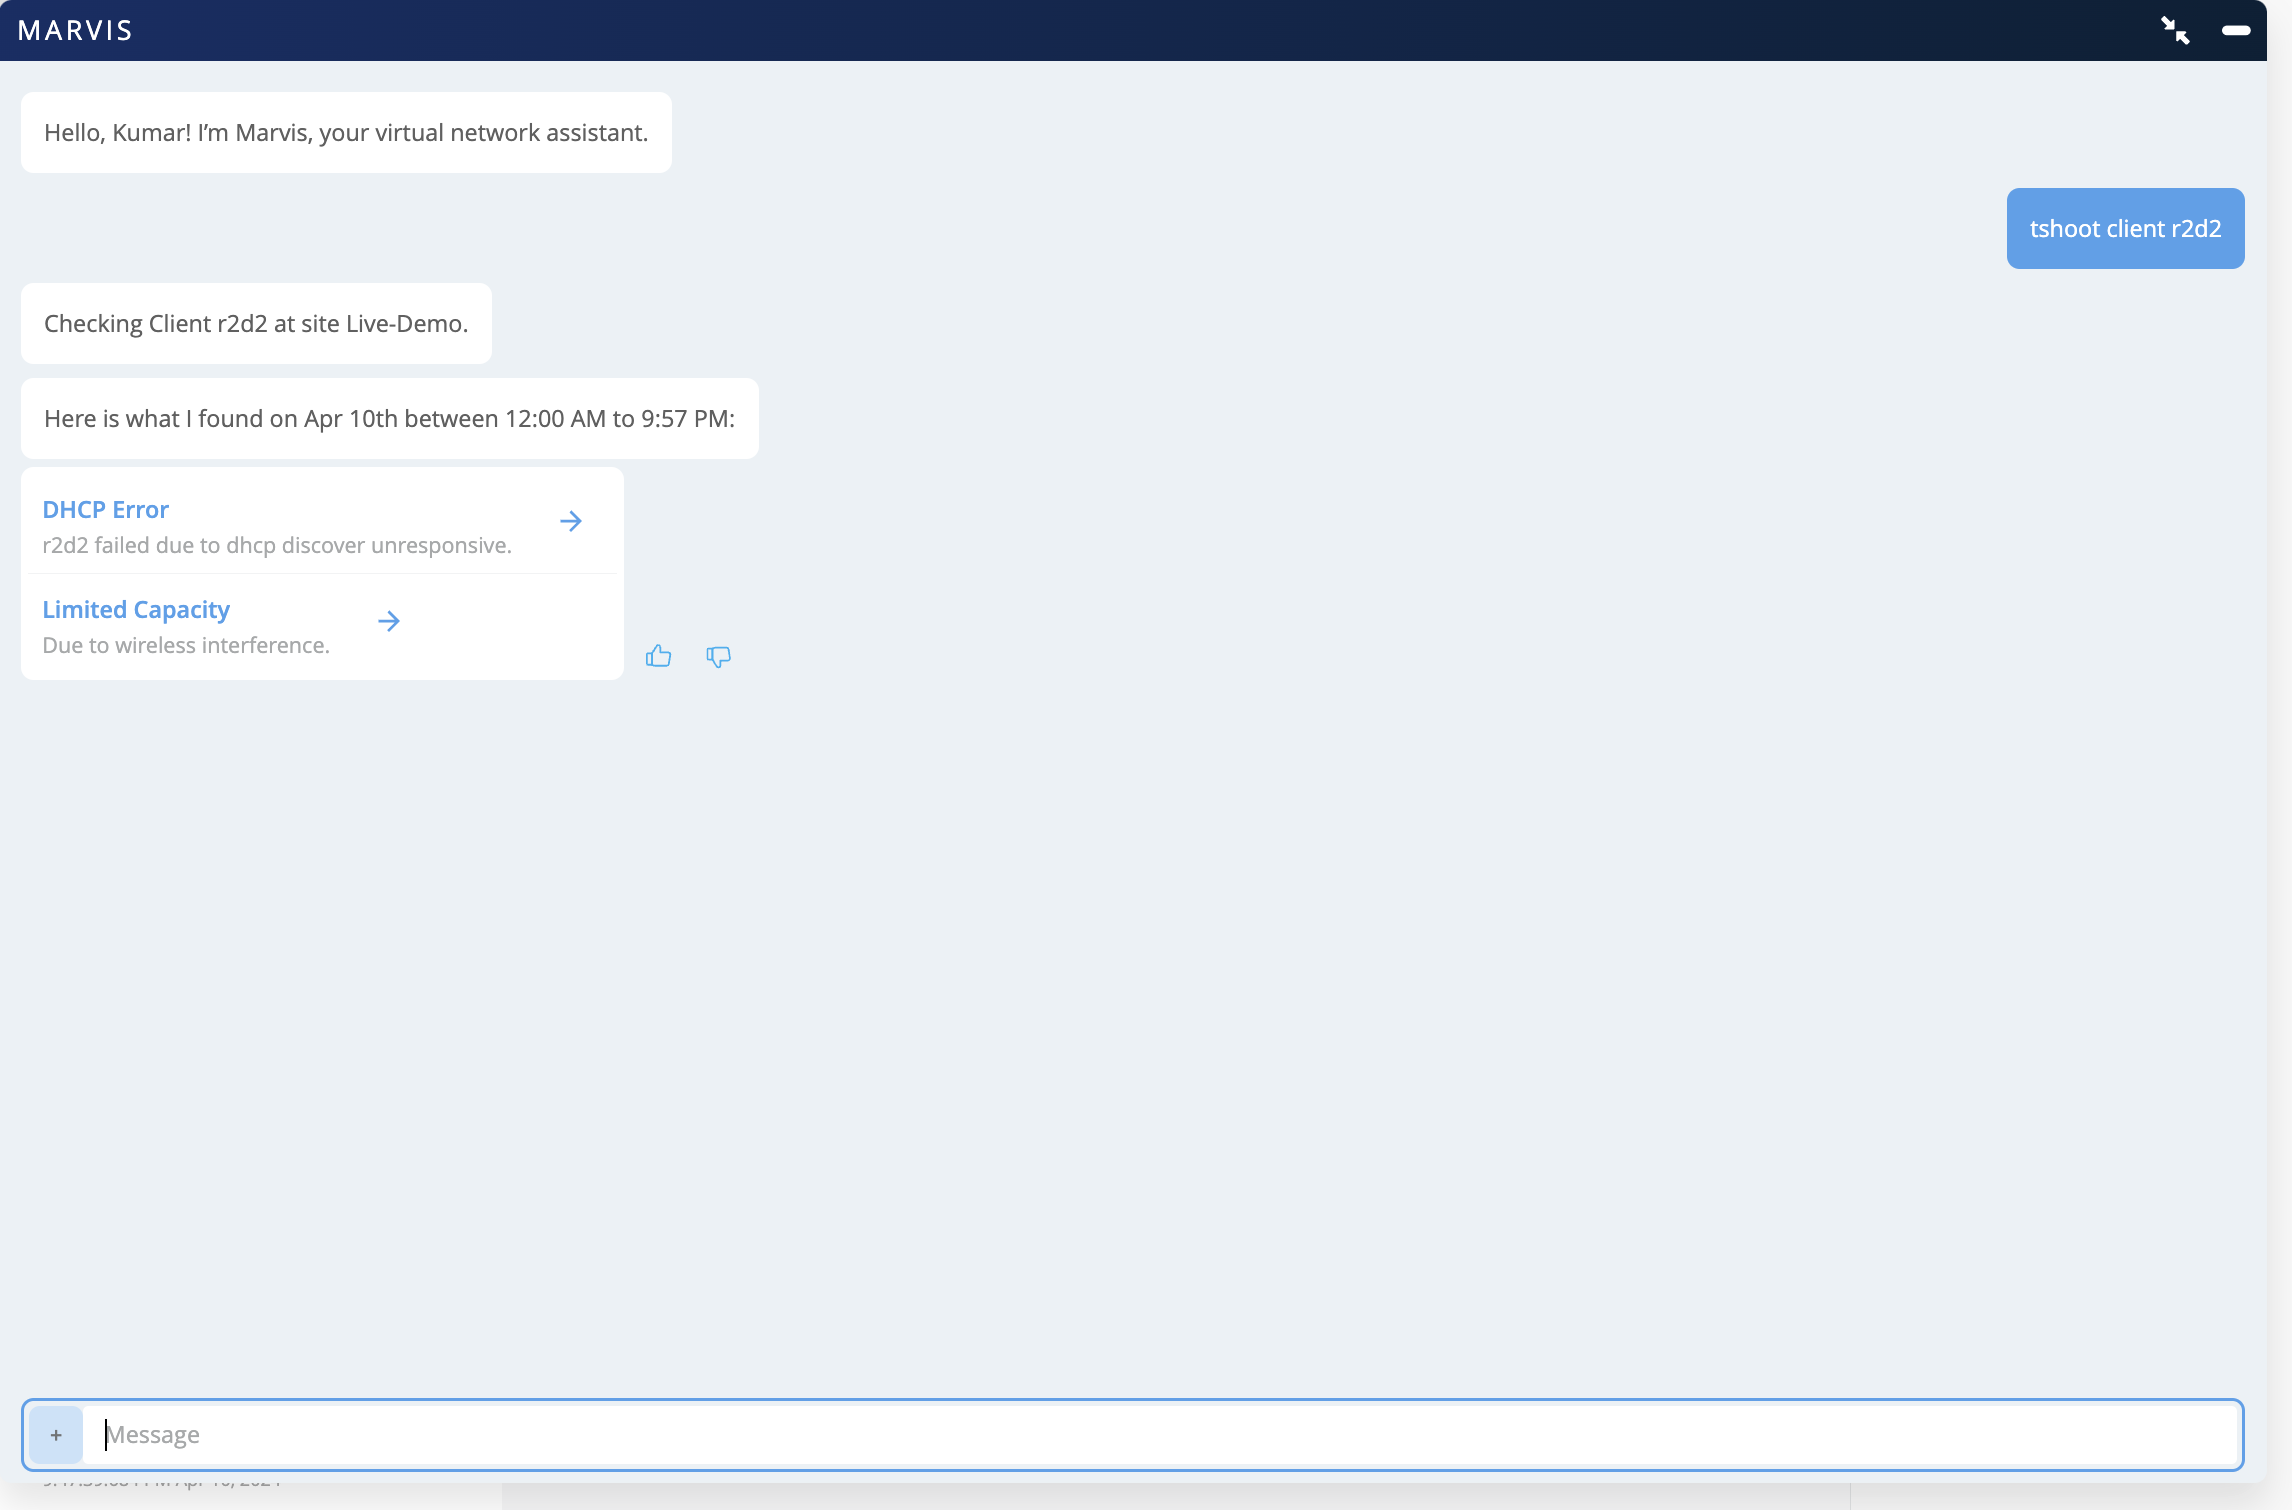
    Virtual network assistant Marvis troubleshooting client r2d2 for April 10th, highlighting DHCP discover unresponsive and wireless interference issues. Links for details and feedback options available.

  2. 詳細を表示するには、 DHCPエラー をクリックします。次の例では、特定のクライアントが100%の確率でDHCP障害に直面していることをMarvisが報告していることがわかります。
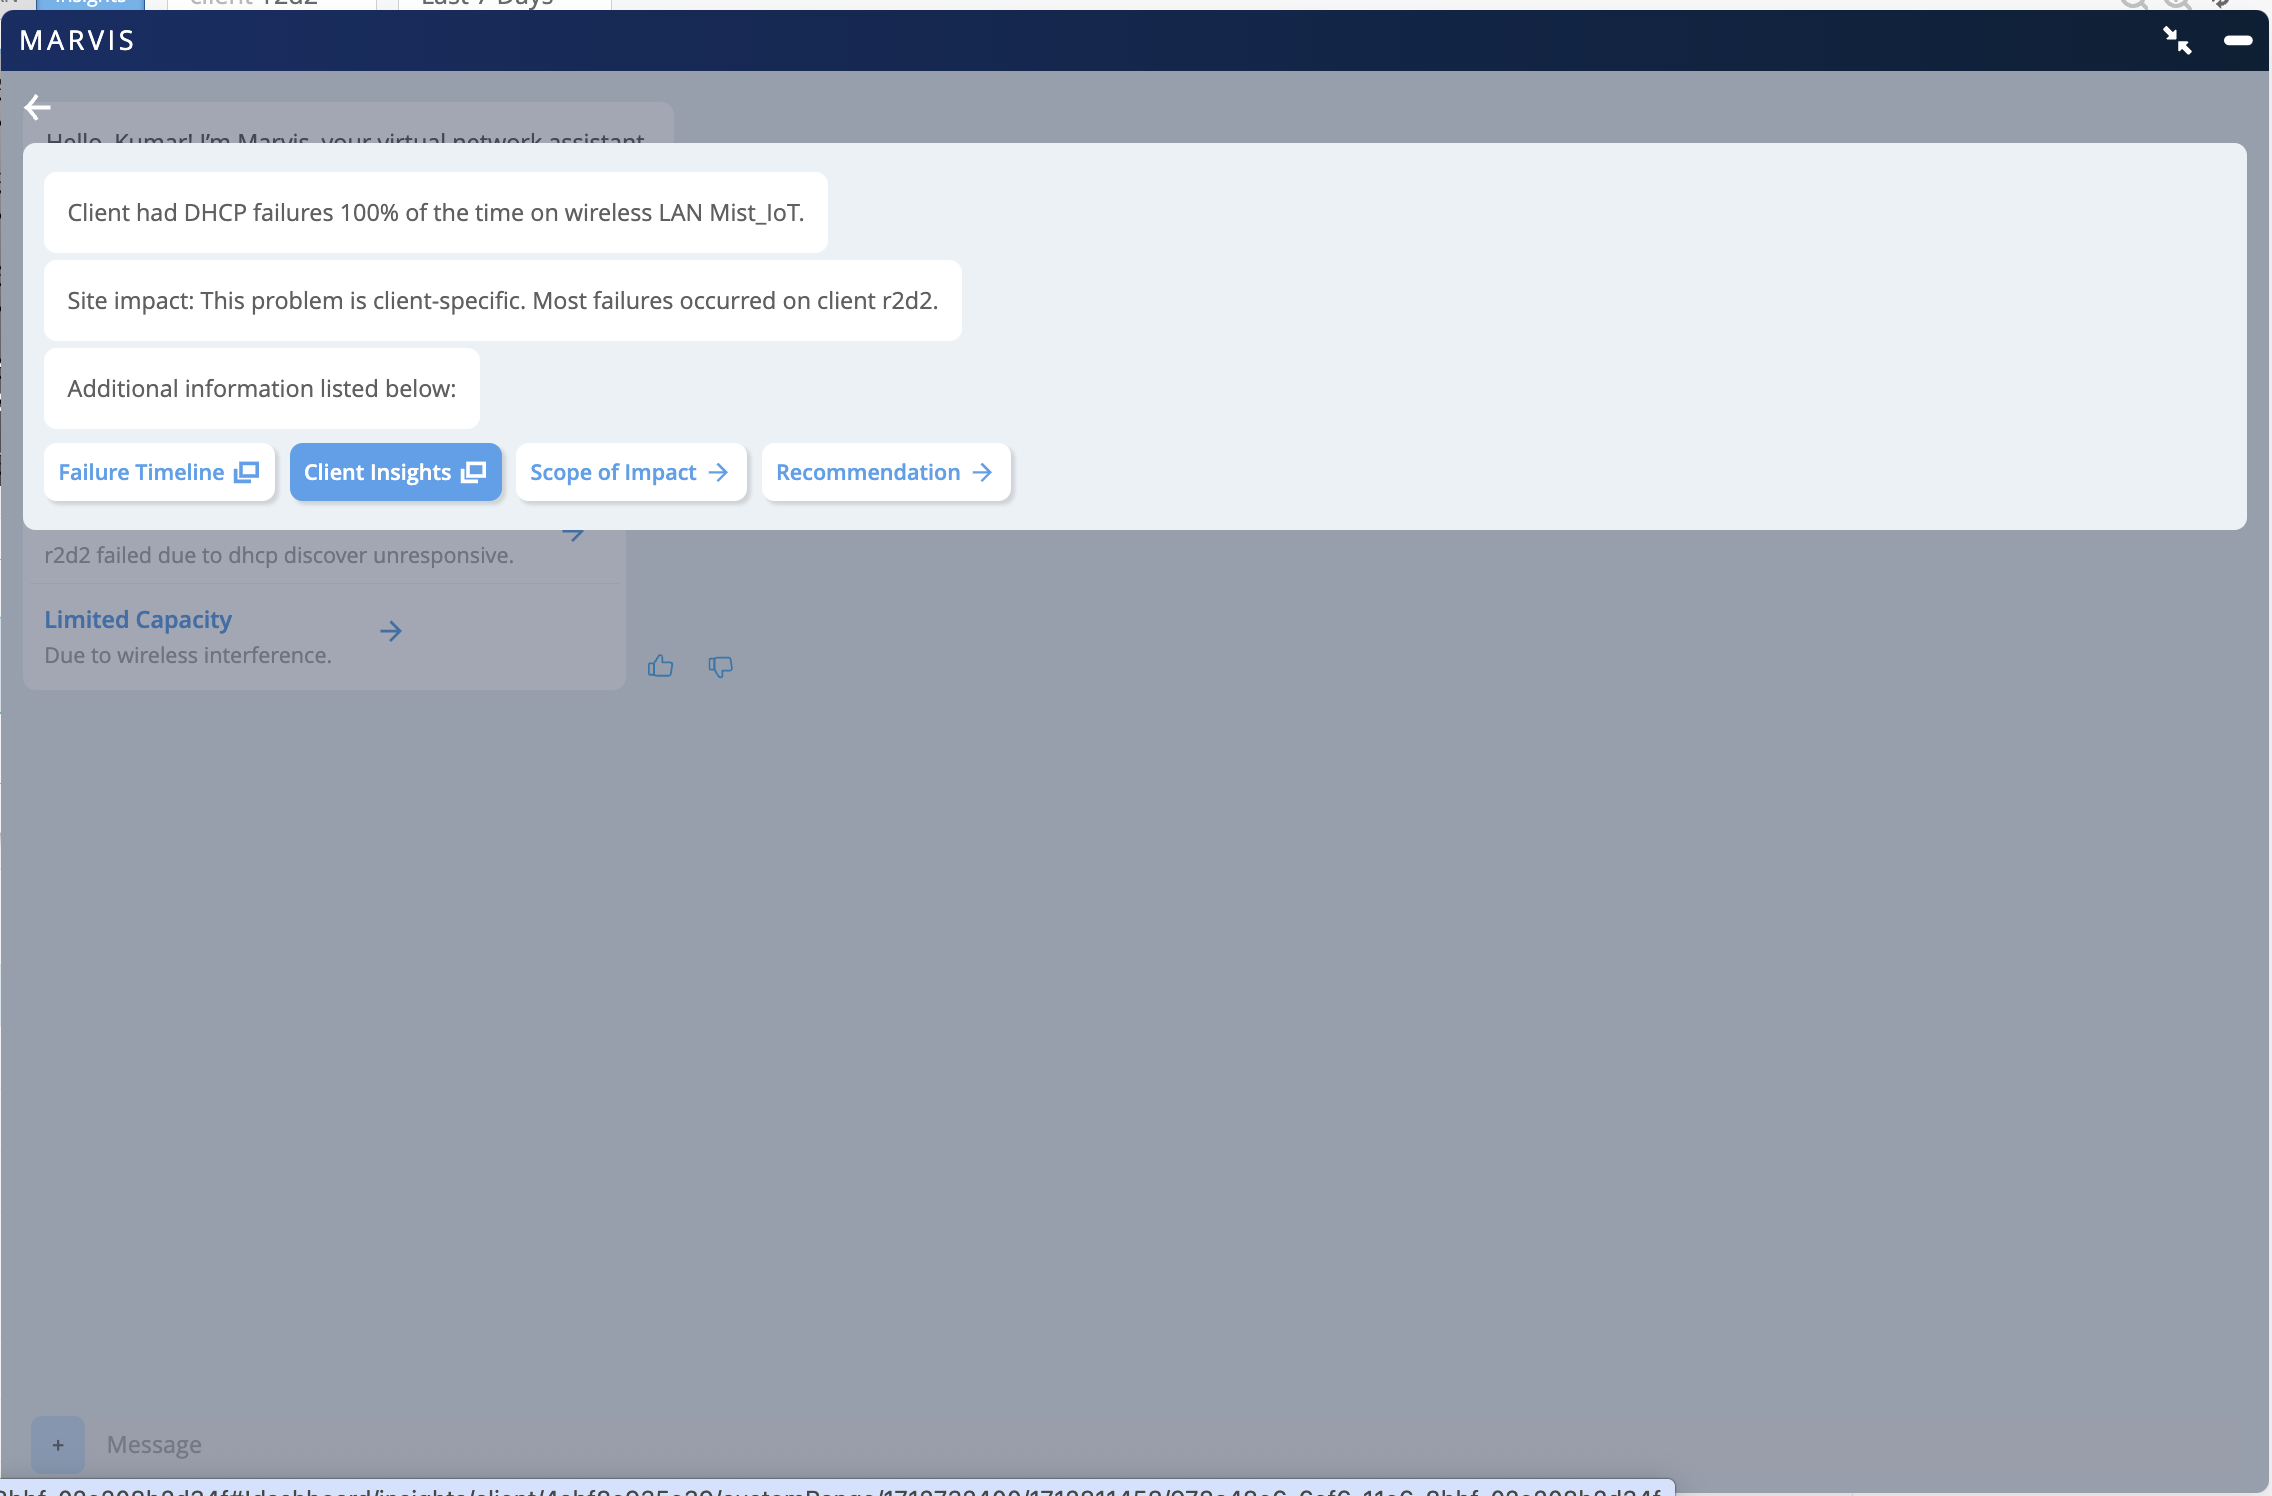
    Network troubleshooting interface from Marvis showing DHCP failures 100 percent on Mist_IoT wireless LAN for client r2d2. Options include Failure Timeline, Client Insights, Scope of Impact, and Recommendation.

表示されたオプションを使用して、さらに調査できます。

影響の範囲

まず、成功した接続試行と失敗した接続試行をリストした影響の範囲を確認することができます。右側のドロップダウンリストを使用して、クライアントが1つのWLAN/APまたは複数のWLAN/APで障害が発生しているかどうかを確認できます。
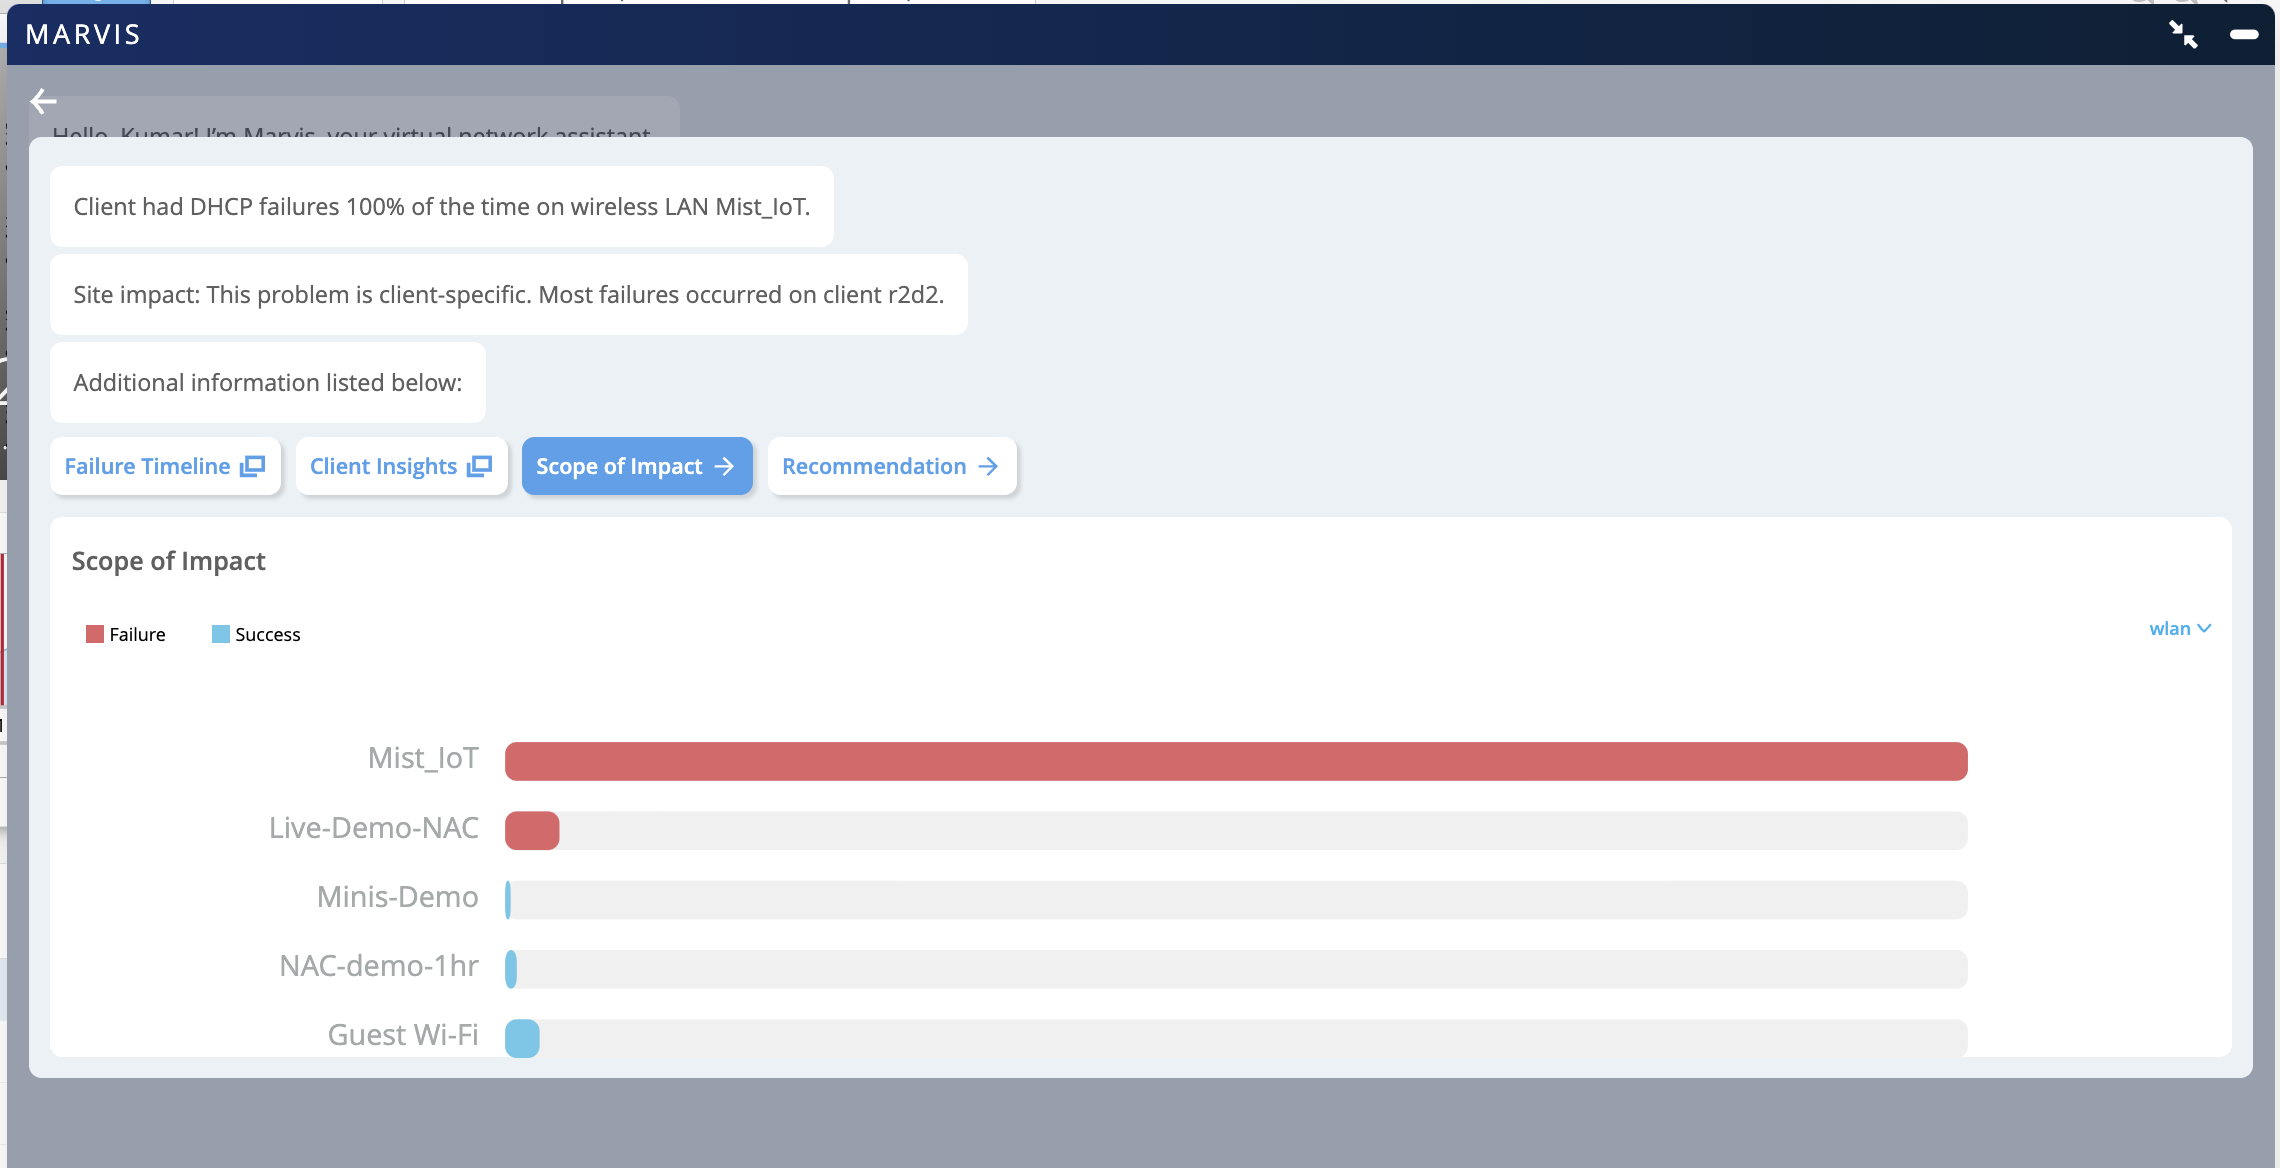
Network troubleshooting interface showing diagnostic details of DHCP failures on Mist_IoT wireless LAN. Tabs include Failure Timeline, Client Insights, Scope of Impact, and Recommendation. Scope of Impact bar chart highlights total failure on Mist_IoT network and partial successes on other networks like Live-Demo-NAC and Guest Wi-Fi.

クライアントインサイト

また、クライアントインサイトをクリックして、すべてのクライアント関連イベントを表示することもできます。DHCP タイムアウトイベントをクリックすると、DHCP リクエストが失敗している DHCP サーバーの詳細を表示できます。
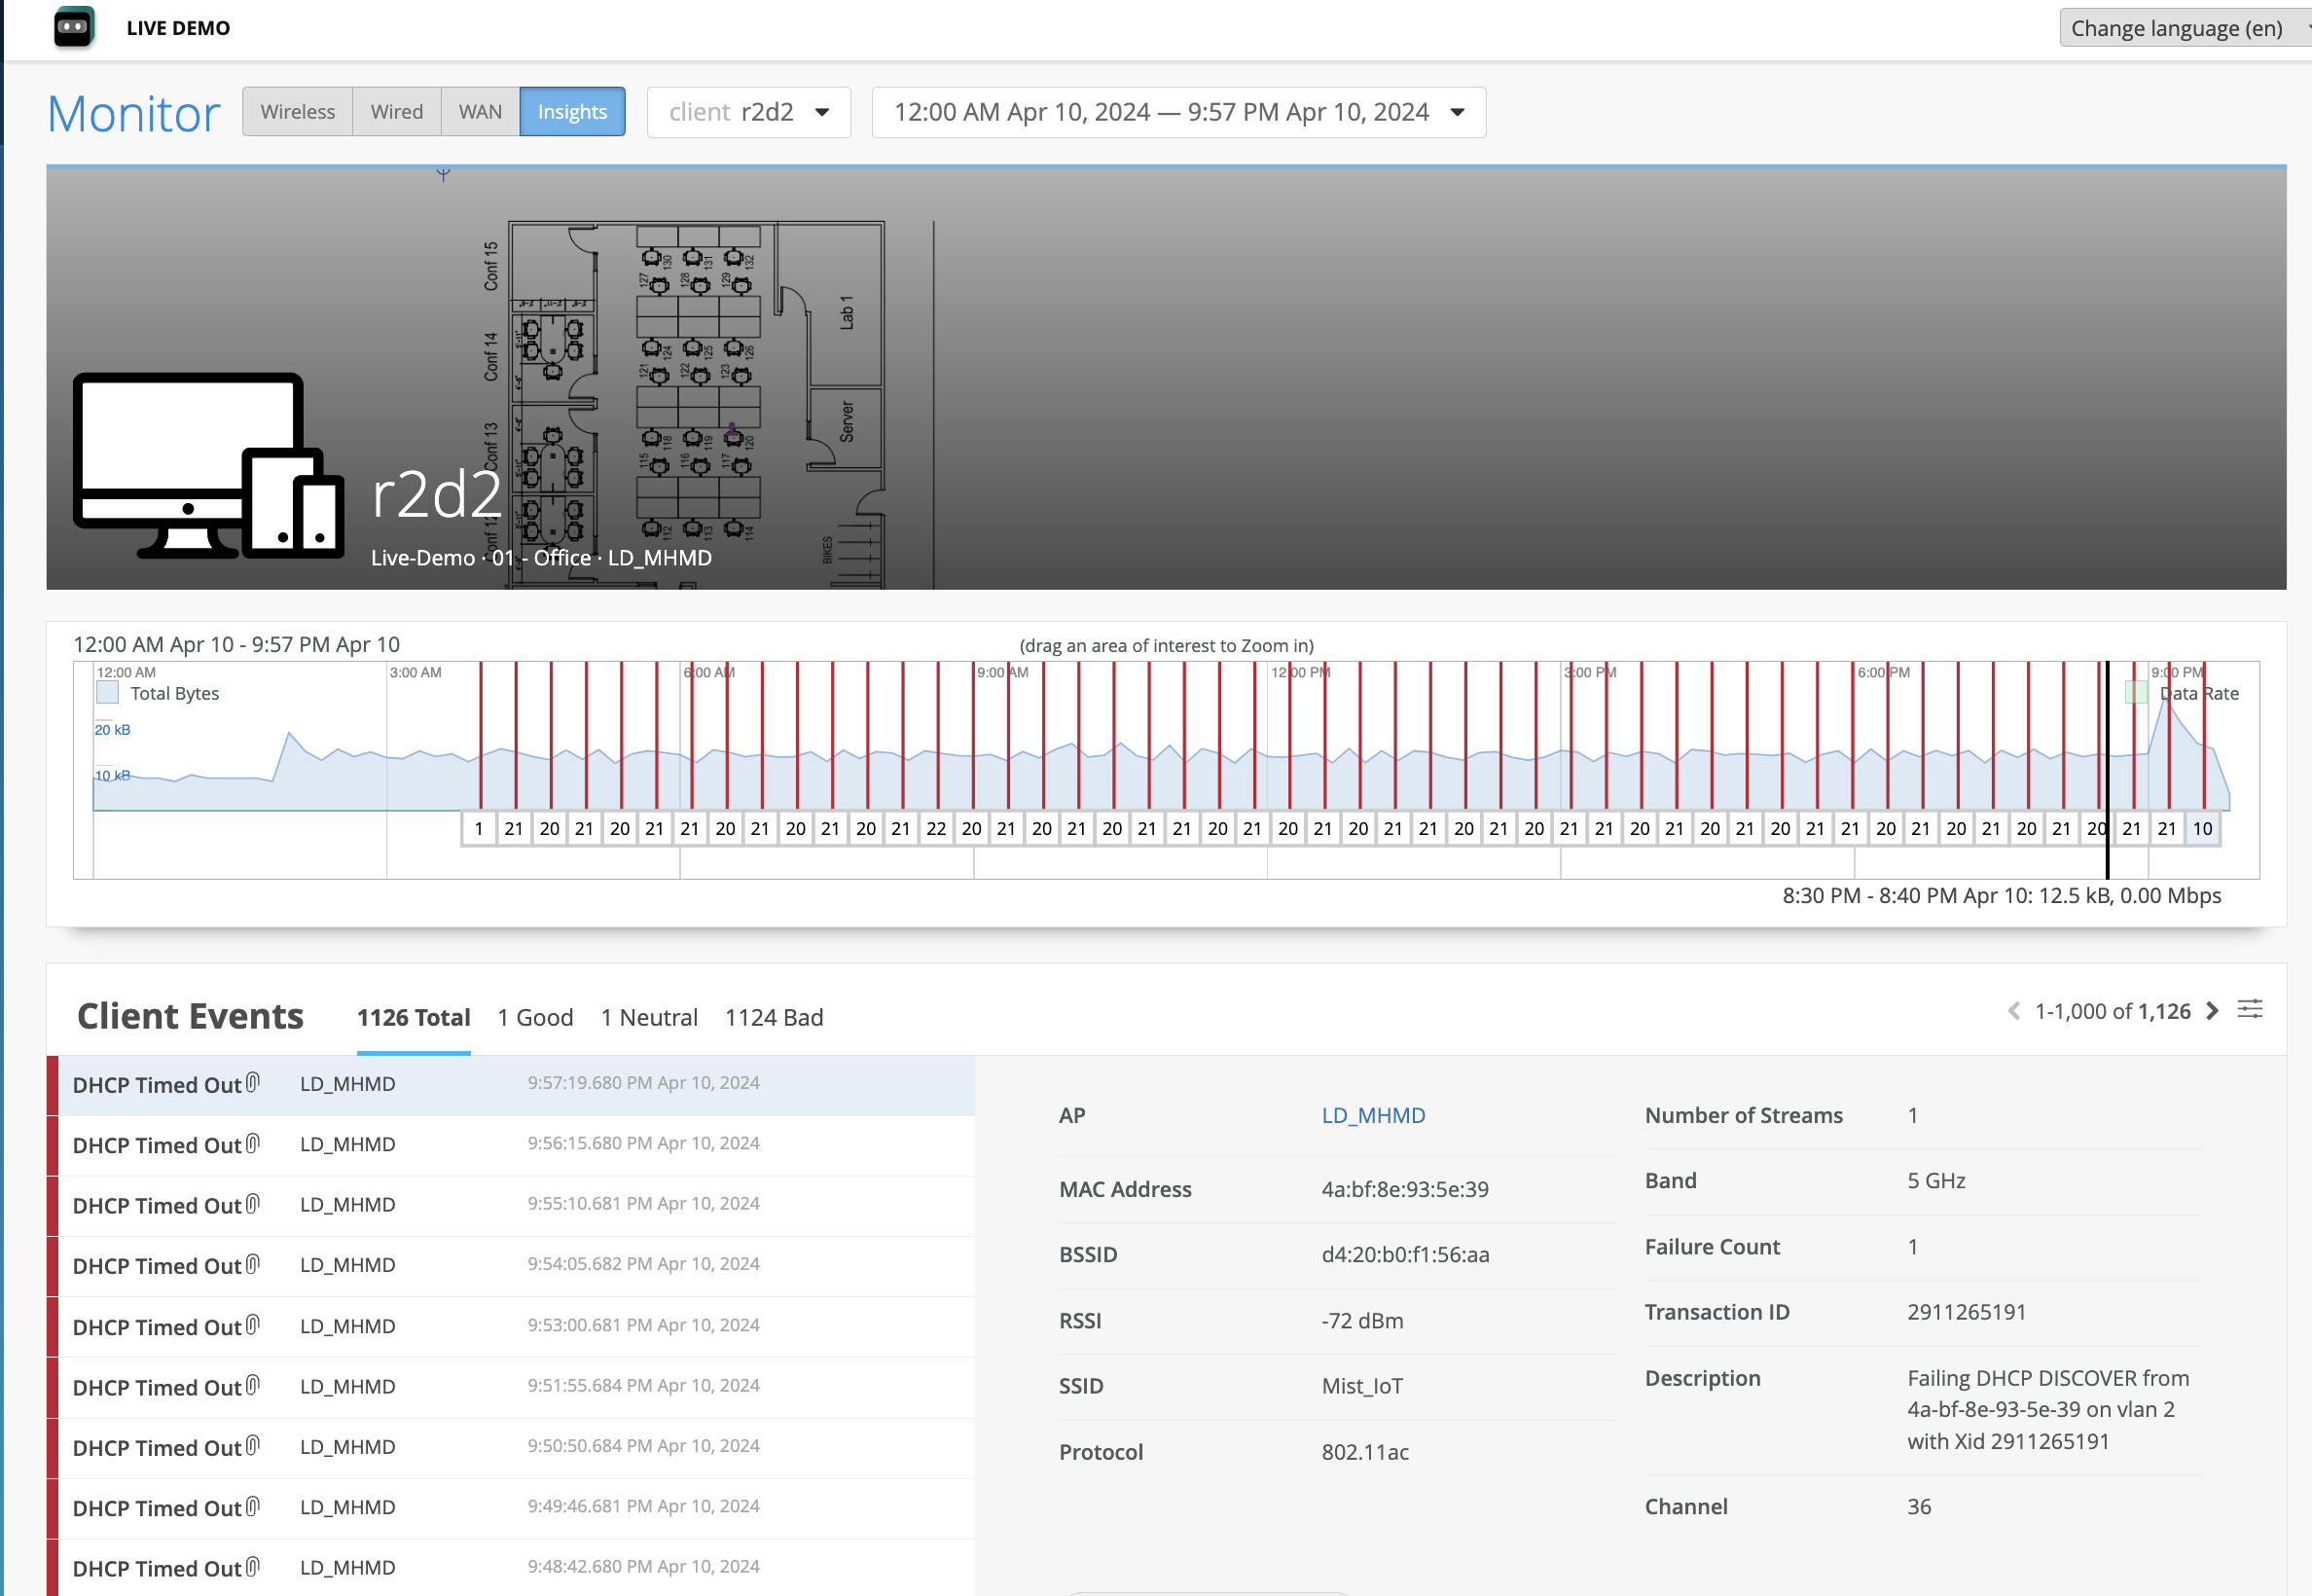
Network monitoring dashboard showing device r2d2 data usage graph, DHCP timed-out events, and technical details like MAC address, RSSI, and SSID.

特定のイベントのダイナミックパケットキャプチャをダウンロードできます。これは、DHCP タイムアウト イベントが発生したクライアントのパケット キャプチャの例です。
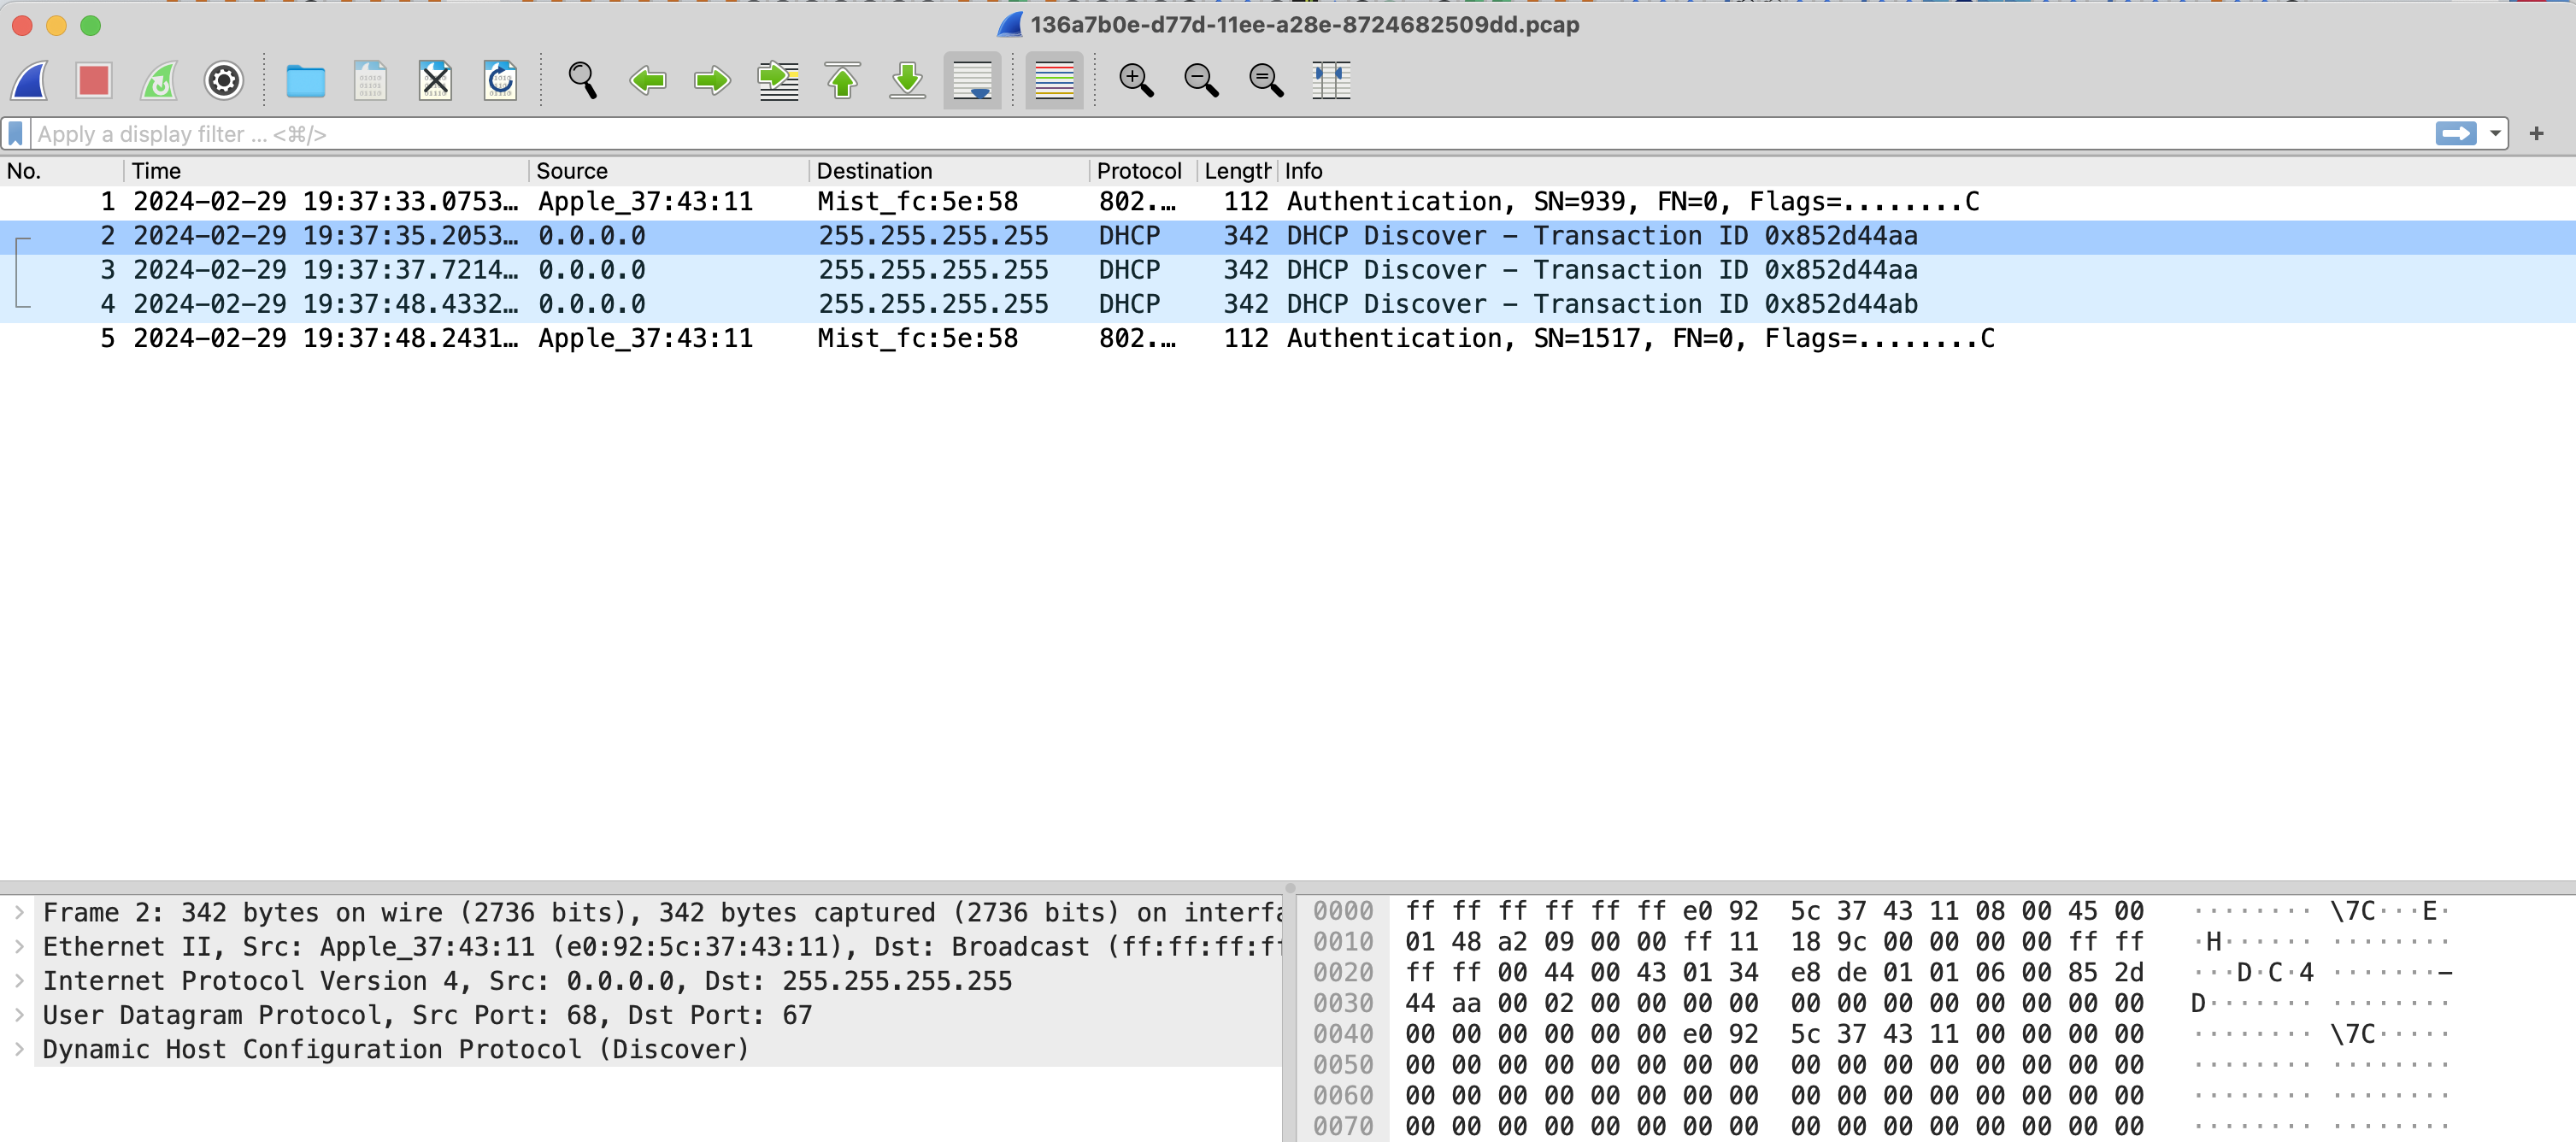
Screenshot of a Wireshark network packet capture showing DHCP Discover packets with source 0.0.0.0 and destination 255.255.255.255, detailed protocol layers, and raw packet data.

PSKの障害のトラブルシューティング

Marvisは、多数のクライアントがPSK WLANへの認証に失敗した場合、事前共有キー(PSK)の障害を検出します。この問題の考えられる原因は、ユーザーに通知されなかった最近のPSKの変更である可能性があります。

PSK の障害をトラブルシューティングするには:

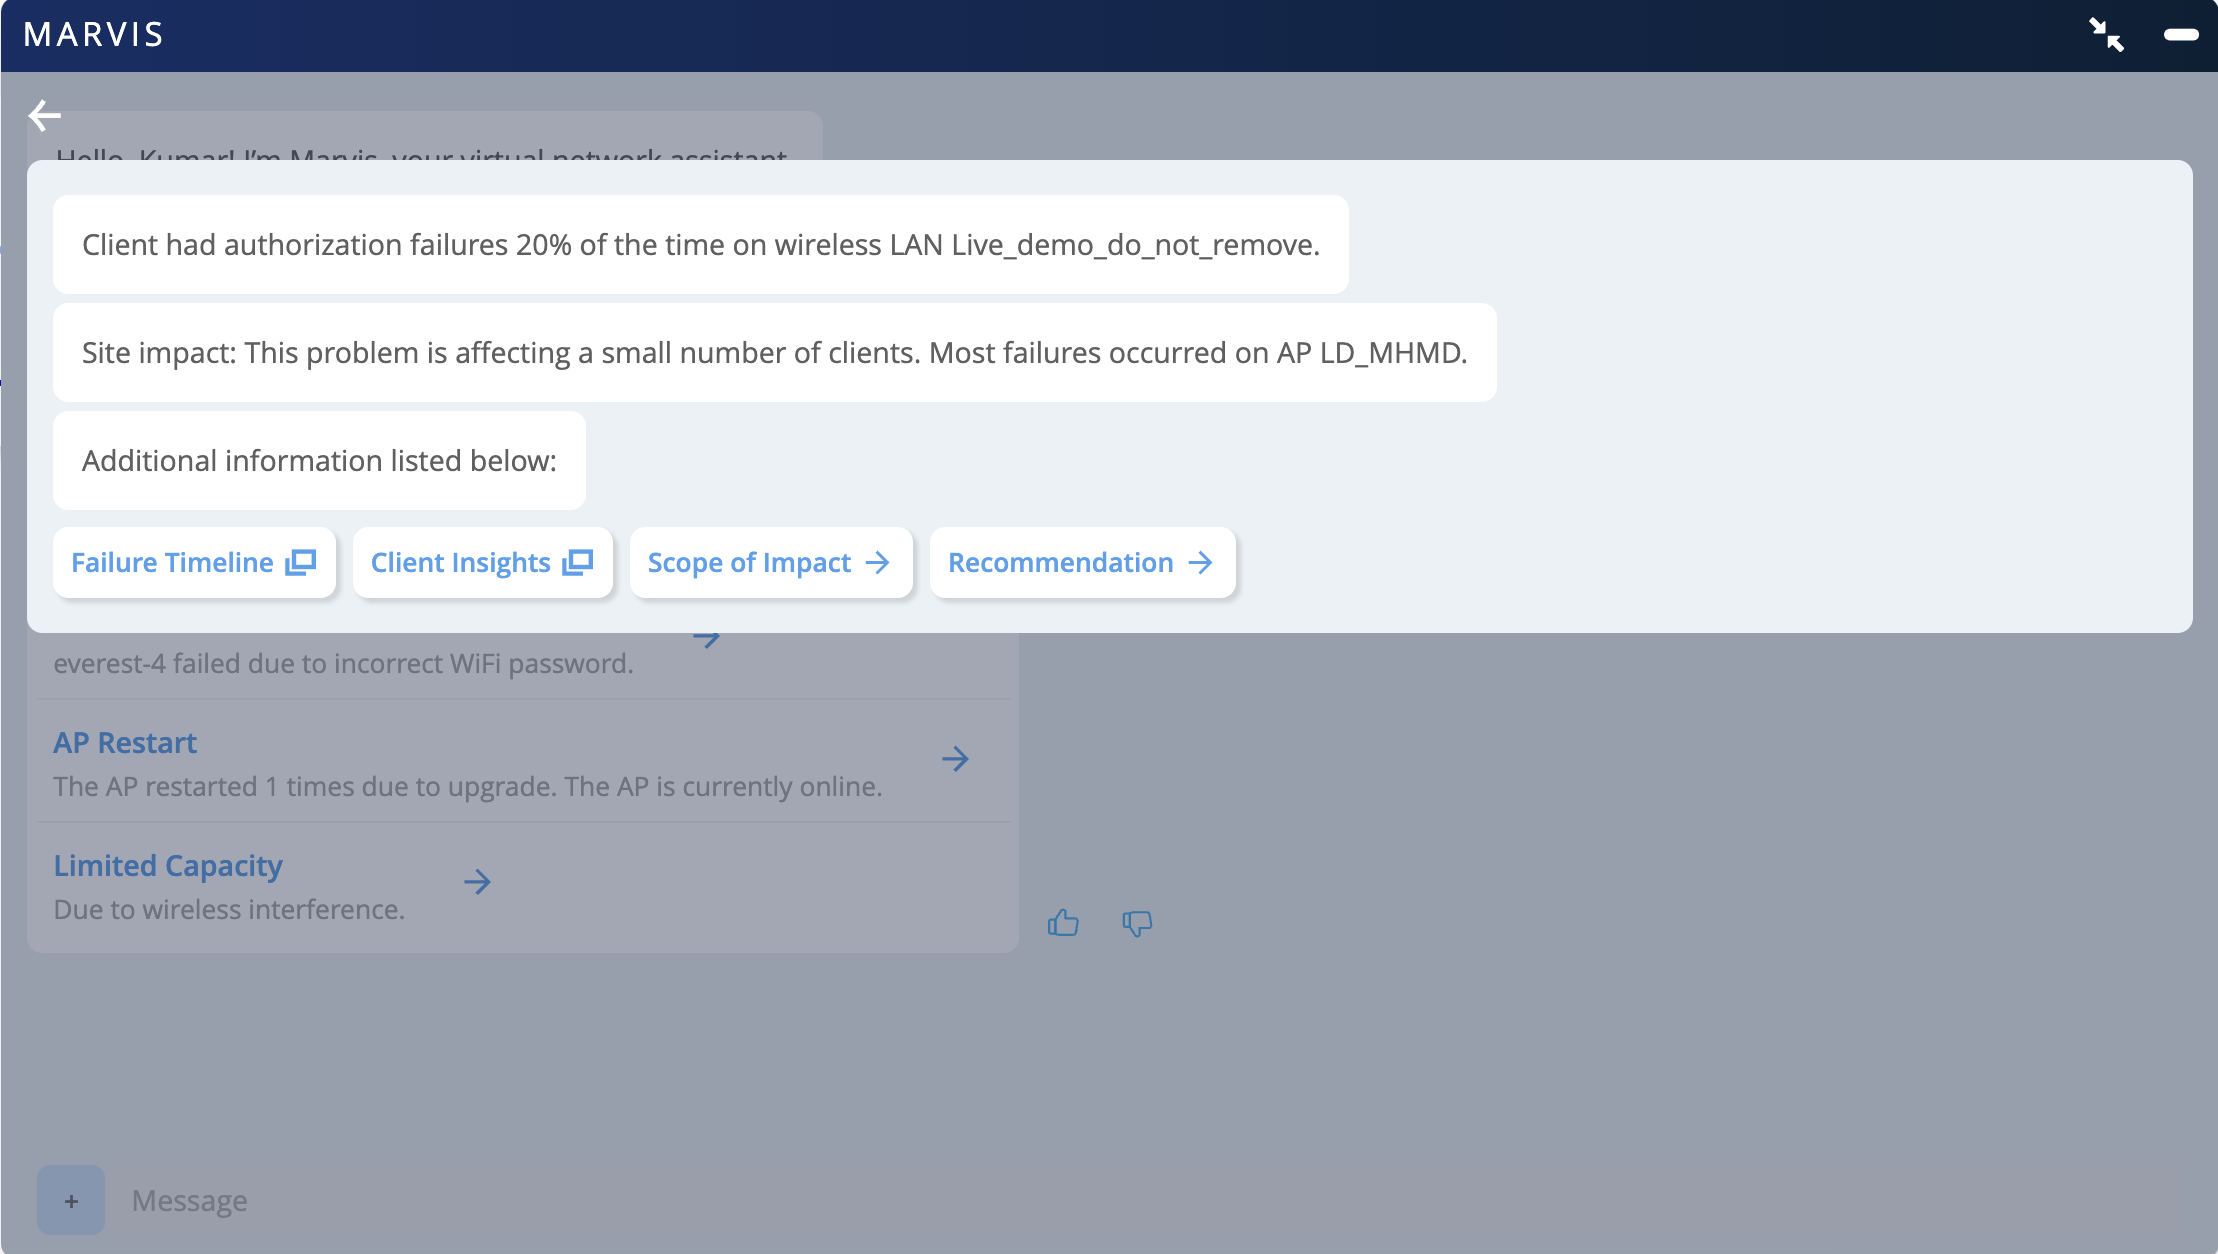
  1. Marvis対話型アシスタントウィンドウで、 tshoot の後にクライアントのMACアドレス名またはホスト名を入力します。次の例では、Marvisが無線パスワードの誤りによる認証の問題を報告していることがわかります。
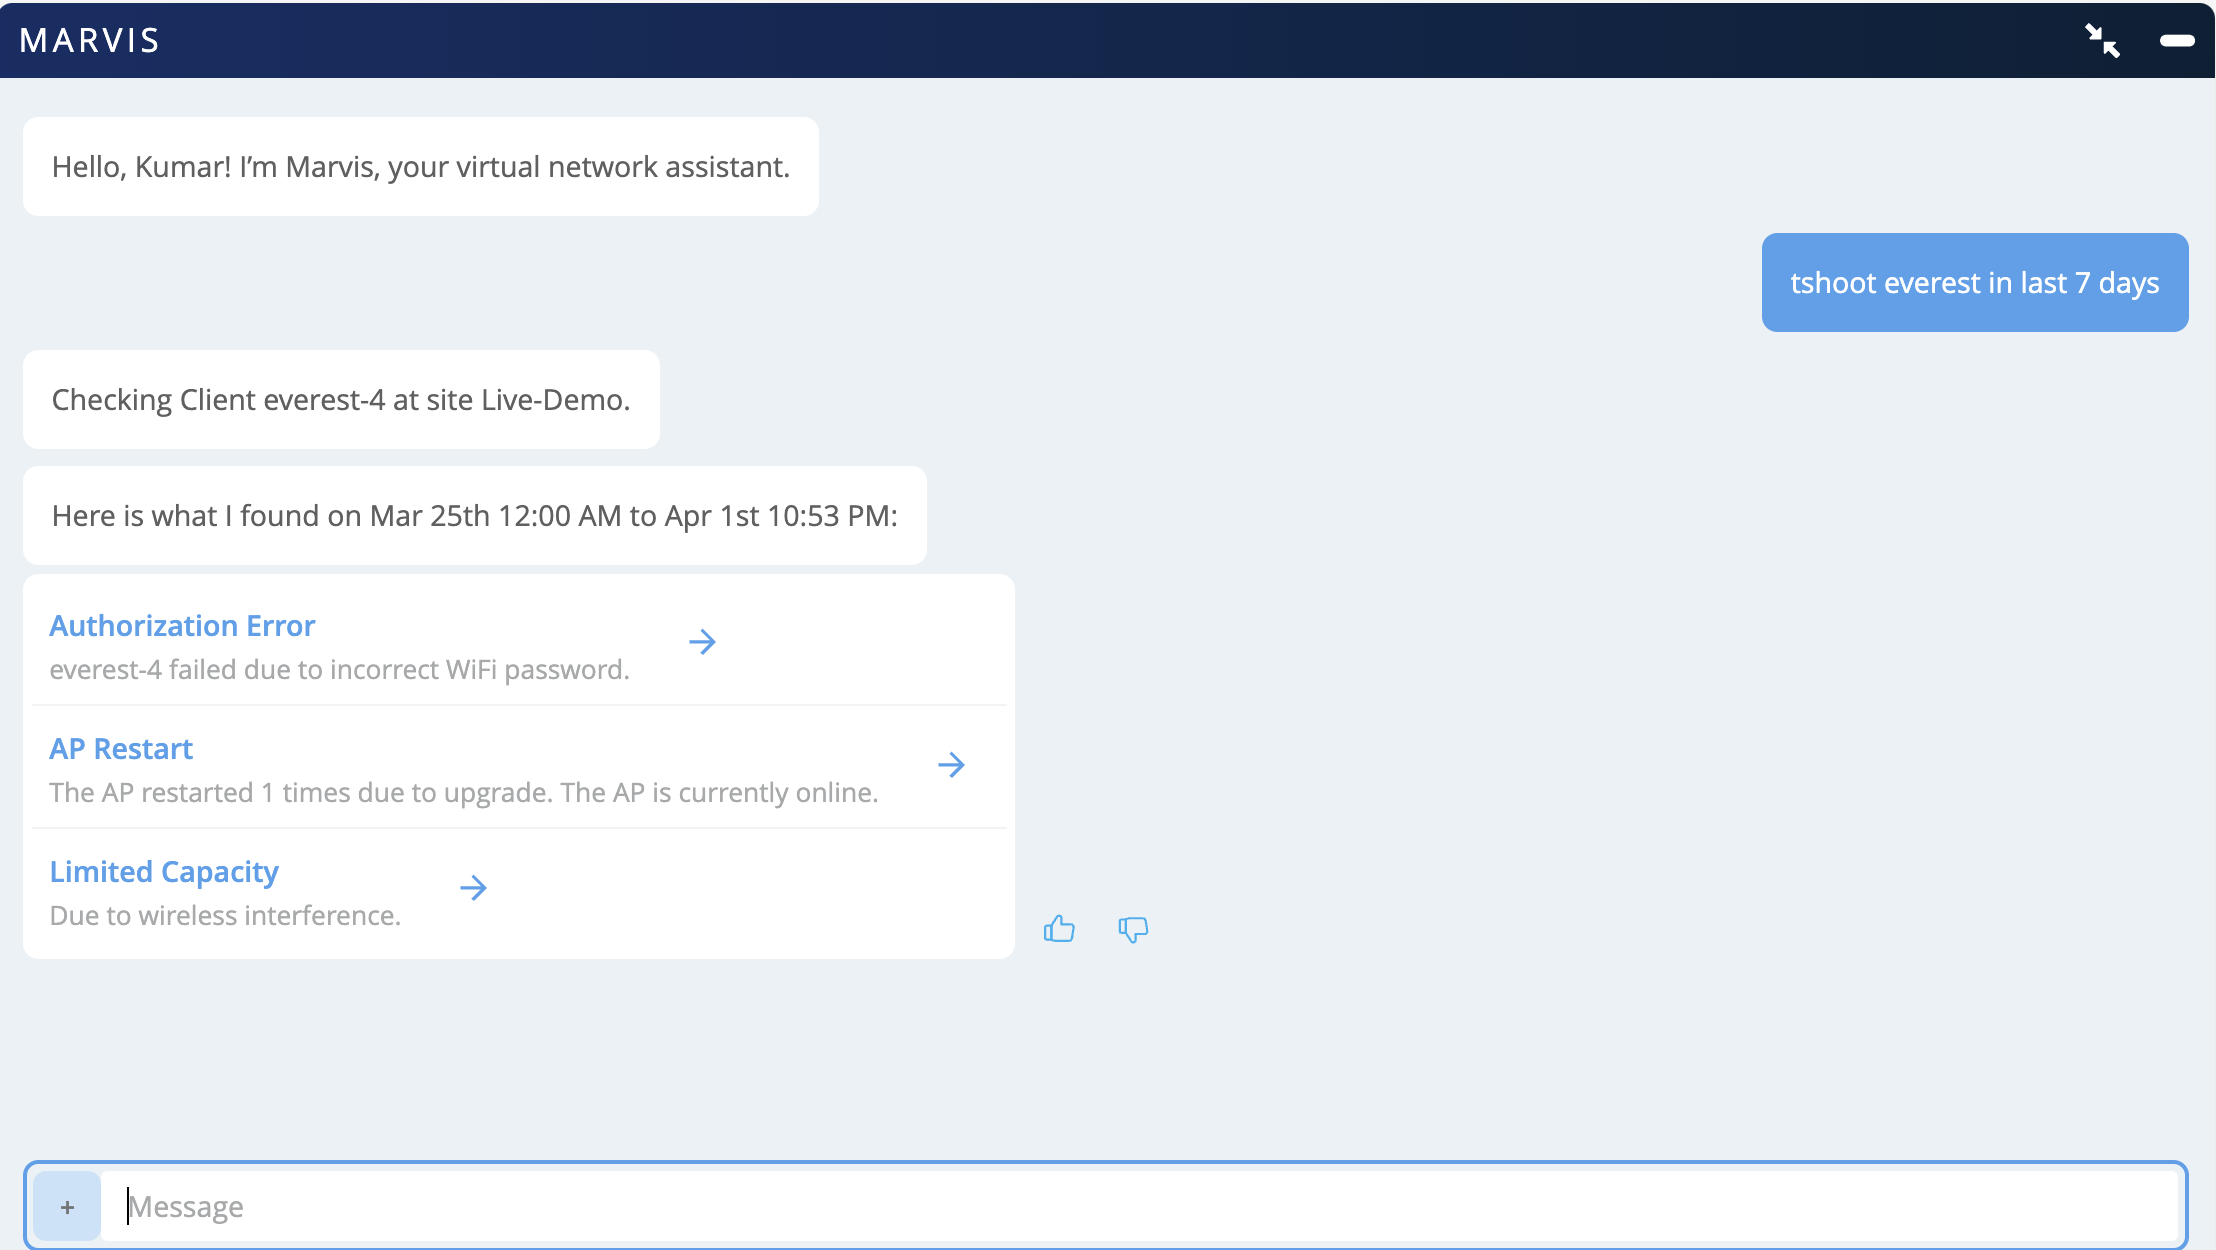
    Virtual network assistant Marvis responds to a query about troubleshooting client everest-4 over 7 days, listing findings: authorization error due to incorrect WiFi password, AP restarted once due to upgrade, and limited capacity from wireless interference, with links for more details and a text input box for interaction.

  2. 認証 エラー をクリックして詳細を表示します。

    Network troubleshooting interface from Marvis showing authorization failures 20 percent of the time on WLAN Live_demo_do_not_remove, mostly affecting AP LD_MHMD, with options for further details like Failure Timeline and Recommendation.

表示されたオプションを使用して、さらに調査してください。

影響の範囲

まず、成功した接続試行と失敗した接続試行をリストした影響の範囲を確認することができます。クライアントが 1 つまたは複数の WLAN で障害が発生しているかどうかを確認できます。
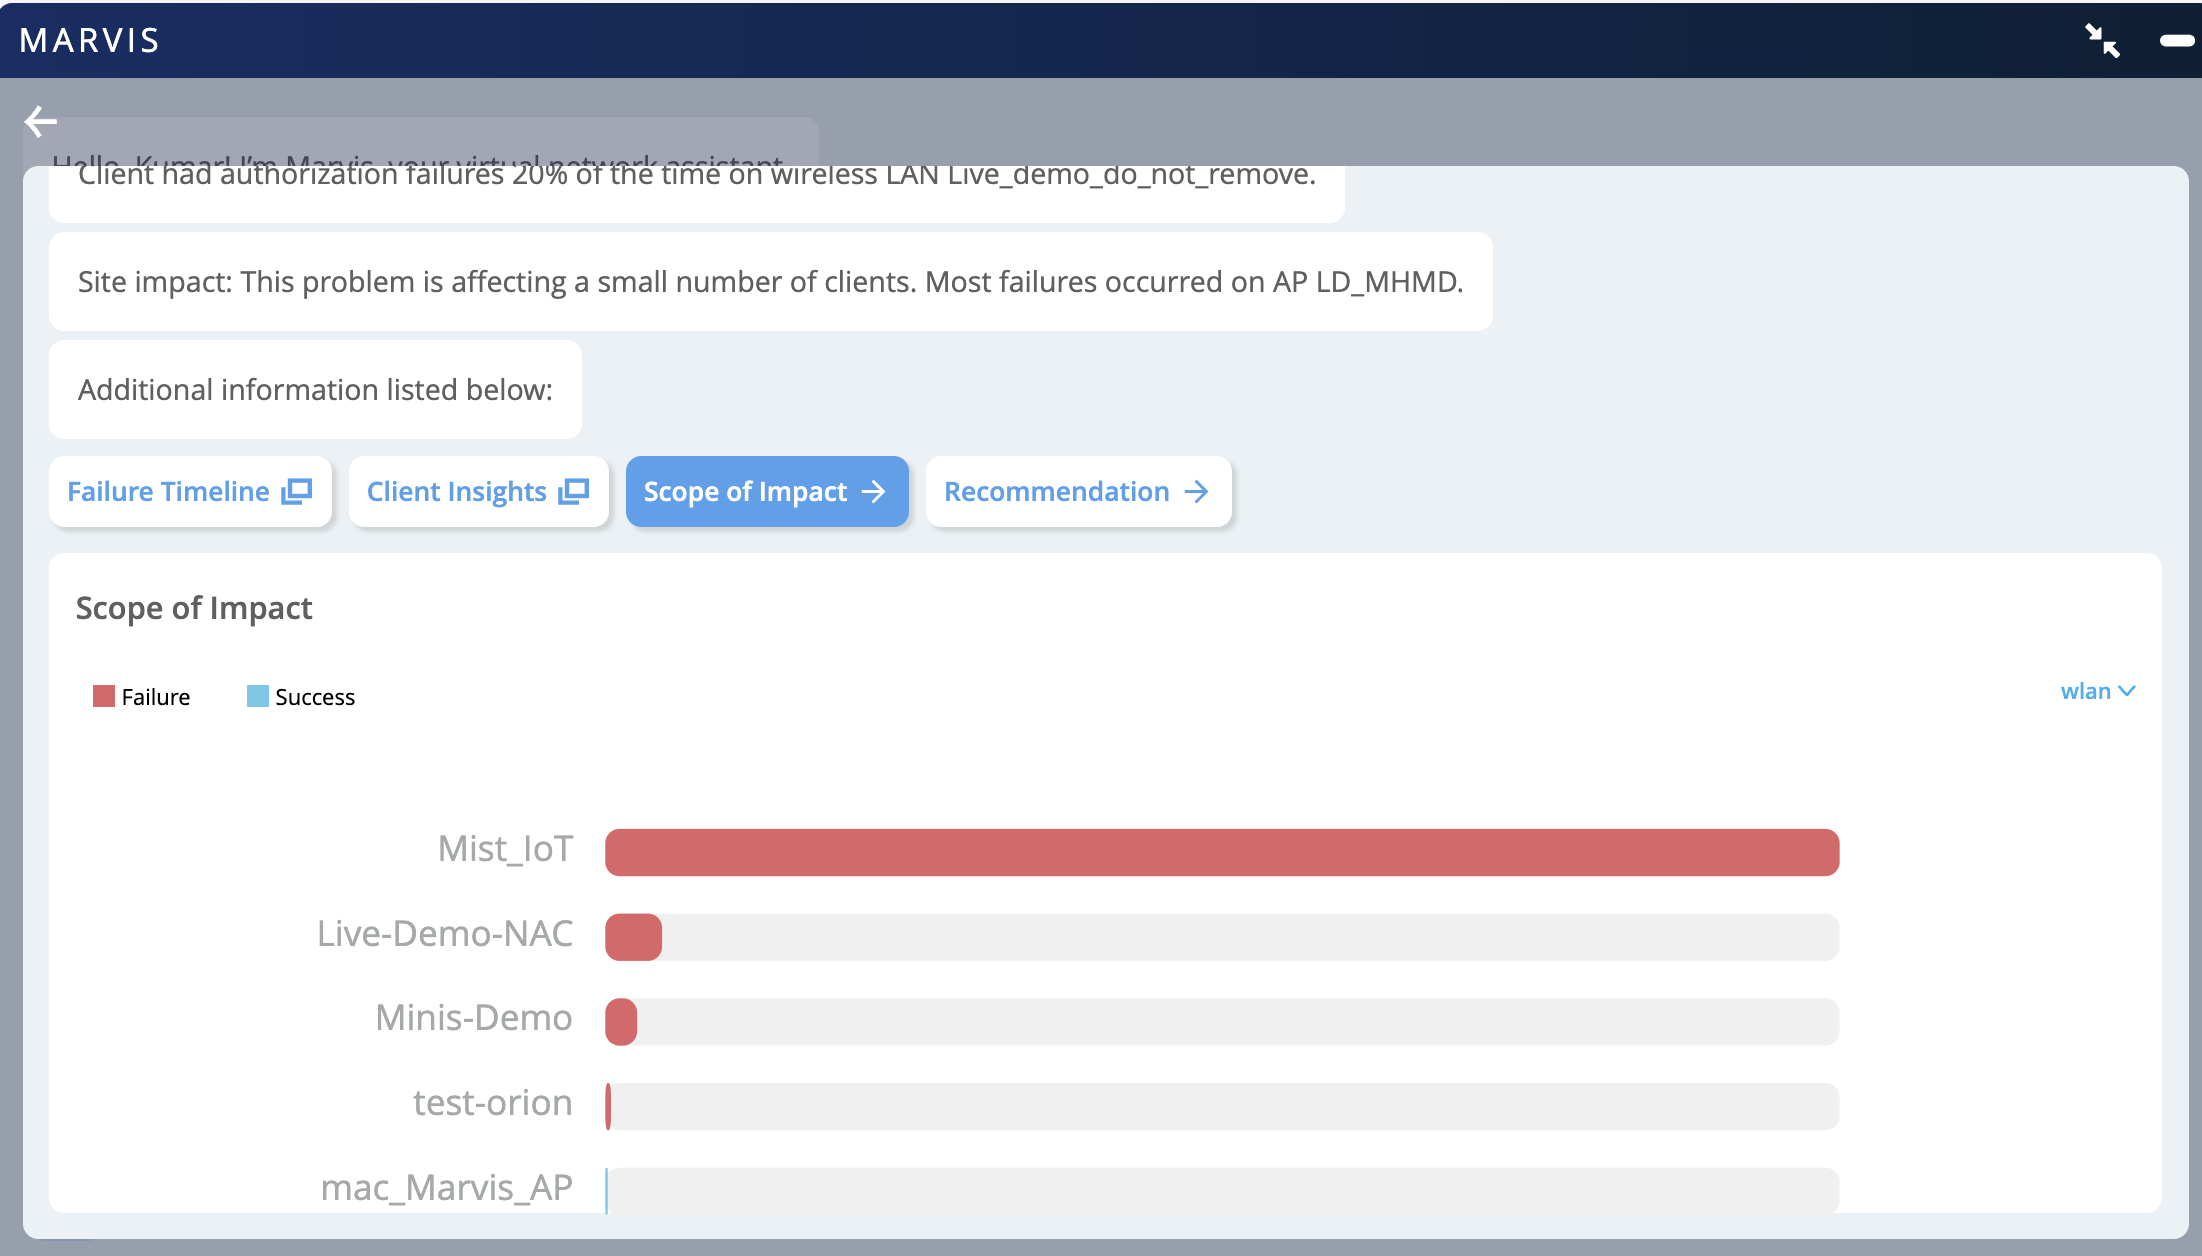
Screenshot of Marvis network analysis tool displaying Scope of Impact section with a bar graph showing WLAN failure and success rates, highlighting 20 percent client authorization failures on a specific WLAN.

クライアントインサイト

クライアントインサイトをクリックすると、クライアントに関連するすべてのイベントを表示できます。次の例に示すように、認証失敗イベントをクリックすると、失敗の理由を確認できます。
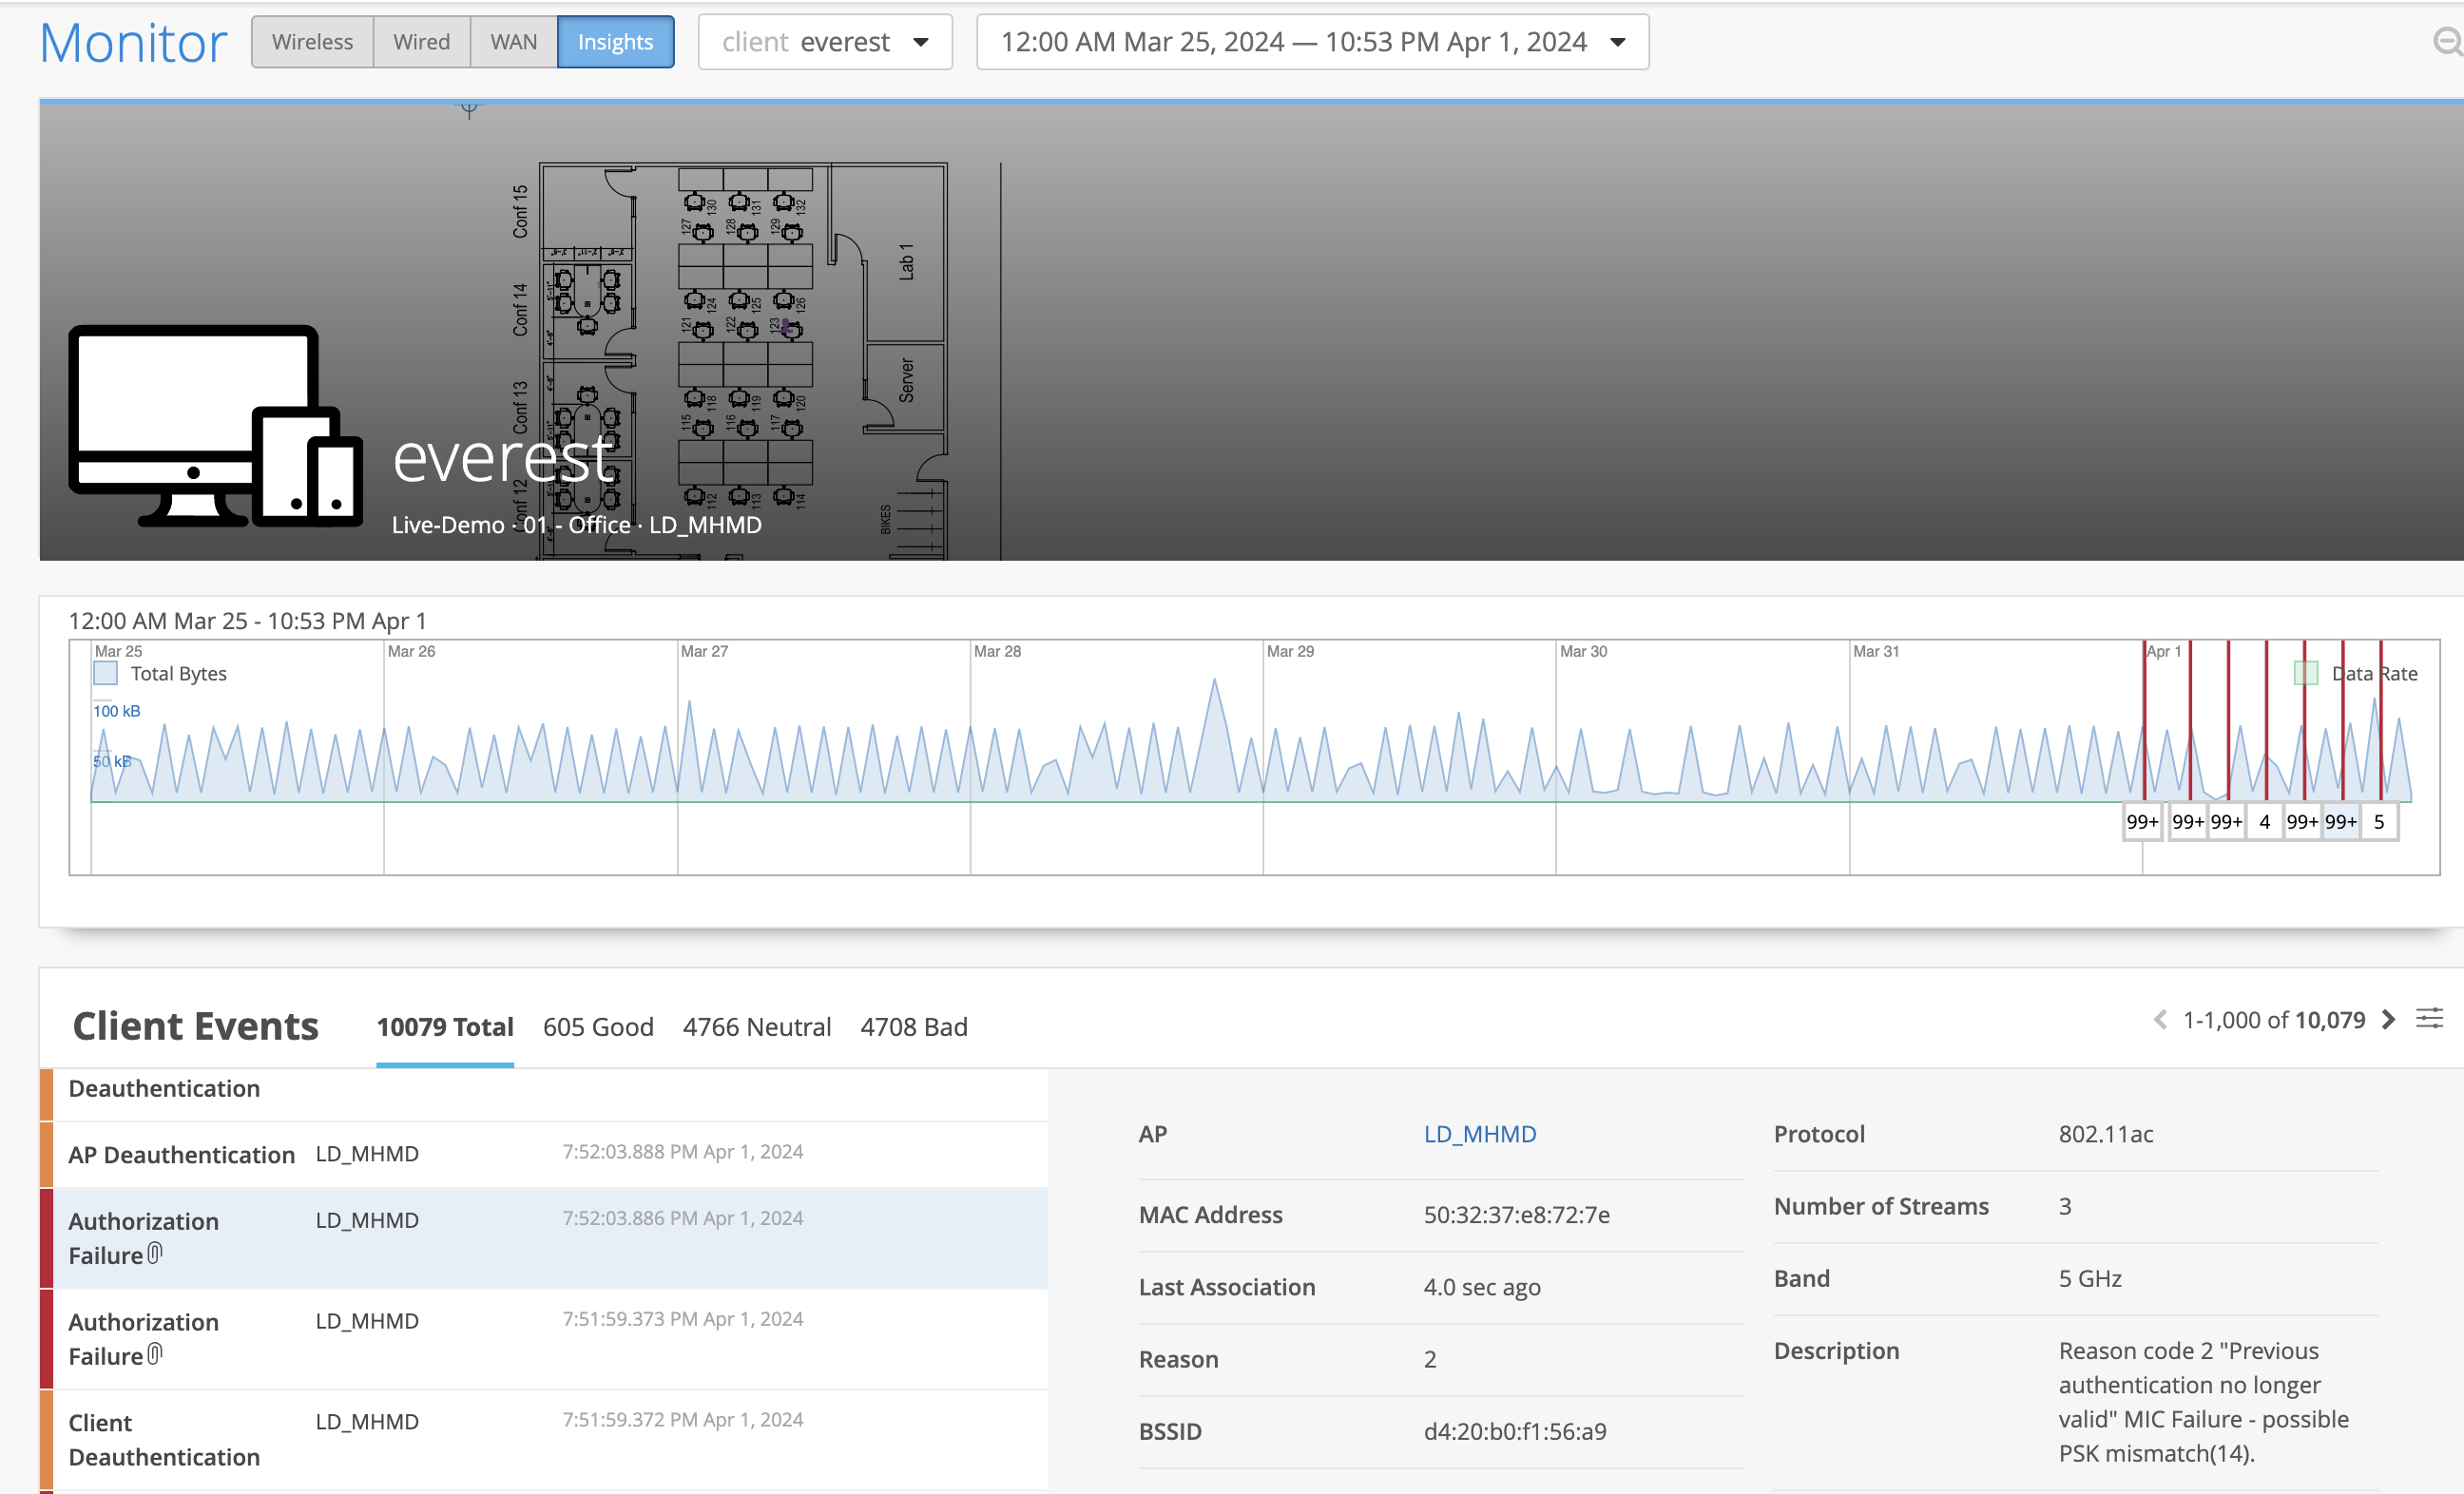
Network monitoring dashboard showing data for client everest from March 25 to April 1, 2024. Includes tabs, search bar, dropdown menus, a floor plan with labeled rooms, a line graph of total bytes over time with marked events, and a table listing 10079 client events categorized as good, neutral, or bad.

RADIUS認証失敗のトラブルシューティング

RADIUSサーバーがダウンしているか、到達できない場合、クライアントで802.1x認証エラーが発生することがあります。

RADIUS 認証エラーのトラブルシューティングを行うには:

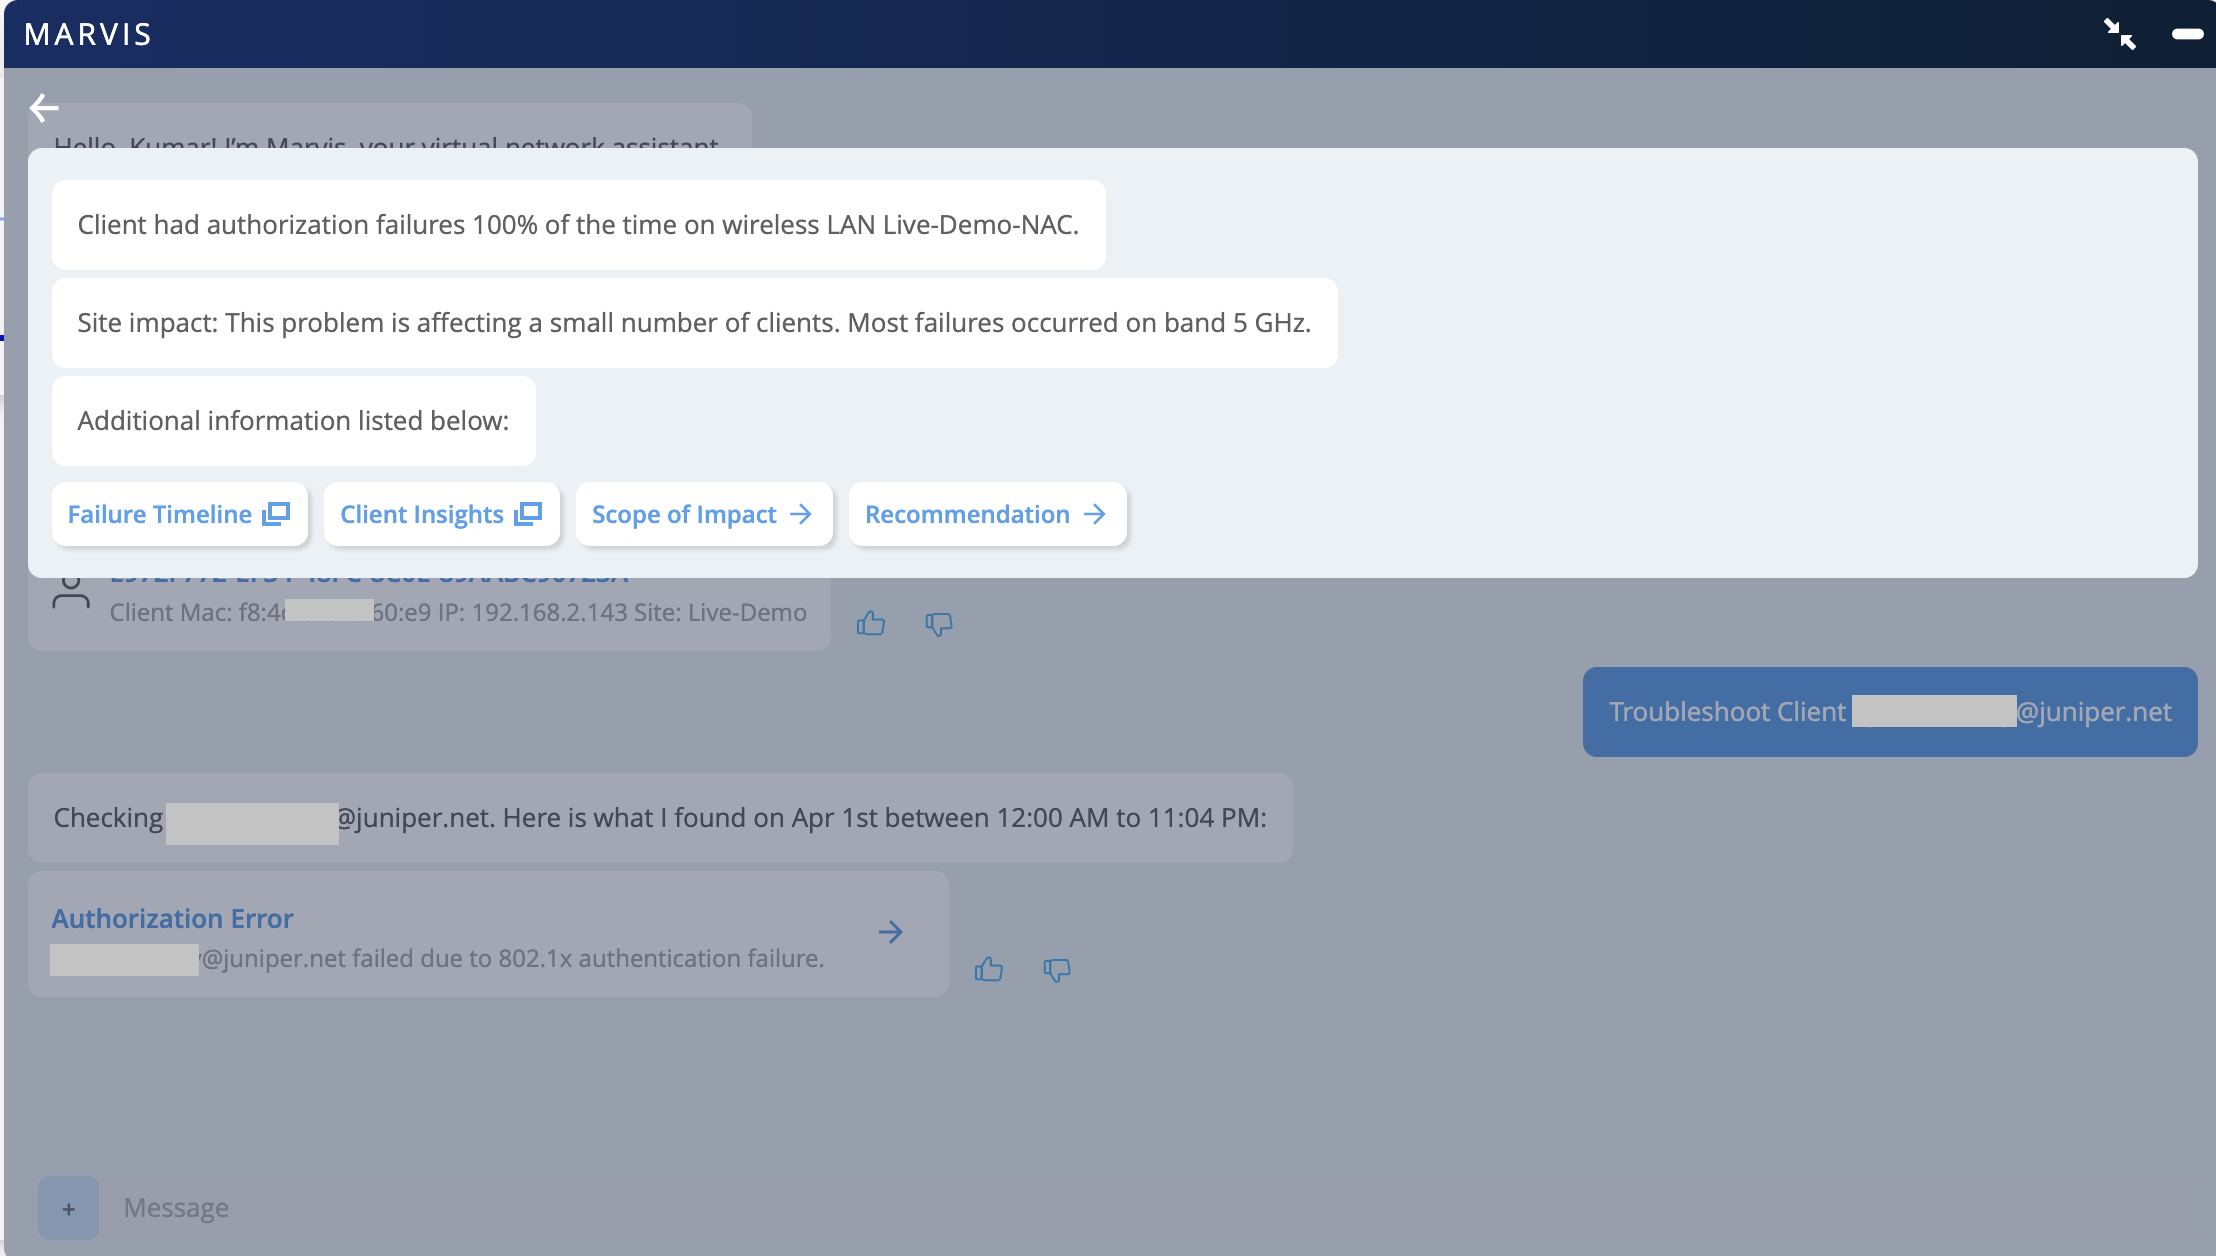
  1. Marvis対話型アシスタントウィンドウで、 tshoot の後にクライアントの名前を入力します。次の例では、Marvisがネットワークで802.1x認証エラーを検出していることがわかります。
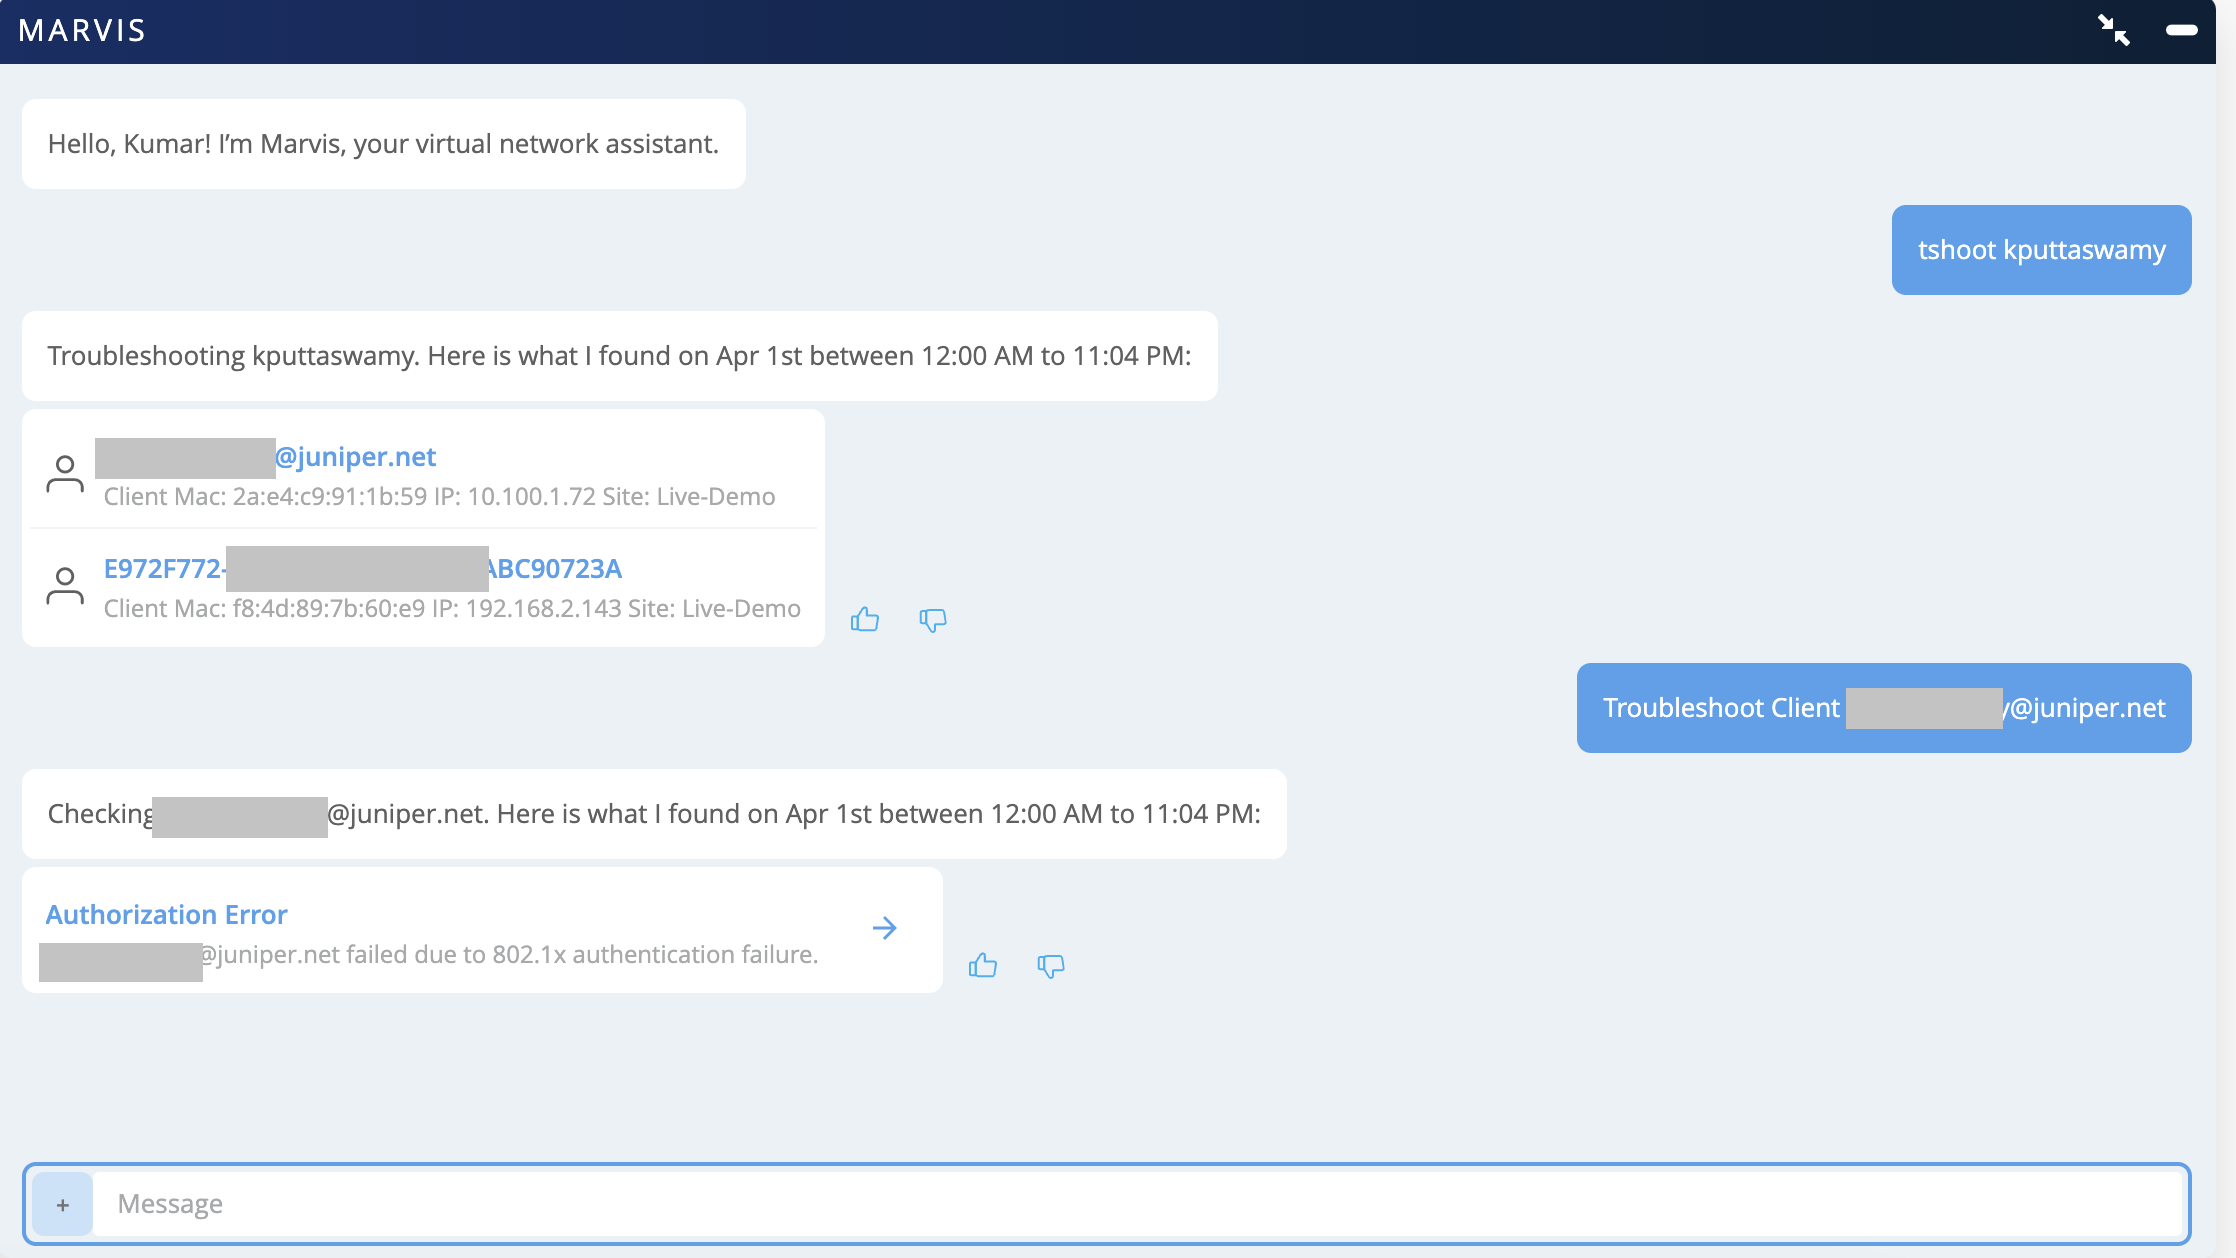
    Screenshot of a chat with Marvis troubleshooting a client device. Includes user input, client details like MAC and IP addresses, site info Live-Demo, and an error message for 802.1x authentication failure. Features user feedback options and a text input field.

  2. 認証 エラー をクリックして詳細を表示します。

    Network troubleshooting interface showing 100 percent authorization failures for a client on the wireless LAN Live-Demo-NAC with links to failure timeline, client insights, scope of impact, recommendation, and troubleshoot client button.

表示されたオプションを使用して、さらに調査できます。

影響の範囲

まず、成功した接続試行と失敗した接続試行をリストした影響の範囲を確認することができます。クライアントが 1 つまたは複数の WLAN で障害が発生しているかどうかを確認できます。
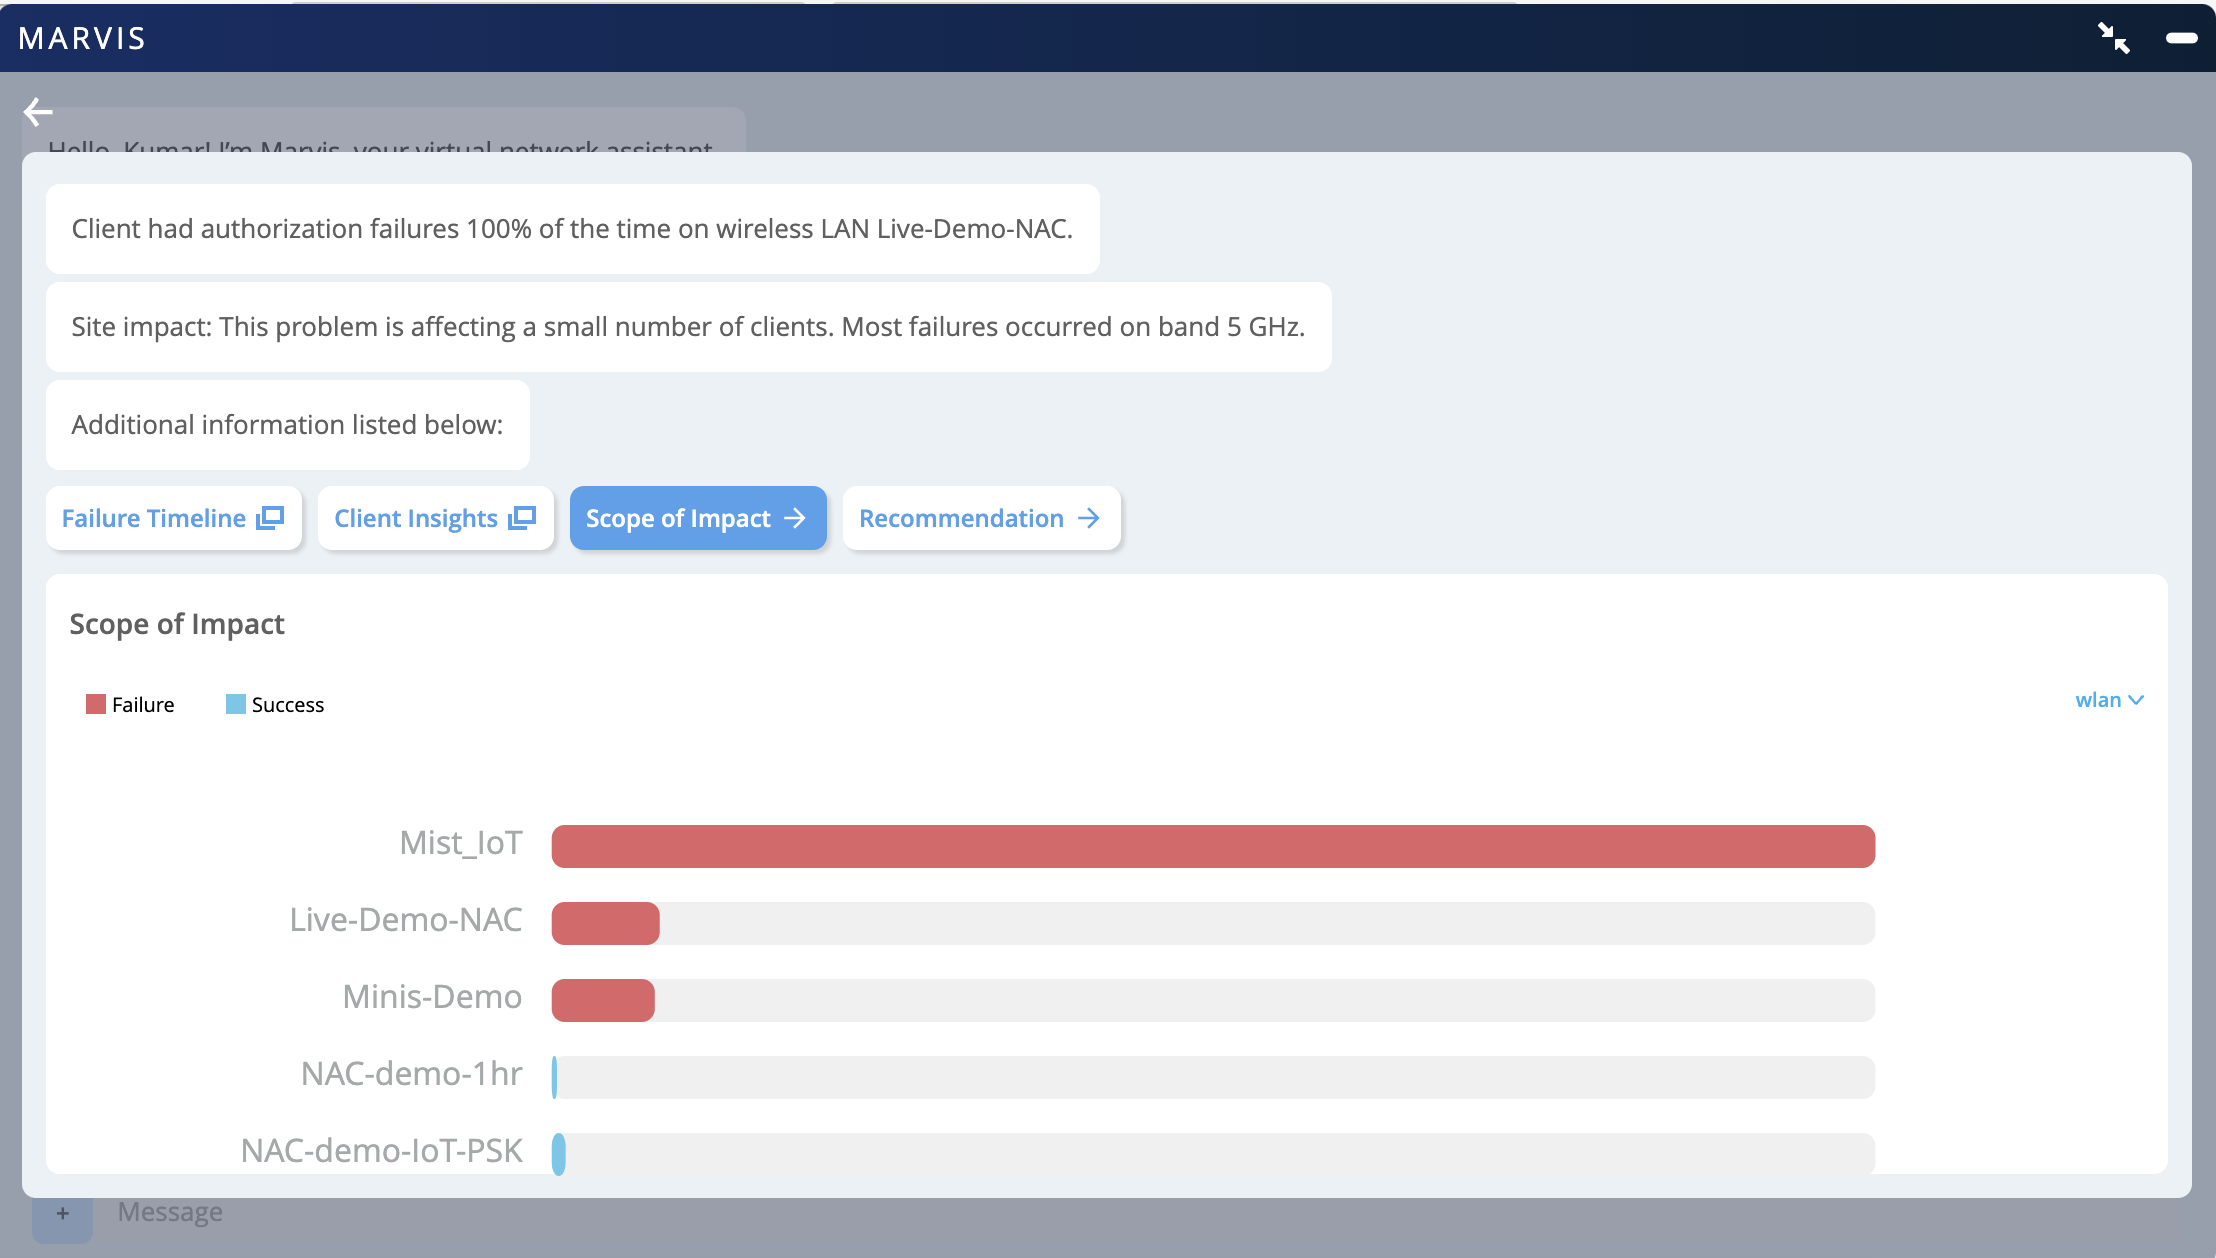
Network troubleshooting interface showing 100 percent authorization failures on wireless LAN Live-Demo-NAC, primarily on 5 GHz band. Scope of Impact tab displays a bar chart comparing success and failure rates across networks, with Mist_IoT and Live-Demo-NAC having highest failure rates.

クライアントインサイト

クライアントインサイトをクリックすると、クライアントに関連するすべてのイベントを表示できます。次の例に示すように、認証失敗イベントをクリックすると、失敗の理由を確認できます。
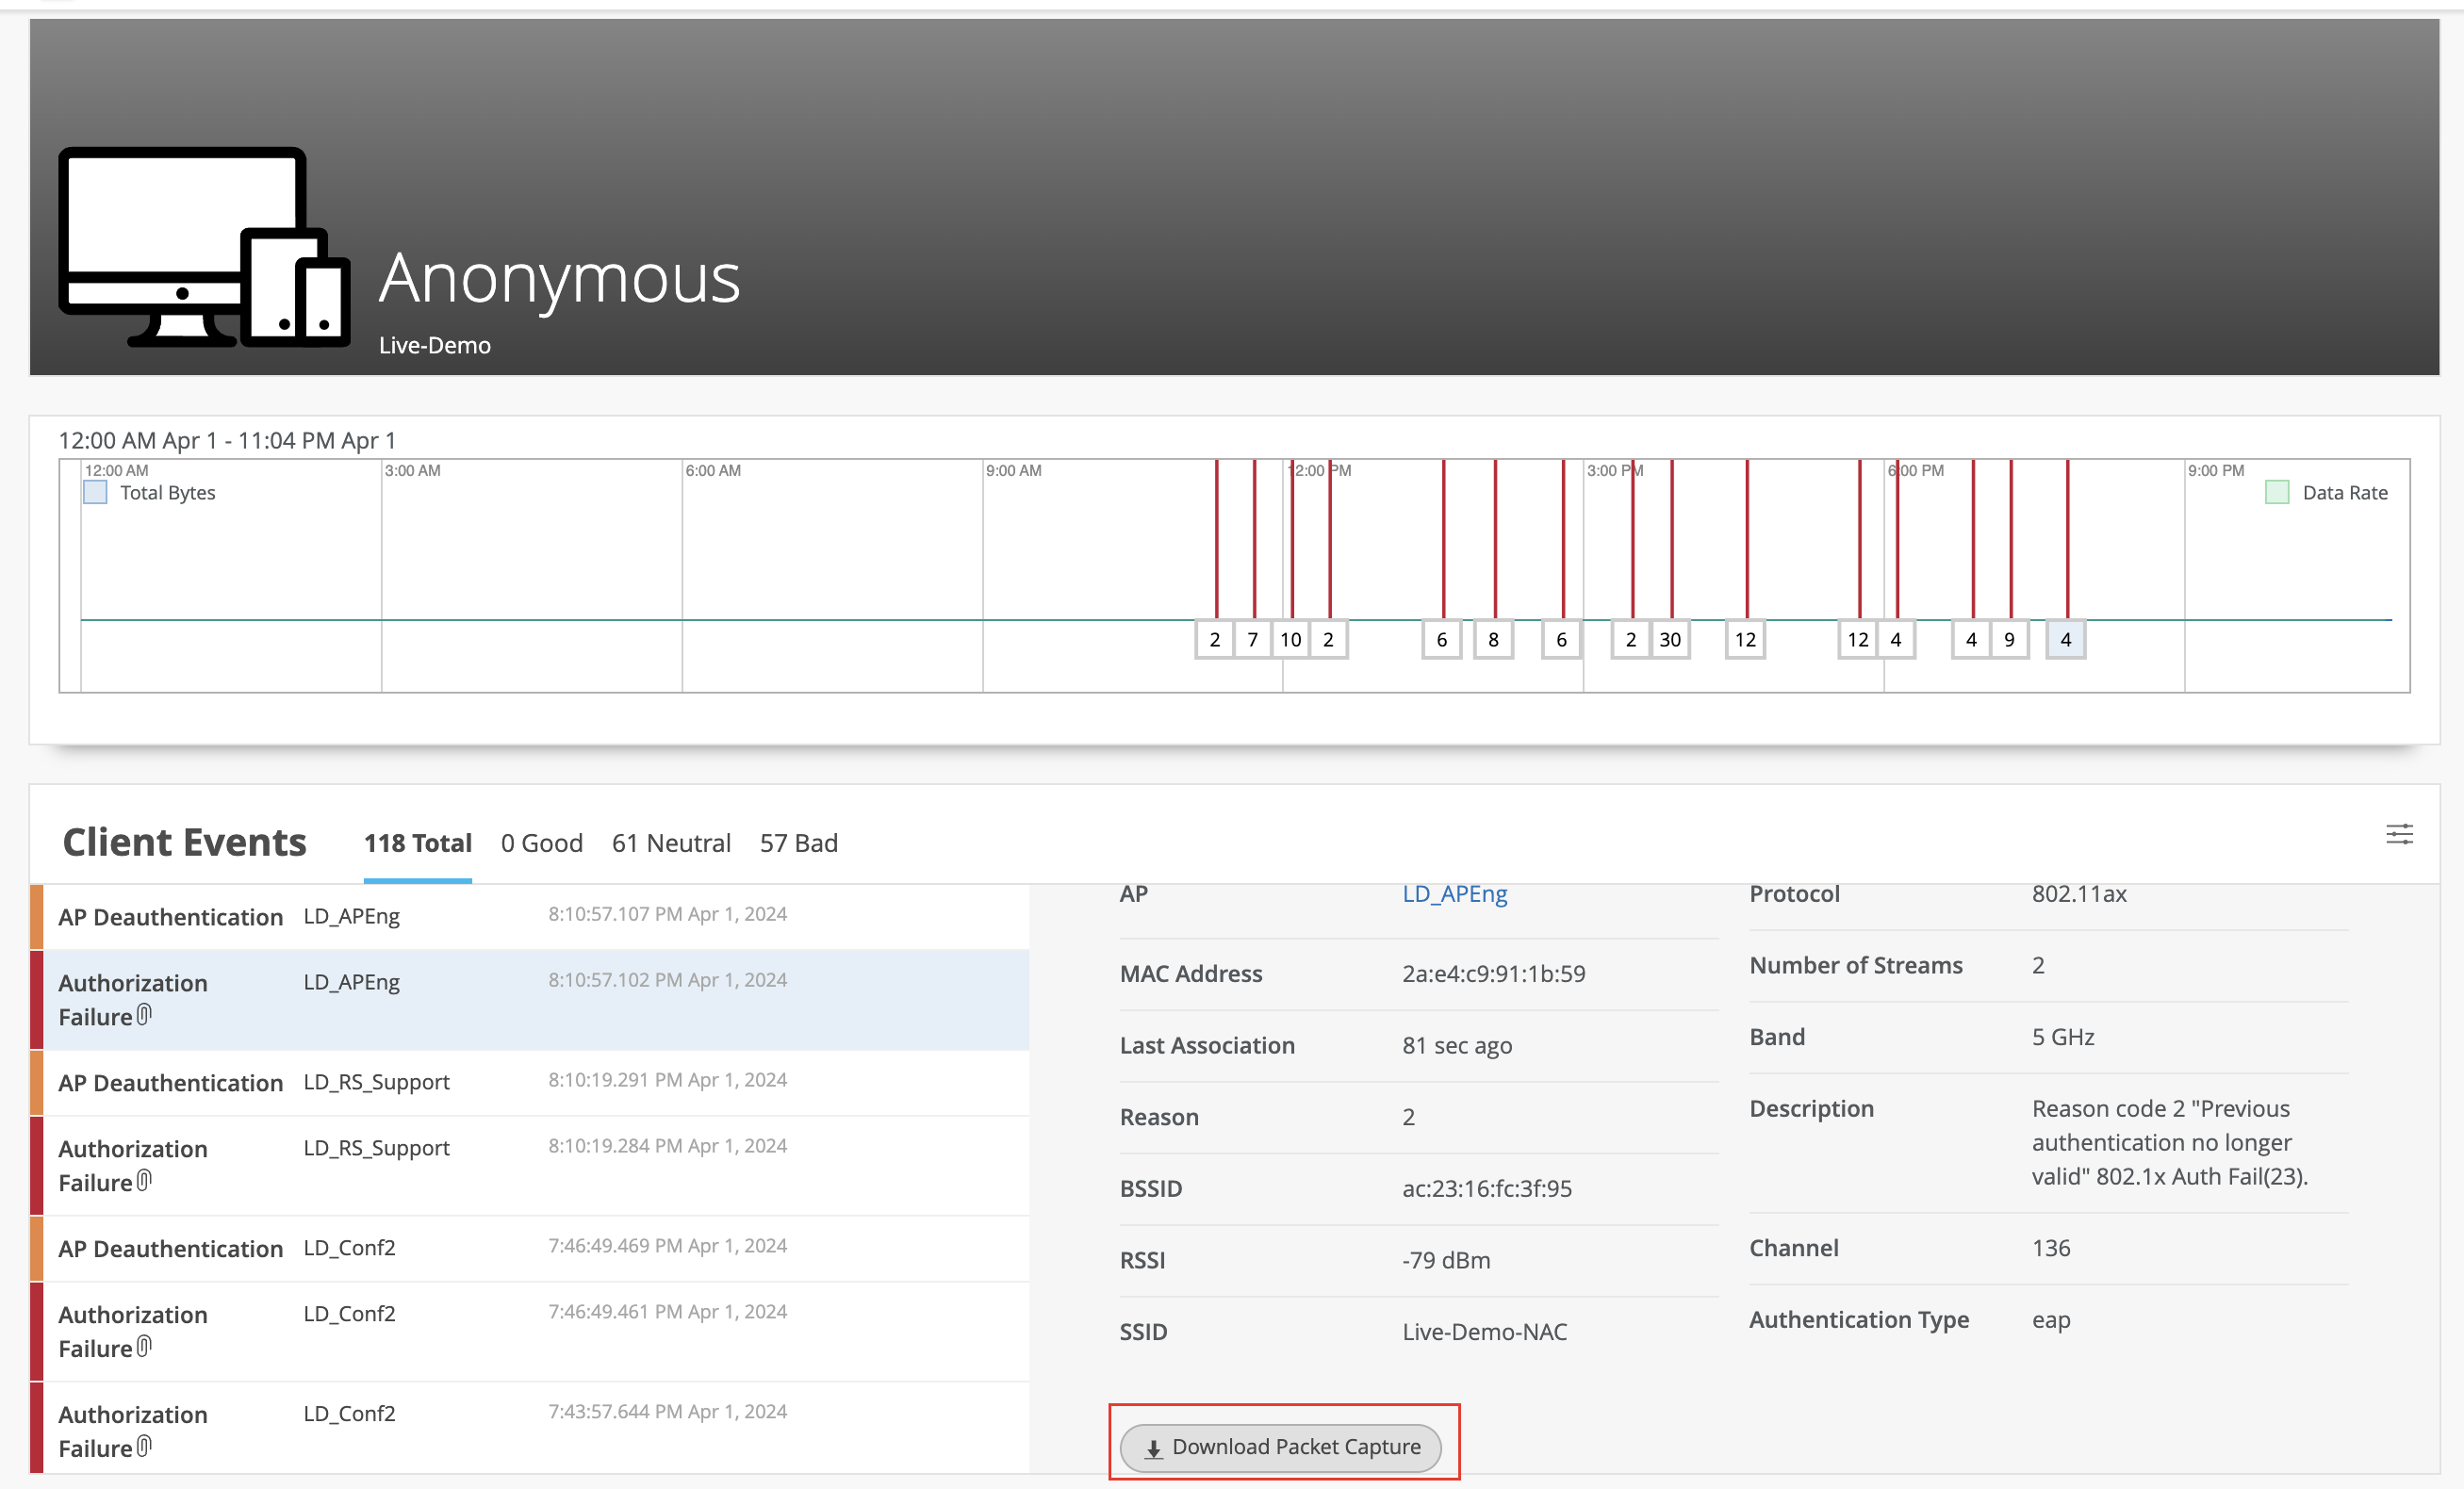
Network monitoring dashboard with header showing Anonymous and Live-Demo, timeline graph of network activity with red event markers, list of client events like AP Deauthentication and Authorization Failure, detailed event info including AP name, MAC address, protocol, RSSI, SSID, issue description, and Download Packet Capture button for troubleshooting.

特定のイベントのダイナミックパケットキャプチャをダウンロードできます。以下はパケットキャプチャの例です。
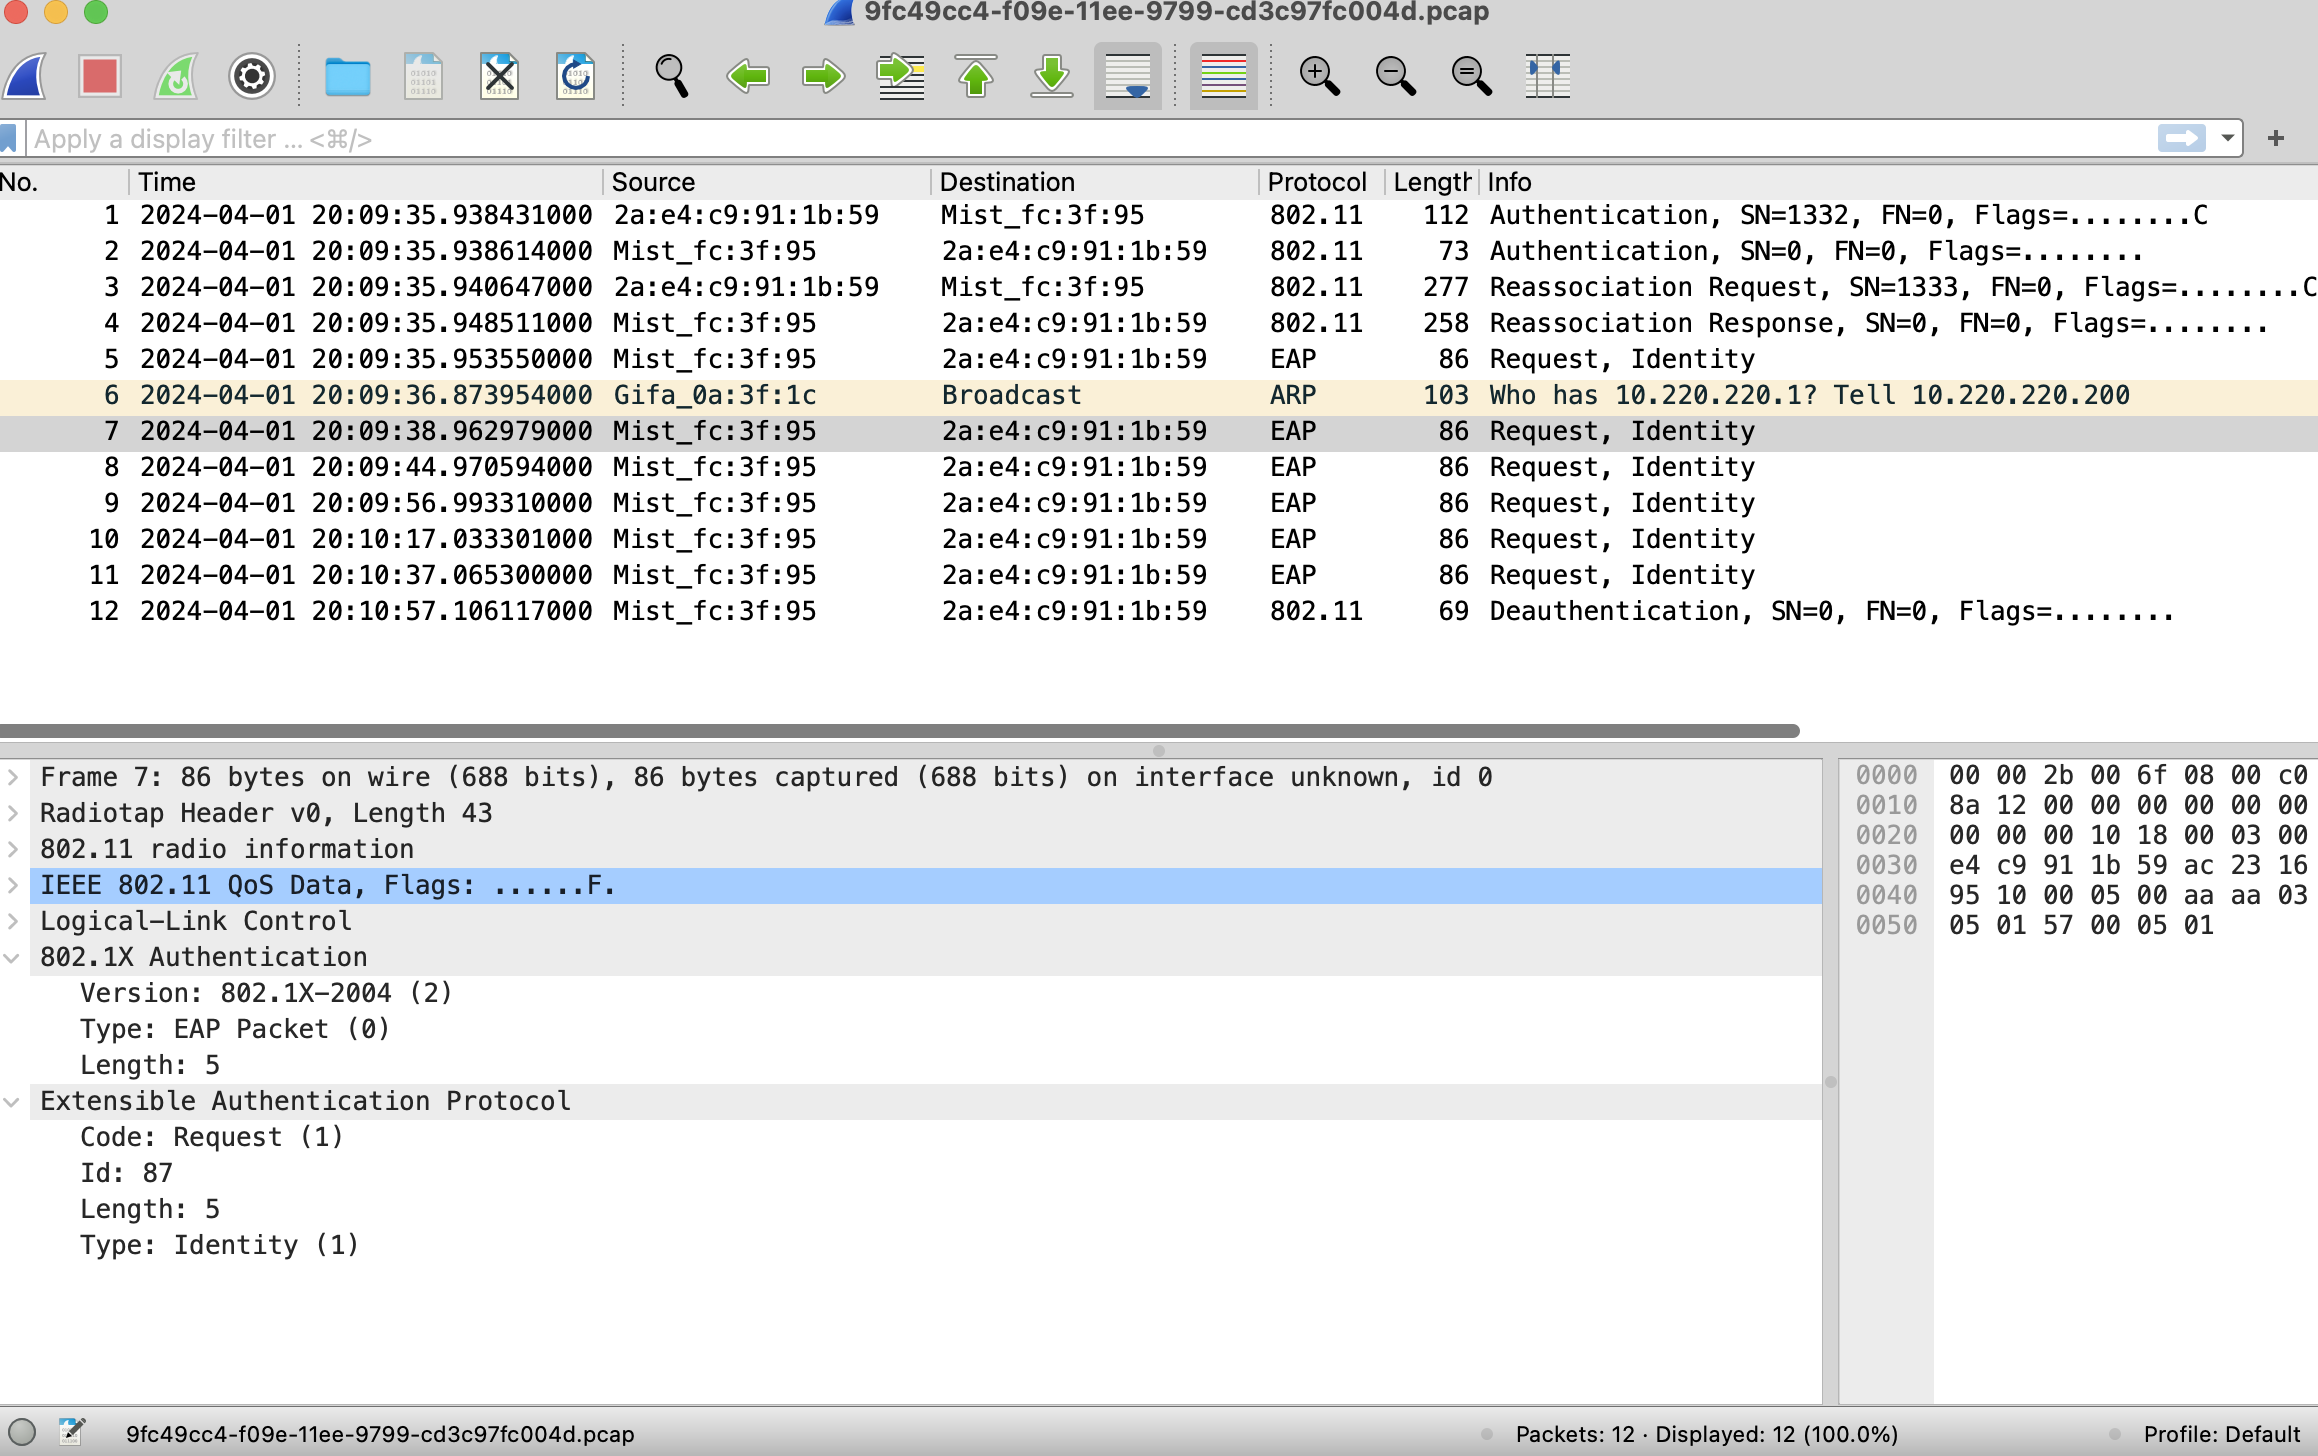
Screenshot of Wireshark showing captured network packets with columns for time, source, destination, protocol, length, and info. Highlighted packet is an EAP request with detailed protocol layers and hexadecimal data in the lower pane. Used for network troubleshooting and analysis.