Marvisクエリー言語を使用したトラブルシューティング
これらの例を使用して、Marvisクエリを使用してネットワークを監視し、トラブルシューティングする方法を確認してください。
イベントとデバイスの詳細を表示
問題をトラブルシューティングし、ネットワークの動作を理解するには、イベントの詳細やデバイスの詳細を確認する必要がある場合があります。LISTクエリを使用して、以下の詳細を表示できます。
-
アクセスポイント(AP)
-
クライアント(有線クライアントを含む)
-
スイッチ
-
APイベント
-
クライアントイベント
-
スイッチイベント
-
Mist Edge
-
Mist Edgeイベント
表 1 と 表 2 に、要件に基づいてクエリを作成するための参照として使用できるいくつかの LIST クエリを示します。
| 見たい場合は | 使用する |
|---|---|
| 特定の時間間隔でのAPのクライアントイベント | LIST ClientEvents WITH AccessPoint <AP name> DURING <time duration> |
| APのすべてのイベント | LIST ApEvents WITH AccessPoint <AP name> |
| APの特定のタイプのイベント | LIST ApEvents WITH ApEventType <event-type> AND AccessPoint <ap-name> |
| スイッチのすべてのイベント | LIST SwitchEvents WITH Switch <switch name> |
| スイッチの特定のタイプのイベント | LIST SwitchEvents WITH SwitchEventType <event-type> AND Switch <switch-name> |
| 特定のサイトでのMist Edgesのすべてのイベント | LIST MistEdgeEvents WITH Site <site-name> |
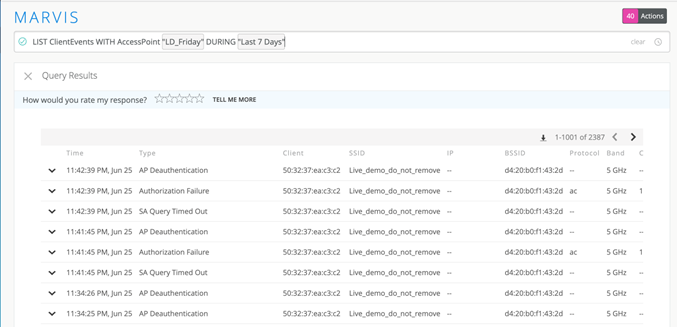
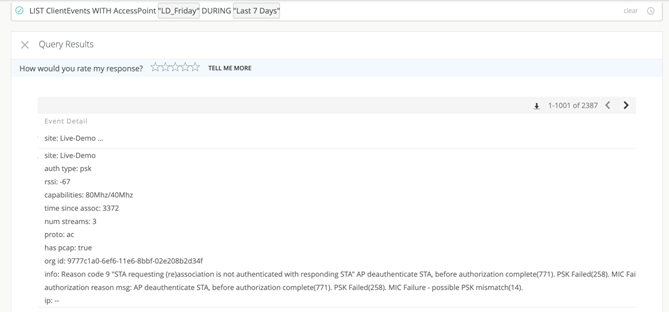
次の例は、特定の AP に関連するすべてのクライアントのイベントを示しています。イベントの詳細を表示するには、表の最初の列にある矢印をクリックします。
この例では、特定のイベントタイプの一覧を示しています。
| 見たい場合は | 使用する |
|---|---|
| サイト内の特定のモデルのスイッチ | LIST Switches WITH Model <model number> AND Site <site name> |
| APに接続されたクライアント | LIST Clients WITH AccessPoint <AP name> |
| サイト内の特定モデルのAP | LIST APs WITH Model <model number> AND Site <site name> |
| サイト内のすべての有線クライアント | LIST WiredClients WITH Site <site name> |
|
サイト内のMist Edge |
LIST MistEdges WITH Site <site name> |
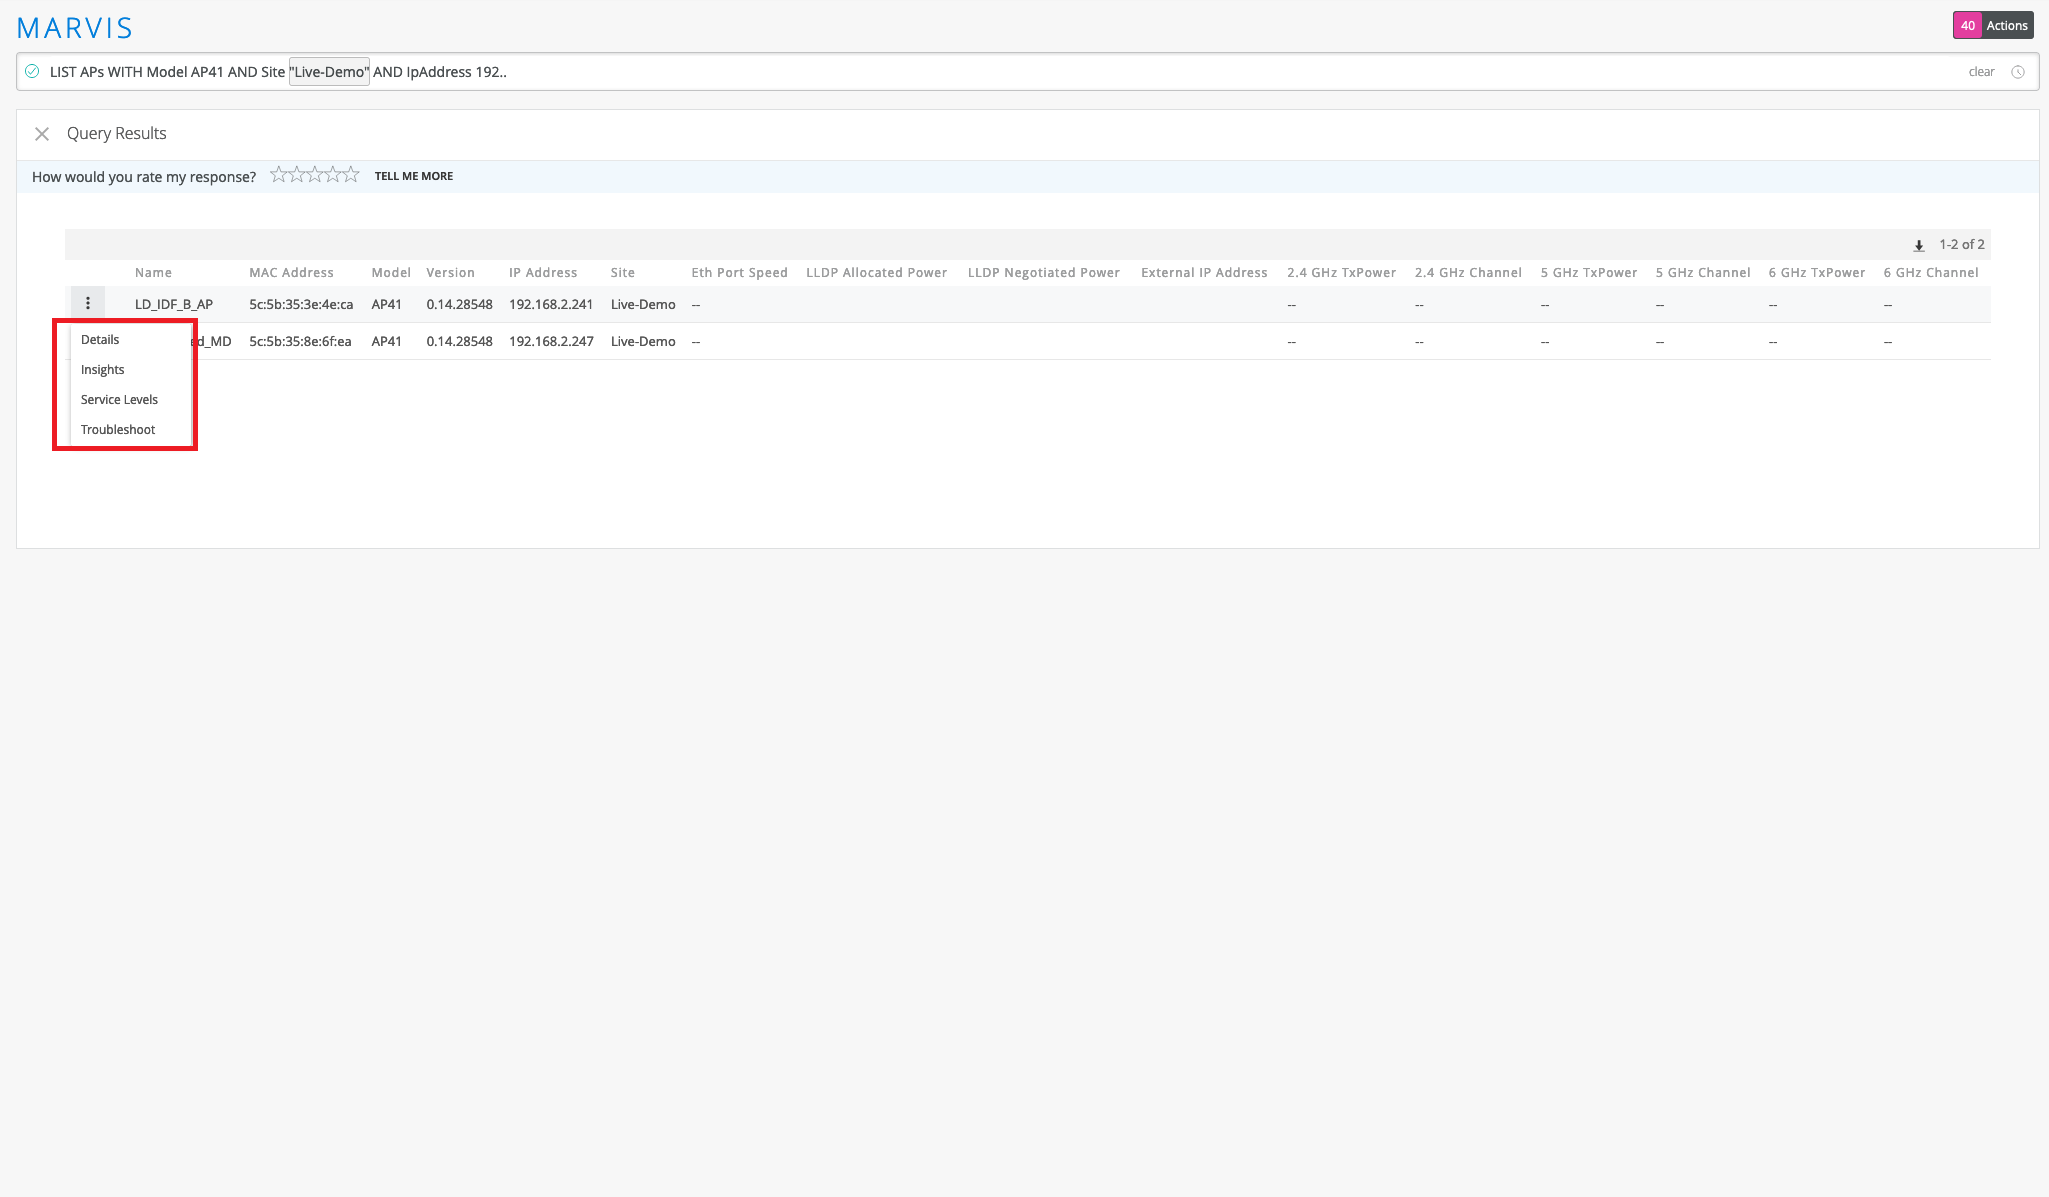
以下の例は、LIST クエリの出力を示しています。IP アドレスの一部を入力して、特定のサブネット内のデバイスを検索できます。追加のアクションを行うには、テーブルの左上隅にあるその他のオプションアイコンをクリックします。
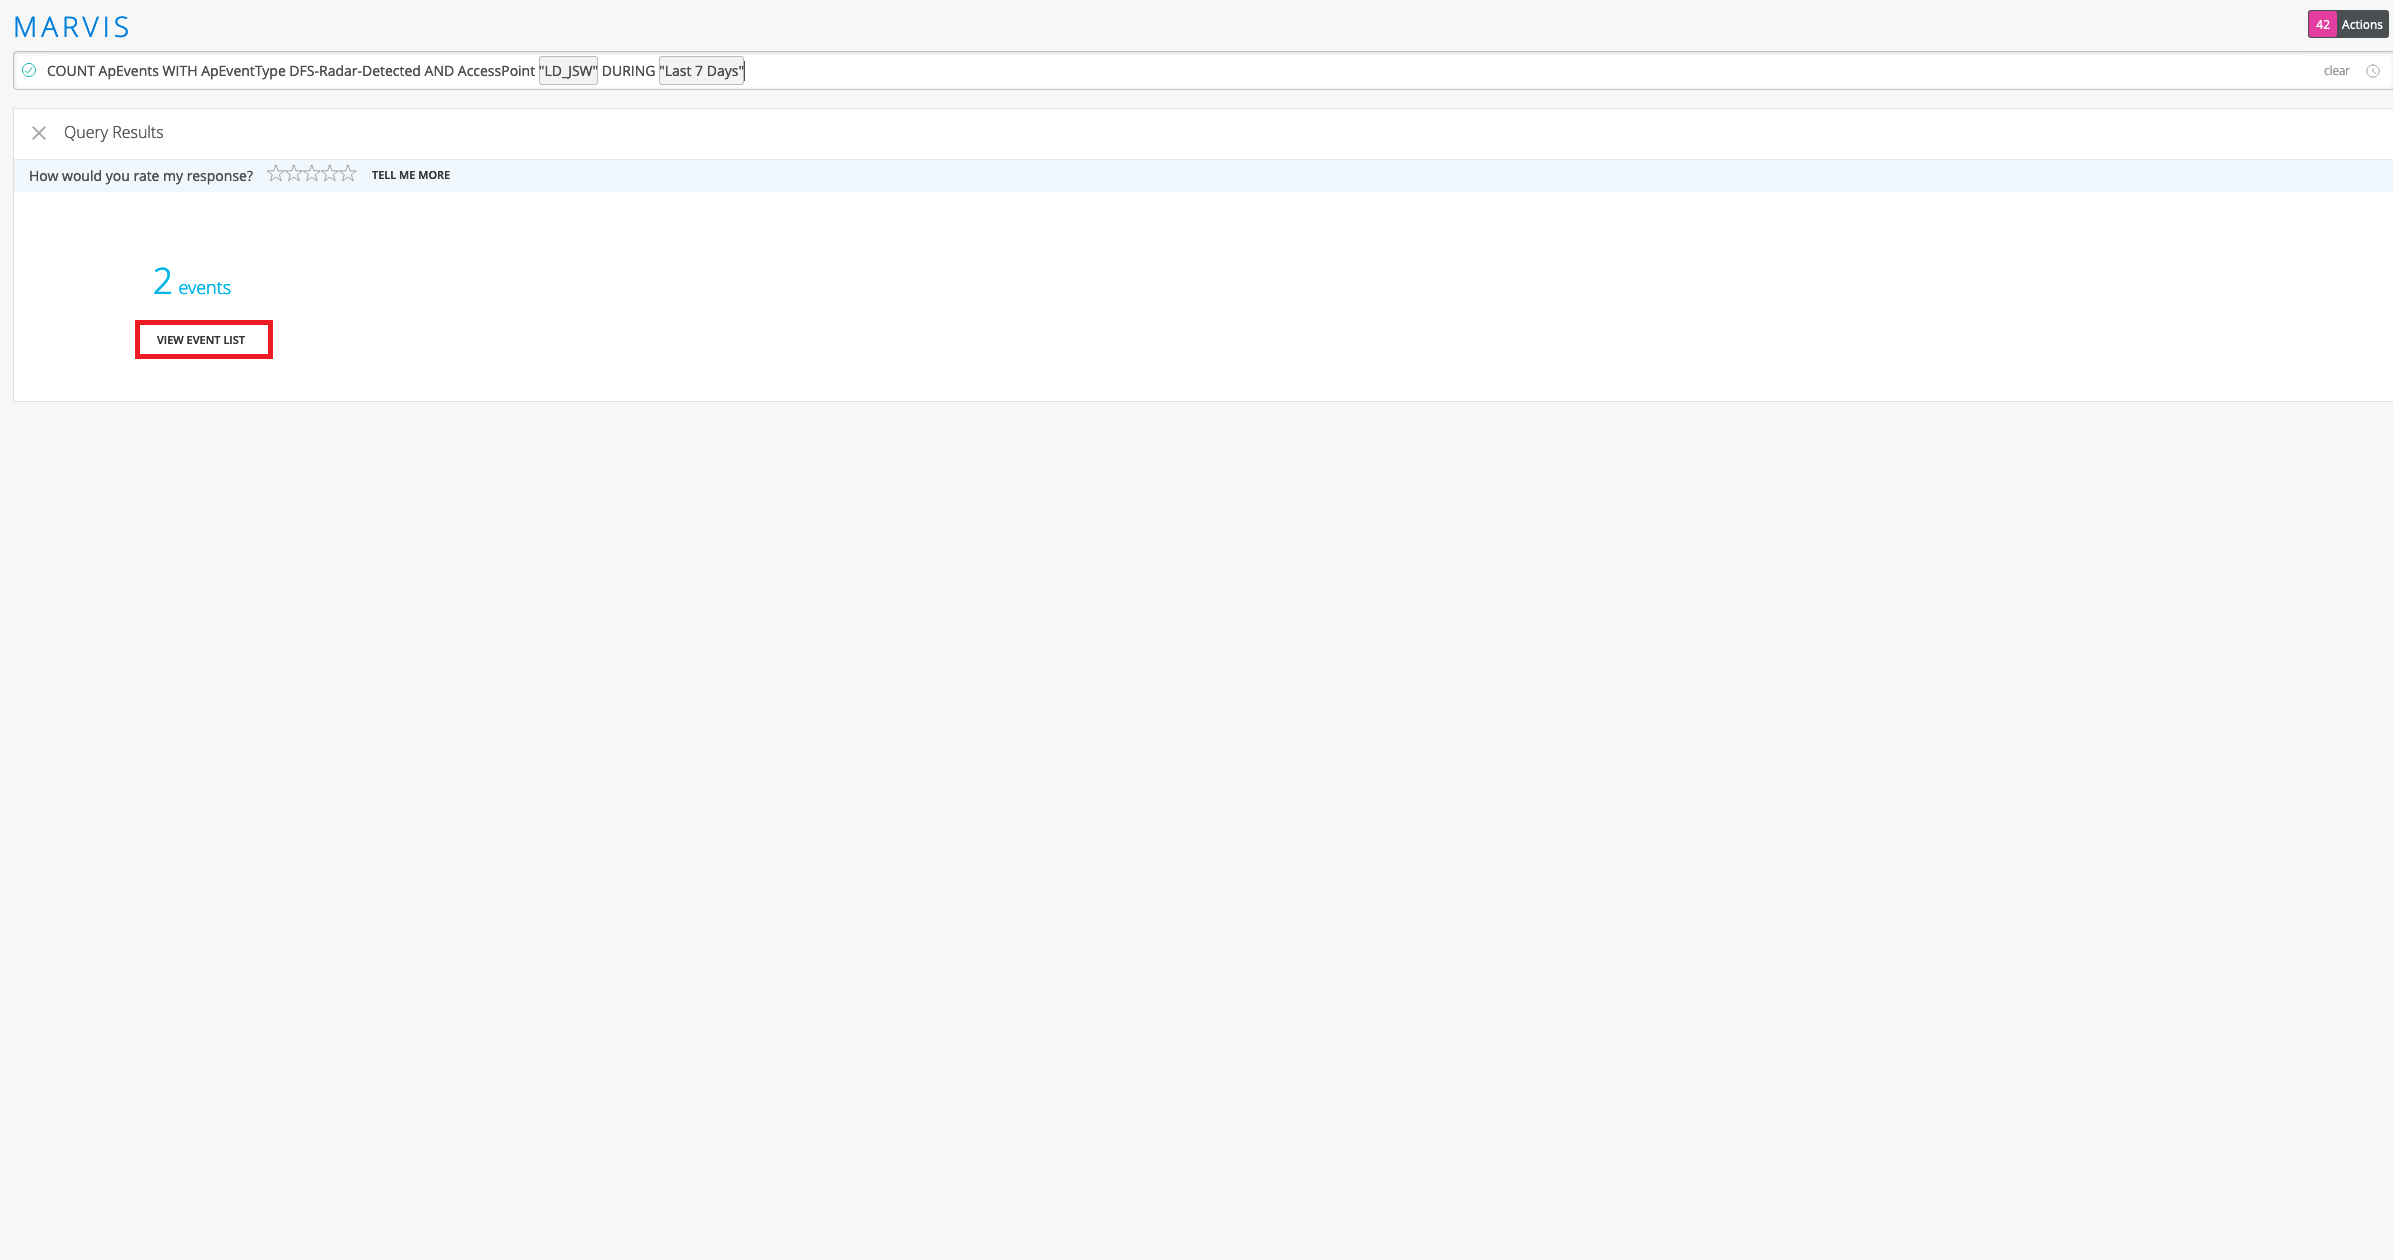
LIST クエリに加えて、COUNT クエリを使用して、クエリに一致するイベントまたはデバイスのカウントを取得できます。COUNT クエリは、LIST クエリと同じ構造を使用します。以下は、COUNT クエリの出力例を示すスクリーンショットです。 イベントリストを表示 をクリックすると、イベントの詳細を確認できます。
クライアントのローミング詳細の表示
ROAMINGOFクエリを使用すると、異なるAP間でローミングしているクライアントのグラフィカルビューを見ることができます。
ROAMINGOF <client name> DURING <time interval>
クライアントのステータスの表示
STATUSOF クエリは、サイトまたは 無線LAN (WLAN) で接続の問題に直面しているクライアントの概要を提供します。クエリ出力には、問題が最も多いクライアント順に、クライアントのランク付けされたリストが表示されます。このクエリを使用すると、サイト内で接続の問題に直面しているクライアントをすばやく特定できます。トラブルシューティングセッションの開始時にこのクエリを使用して、影響を受けるクライアントを特定できます。その後、クライアントの詳細をドリルダウンして、問題の根本的原因を見つけることができます。クライアントをクリックしてサービスレベルやインサイトを確認したり、Marvisでトラブルシューティングクエリーを開始したりできます。
STATUSOF Clients WITH Site <site name>
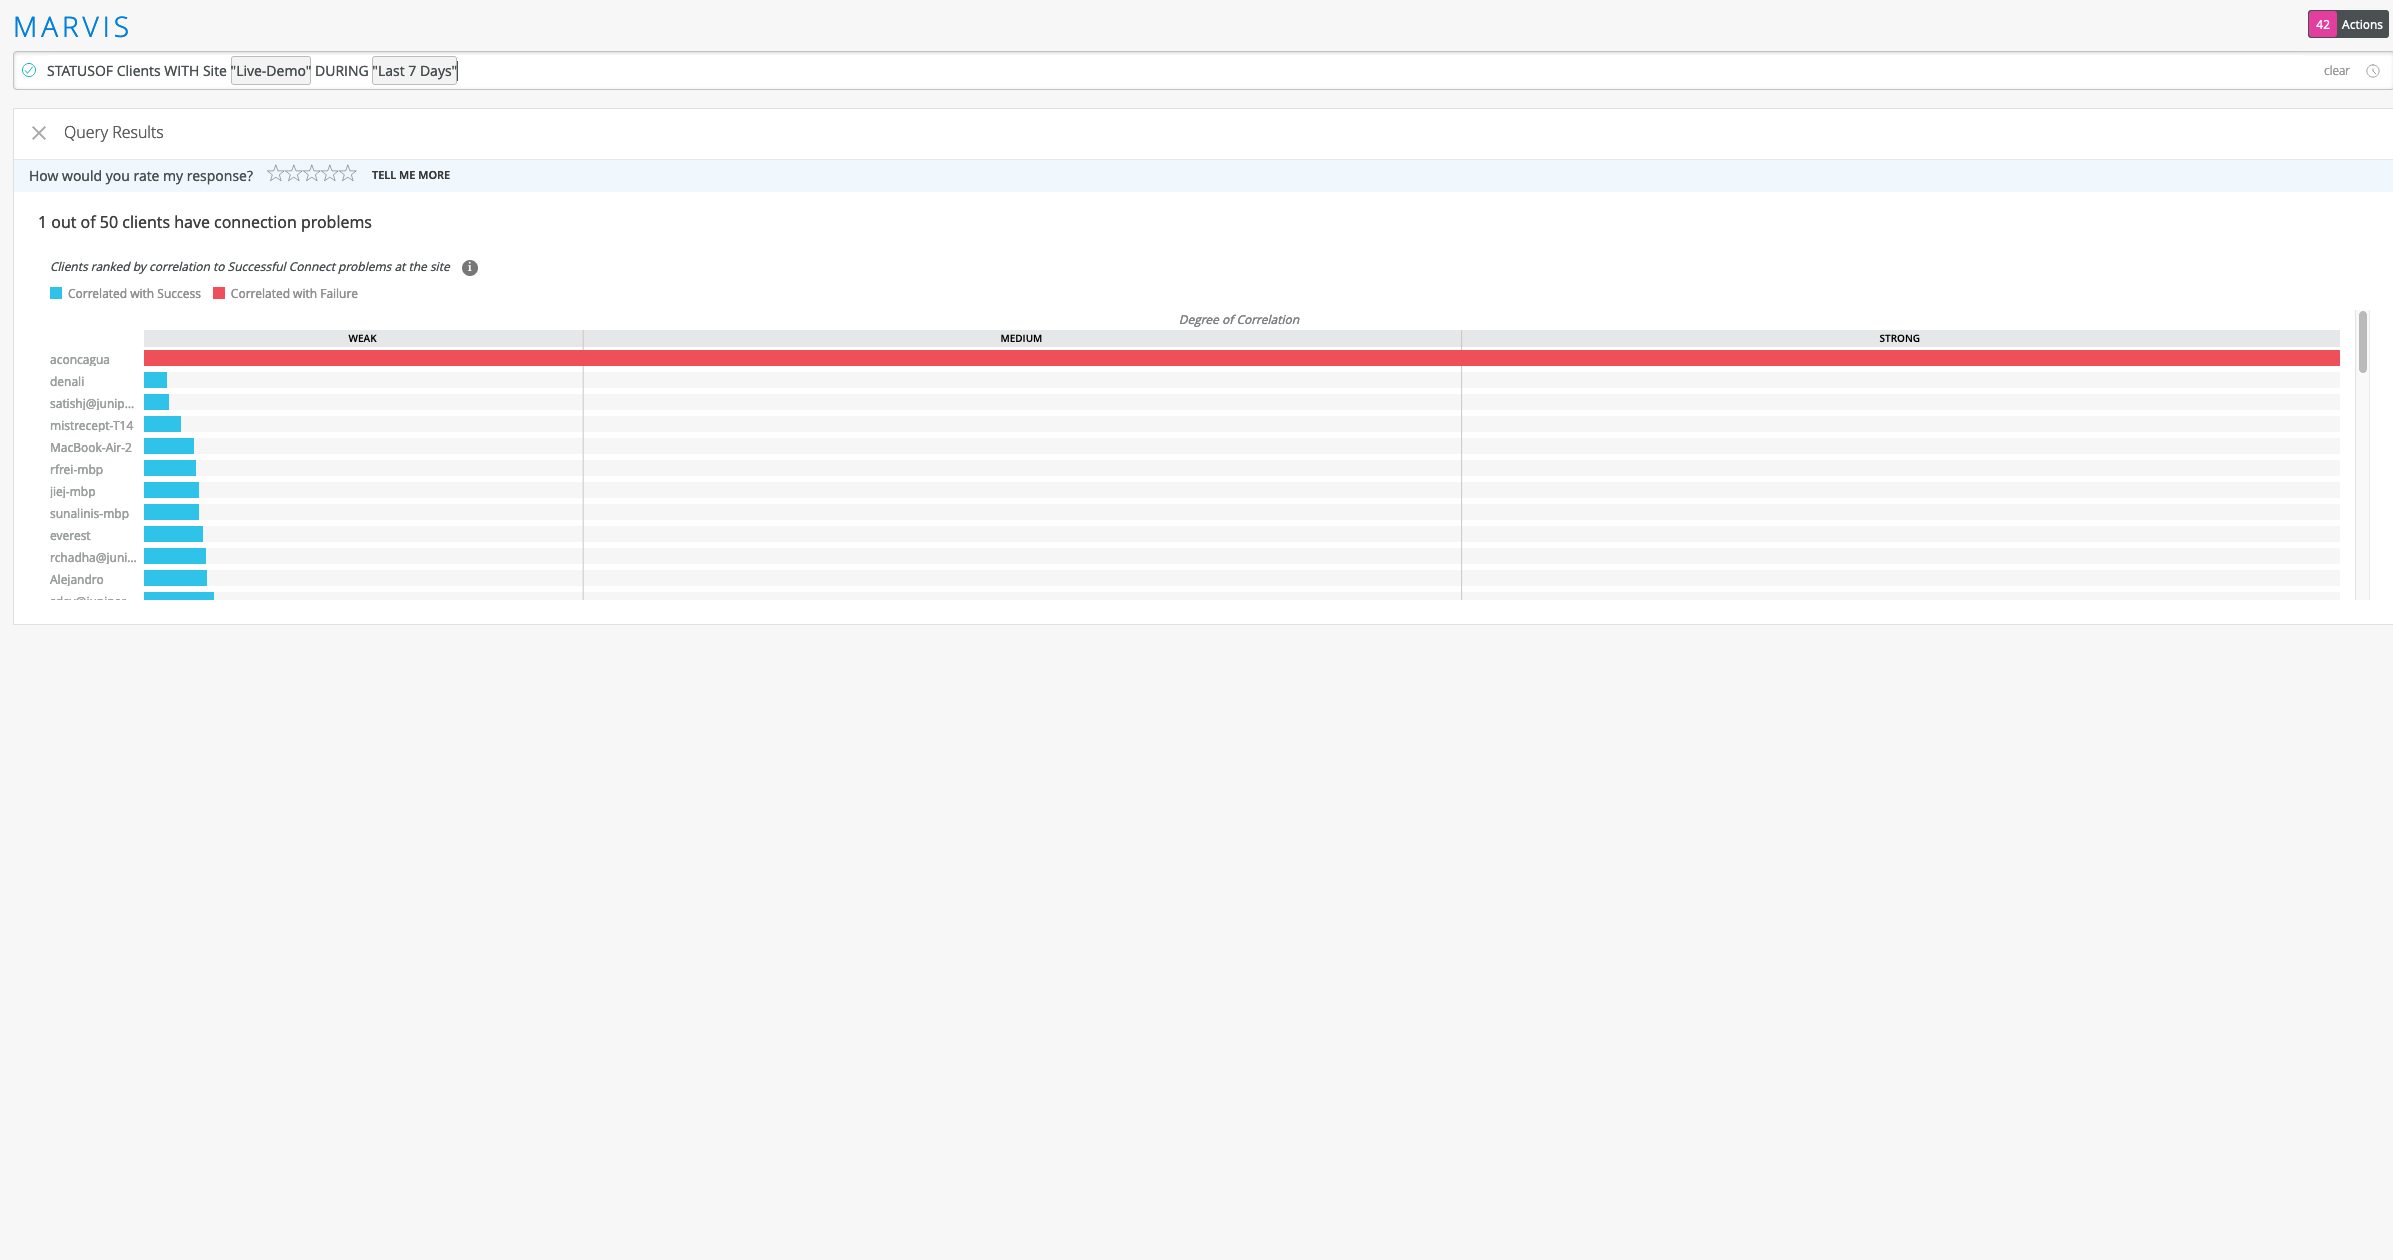
また、カバレッジの問題、スループットの問題、接続の問題など、特定の問題に直面しているクライアントを表示することもできます。たとえば、クエリ STATUSOF Clients WITH Problem Capacity には、組織内で容量の問題が発生しているすべてのクライアントが一覧表示されます。
AP、サイト、またはクライアントのトラブルシューティング
表3は 、サイト、クライアント、またはAPのトラブルシューティングに使用できるいくつかのTROUBLEHOOTクエリを示しています。
| トラブルシューティングが必要な場合 | 使用する |
|---|---|
| クライアント、AP、またはサイト | TROUBLESHOOT <client/site/AP name> |
| 接続の問題に直面している無線クライアント、AP、またはサイト | TROUBLESHOOT <client/site/AP name> WITH Problem SlowToConnect
TROUBLESHOOT <client/site/AP name> WITH Problem UnableToConnect |
| 特定の期間にわたって接続の問題に直面している無線クライアント、AP、またはサイト | TROUBLESHOOT <client/site/AP name> WITH Problem UnableToConnect DURING <time duration> |
次のスクリーンショットは、 TROUBLESHOOT <site name> WITH Problem UnableToConnect クエリの出力を示しています。Marvisから、問題の原因、帯域、問題が発生したWLANなどのデータが表示されます。

各カテゴリをクリックすると、詳細にドリルダウンできます。サービス レベル カテゴリをクリックすると、次のスクリーンショットに示すように、Marvisに問題の詳細が表示されます。
AP、サイト、またはクライアントの特定
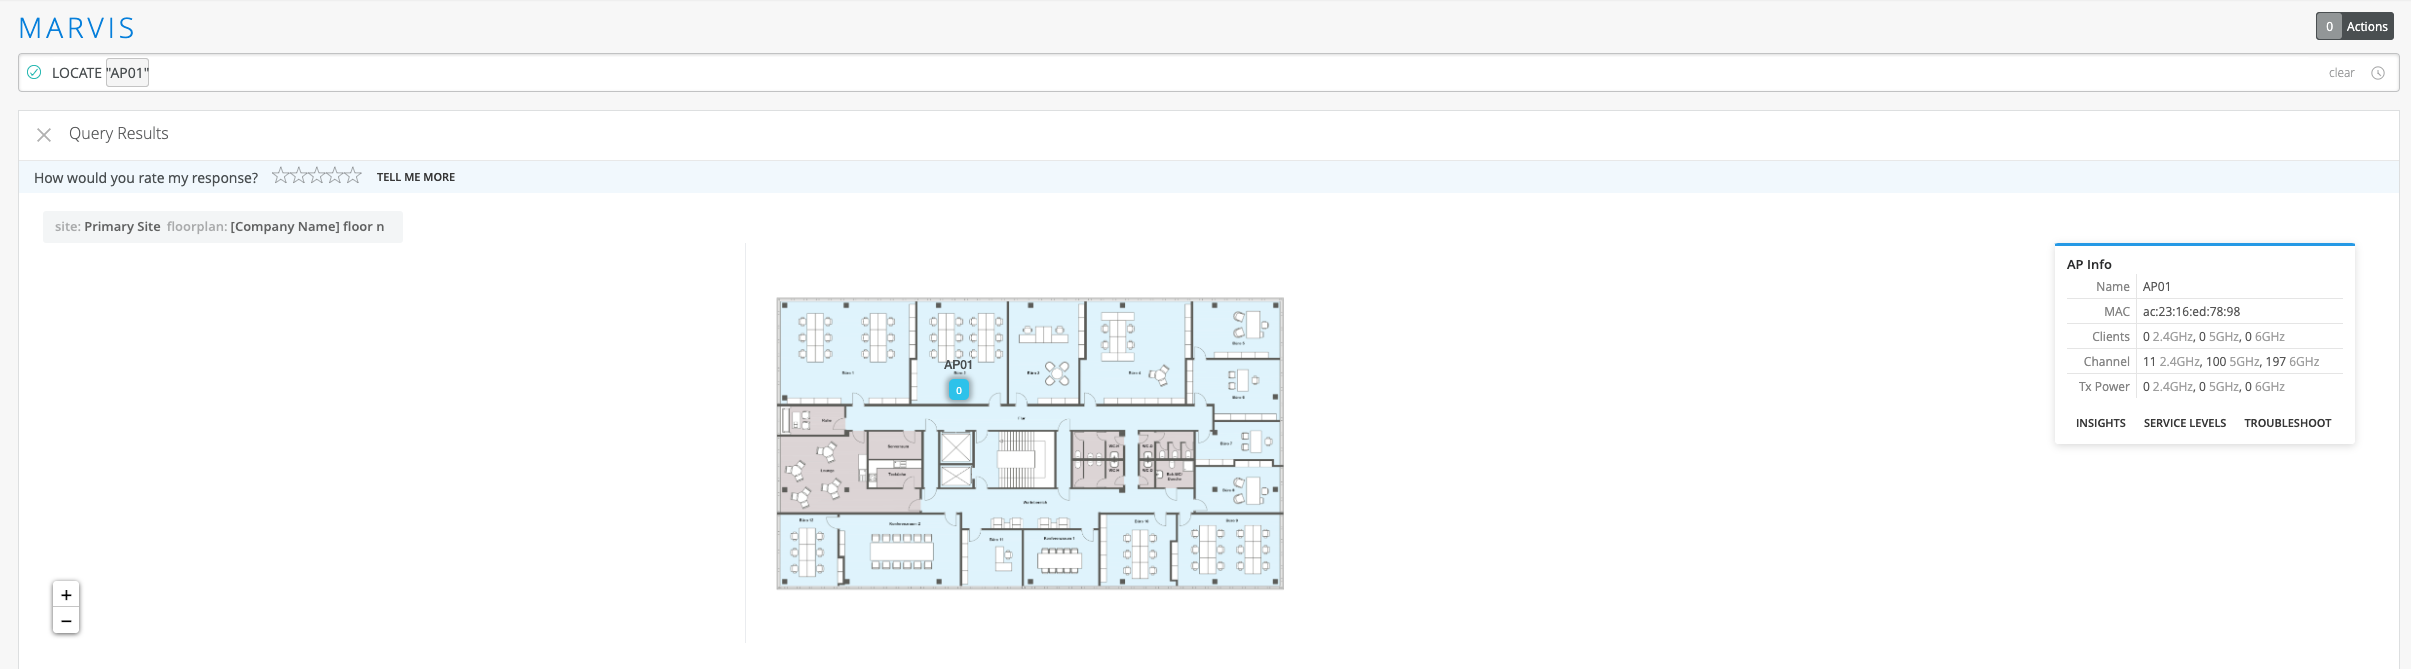
LOCATE クエリを使用して、サイト、AP、またはクライアントを検索できます。クエリ出力には、 組織>サイト設定で設定したサイトの場所のマップビューが表示されます。APとクライアントの場合、Marvisはこれらのデバイスの場所をフロアプランに表示します。Marvisには追加情報も表示され、インサイト、サービスレベル、トラブルシューティングページへのリンクも提供されます。
APのチャネル使用率の表示
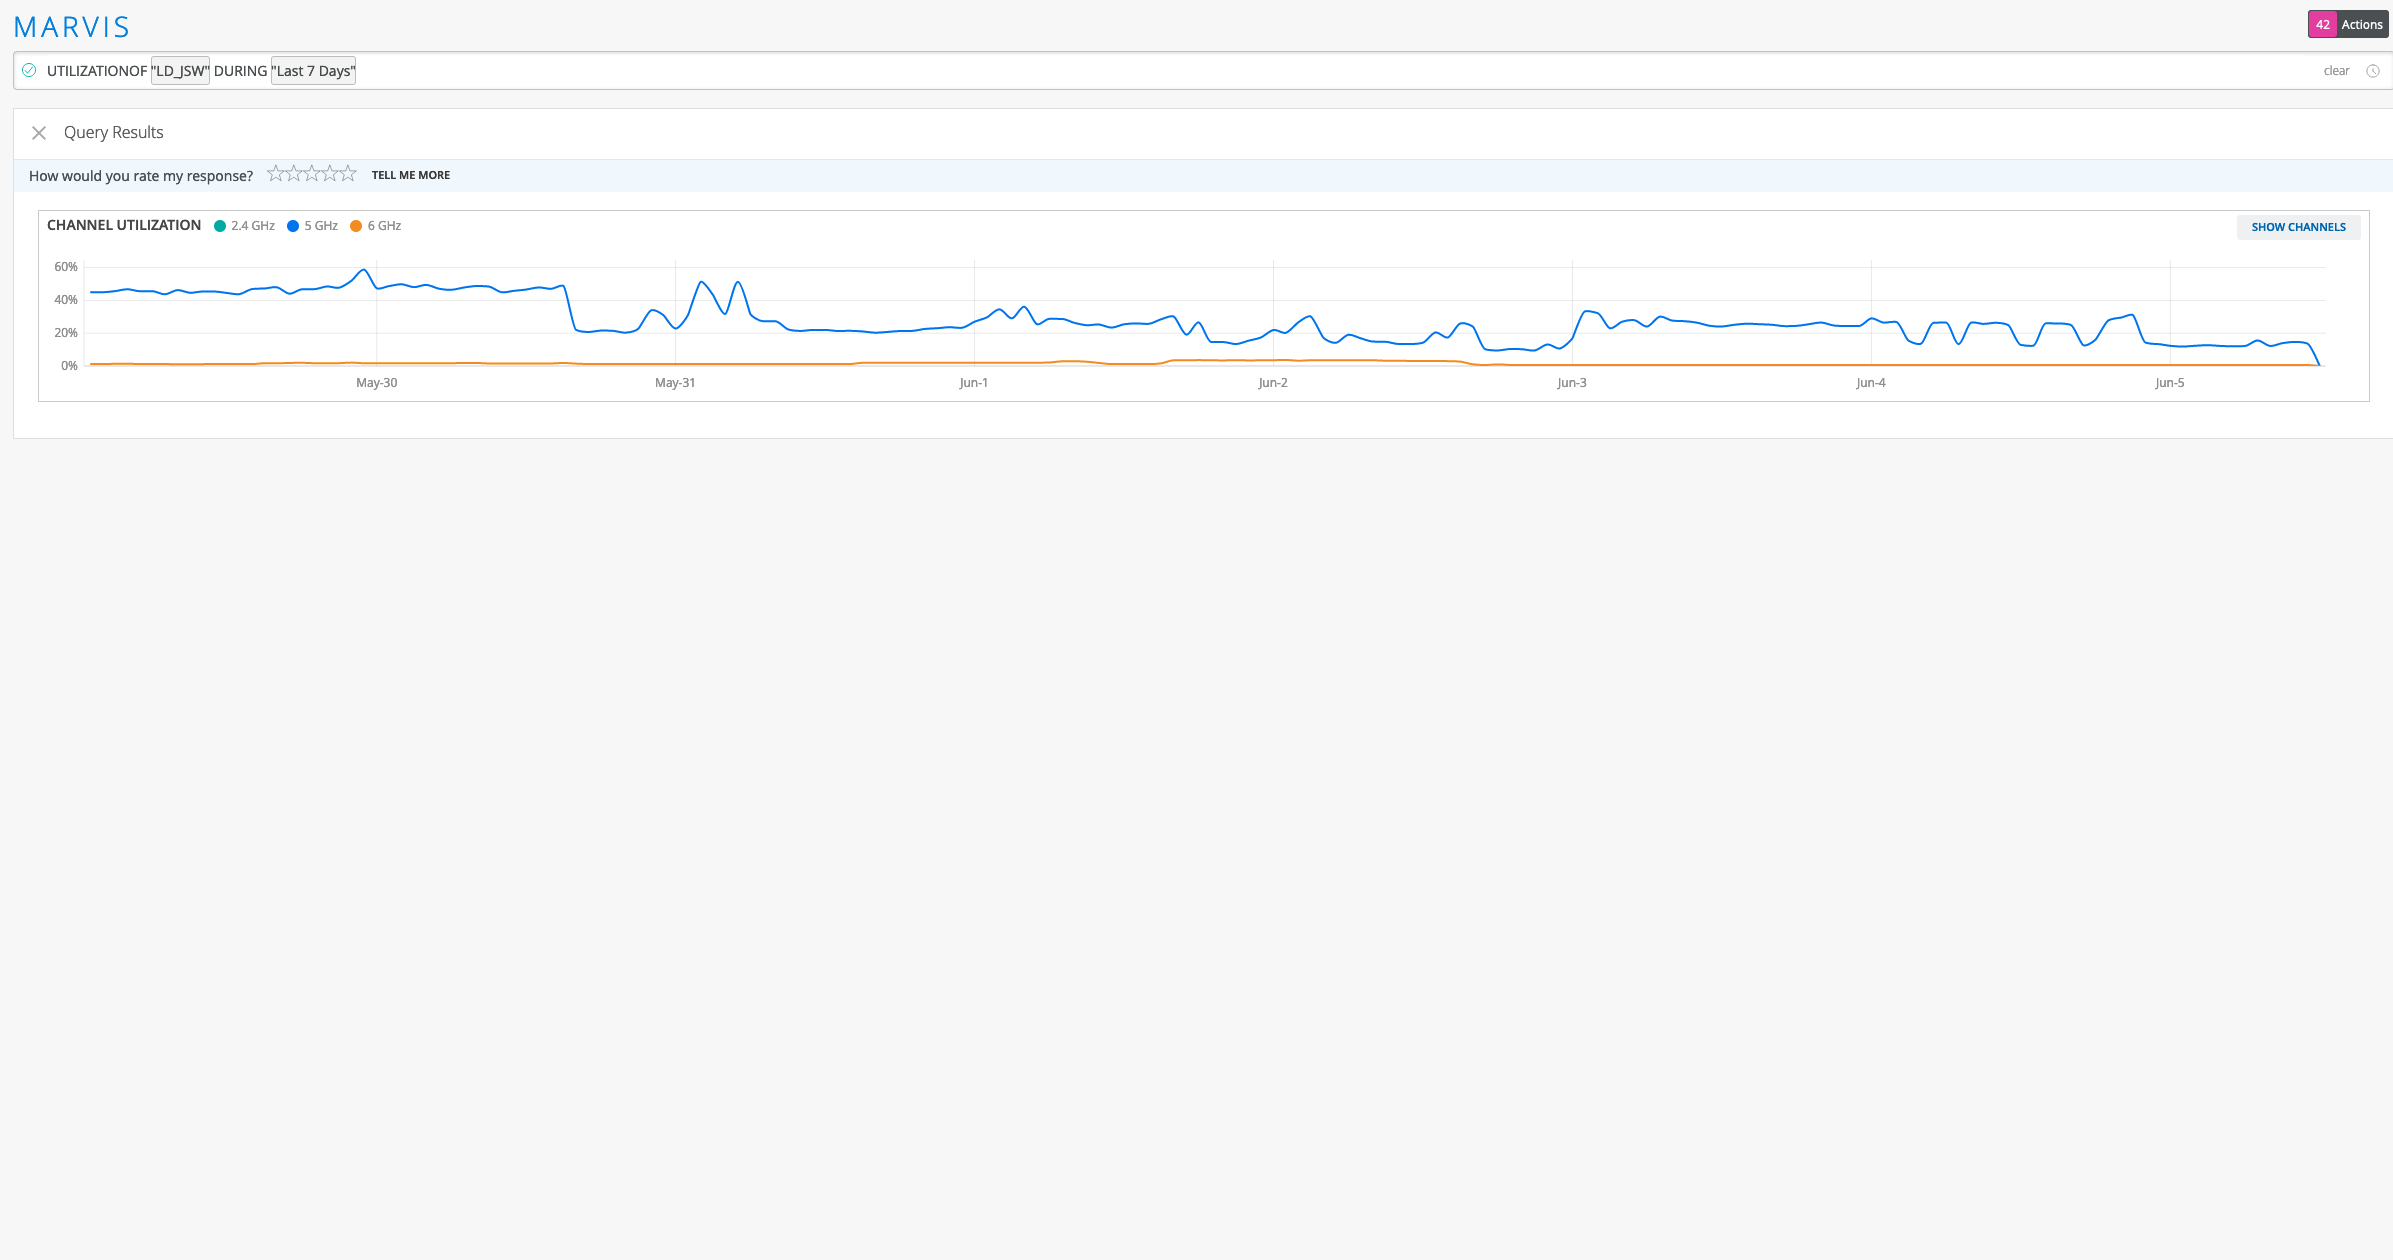
UTILIZATIONOF クエリーを使用して、APがブロードキャストしているチャネルと、2.4 GHz、5 GHz、6 GHz帯域の使用レベルを表示できます。 チャネルを表示をクリックすると 、APが使用するすべての特定のチャネルの内訳を確認できます。