Marvis対話型アシスタント(エージェント型AIを使用した拡張版)

Marvis対話型アシスタントの使用を開始すると、ネットワークに関する情報を取得し、問題を特定してトラブルシューティングできます。

AIドリブンなMarvis対話型アシスタントは、問題の特定、ネットワークテレメトリ分析、的を絞った是正措置の推奨を通じて第一レベルの支援を提供することで、インテリジェントなトラブルシューティング支援として機能します。これらの機能により、診断ワークフローが合理化され、運用効率が向上し、問題解決時間が大幅に短縮されます。複数のワークフローエージェント、データソース、ツール、高度な自然言語処理を活用することで、Marvisはユーザーからのプロンプトを解釈し、意味のある診断アクションに変換します

Marvisは、収集したテレメトリデータから可能な限り多くのインサイトを浮かび上がらせるため、クエリに対して直接実用的な情報を得ることができます。対話型アシスタントは、迅速かつ効果的な分析に必要なすべてのものを統合して表示します。問題の説明や影響分析から、考えられる根本原因、推奨事項、傾向まで、対話型アシスタントは包括的な情報を提供します。その結果、複数のページを移動したり、情報をつなぎ合わせたりするのに多大な時間を費やす必要がなくなります。

対話型アシスタントを見つける

ジュニパー Mistポータルの左上隅または右下隅にあるMarvisアイコンをクリックします。 Ctrl + K を押して対話型アシスタントを開くこともできます。
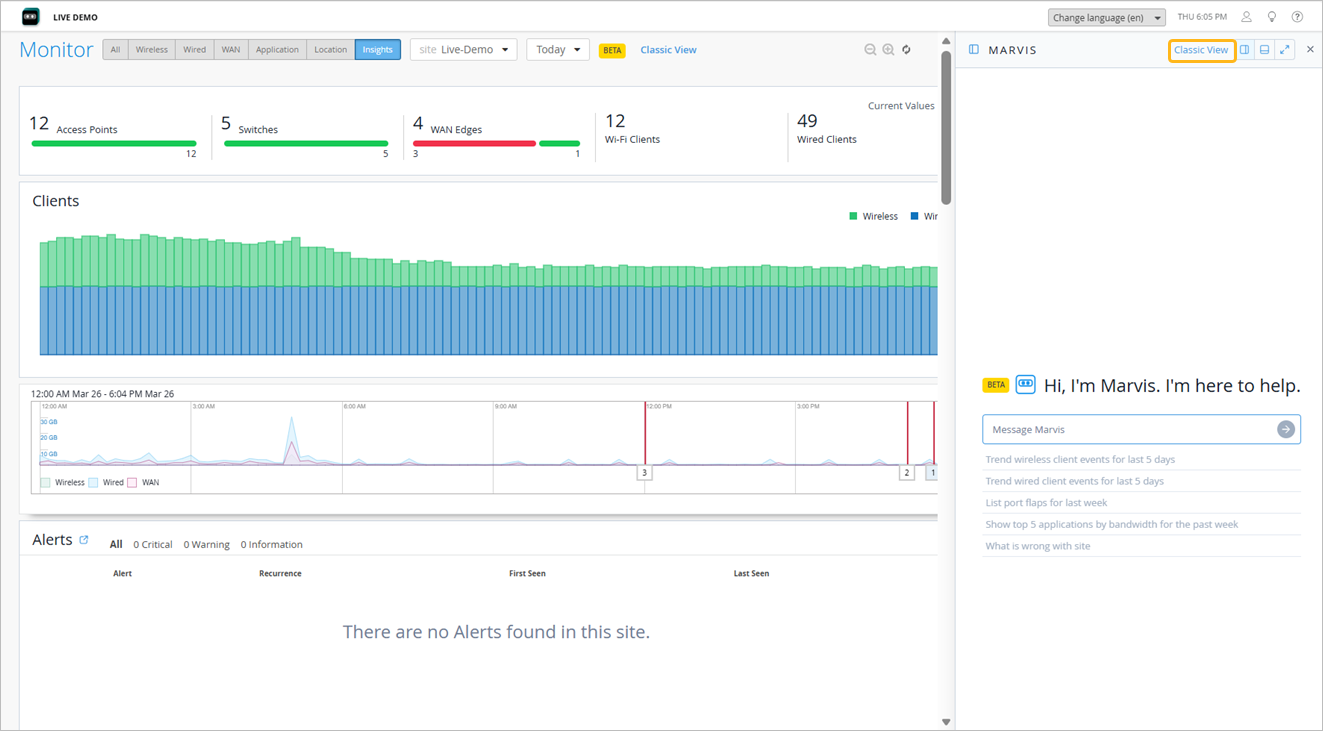
Network monitoring dashboard showing live demo site statistics: 12 access points, 5 switches, 4 WAN edges, 12 Wi-Fi clients, and 49 wired clients. Includes graphs for client counts and traffic trends, alerts section showing no issues, and Marvis assistant suggesting network queries.

ページの右上隅にあるリンクを使用して、以前のビュー(クラシックビュー)に切り替えることもできます。拡張ビューに再度切り替える必要がある場合は、Marvisの対話型インターフェイスを最小化して、Marvisアイコンをもう一度クリックするだけです。

対話型アシスタント ウィンドウを画面の下部または右側にドッキングして、常に表示を維持できます。これにより、対話型アシスタントウィンドウを表示したまま、Mistポータル上のページを移動できます。一部のデバッグ回答には、新しいタブで開くリンクが埋め込まれているため、元のMarvisの対話型インターフェイスが現在のタブで開いたままになります。右上隅のアイコンを使用して、ウィンドウをドッキングします。ウィンドウがドッキングされると、Mistはドッキングされた場所を自動的に保存します。境界線をドラッグしてウィンドウのサイズを変更することもできます。

User interface with MARVIS text, Classic View option, highlighted grid and list view icons, maximize arrow icon, and close button X for layout toggling.

Mistポータルからログアウトして再度ログインすると、ウィンドウは最後のサイズとドッキングされた場所(下または右)が保持されます。

Marvis対話型インターフェイスのプロンプトを作成するためのガイドライン

これらのガイドラインに従って、AI アシスタントが正確なインサイトを提供し、効果的なトラブルシューティングを実行し、実用的な推奨事項を提供できるようにすることをお勧めします。

ガイドライン 使用例
知りたいことや解決したいことを明確かつ簡潔に説明することで、Marvisがリクエストをより適切に解釈するのに役立ちます。適切に構成されたクエリは、ユーザーが探している情報なのか、ネットワークの可視性なのか、または問題診断のサポートなのかをMarvisが判断するのに役立ちます。
  • イーサネット速度が遅いデバイスを表示する

  • 無線パフォーマンスの低下を調査する

  • サイトサイト名の何が問題なのか

  • 802.1xでWLANを設定する方法

影響を受ける範囲に関する詳細(サイト名、クライアント情報、デバイス情報など)により、Marvisは分析を絞り込み、焦点を絞ることができます。デフォルトでは、Marvisは24時間とみなします。関連する時間範囲を含めることで、応答をさらに絞り込むことができます。
  • 過去24時間以内のStore-001サイトでのAPの問題

  • Core-Switch-01のどうした問題なのか

  • 過去7日間にサイトで発生したすべての不良無線クライアントイベントを表示 Store-001

特定のコマンドを必要とせずに自然言語を使用できます。わかりやすくするために、一度に 1 つの主要な質問を行い、フォローアップの質問を使用してクエリを絞り込むことをお勧めします。
  • WLAN SSID001で認証エラーはありますか?

  • WLAN SSID01の認証失敗イベントを表示

  • 過去 24 時間以内にクライアントが SSID Corp-WiFi で DHCP に失敗するのはなぜですか?

効果的なトラブルシューティングでは、症状が重要な役割を果たします。症状や問題を明確かつ詳細に説明することで、Marvisはより焦点を絞った正確な対応を行うことができます。
  • クライアントがサイトでIPアドレスを受信していません Store-001

  • 現場でAPが頻繁に切断される Store-001

  • 現場のピーク時の速度が遅い Store-001

Marvisの対話型インターフェイスのプロンプトの例

さまざまなプロンプトに対して生成された回答の例をいくつか示します。これらの例は、必要な情報を取得するためにプロンプトを構成して使用する方法を理解するのに役立ちます。

  • 不正なクライアントイベントの傾向と進行状況を経時的に追跡します。

    プロンプト: 過去7日間の不正なクライアントイベントの傾向
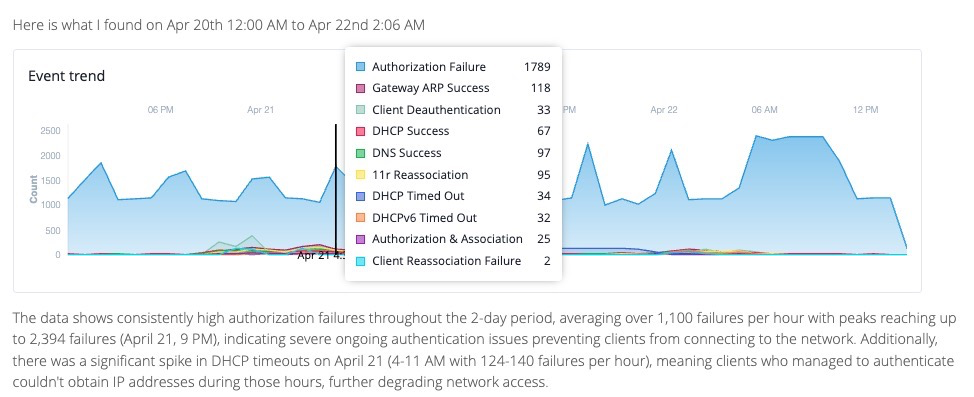
    Event trend graph showing network events over April 20-22. Authorization failures peaked at 2394 on April 21 at 9 PM, indicating persistent authentication issues. DHCP timeouts spiked on April 21 from 4-11 AM, impacting network access.

    フォローアップクエリを使用して、結果をフィルター処理できます。例えば、認証失敗を除外した出力を次に示します。

    Data analysis report on wireless client events over two days, highlighting DHCP timeouts spiking to 140 events per hour on April 21st, causing severe network disruptions.
  • VPNパスダウンの問題が発生しているデバイスを特定します。

    プロンプト:VPNパスダウンの問題の影響を受けるデバイス
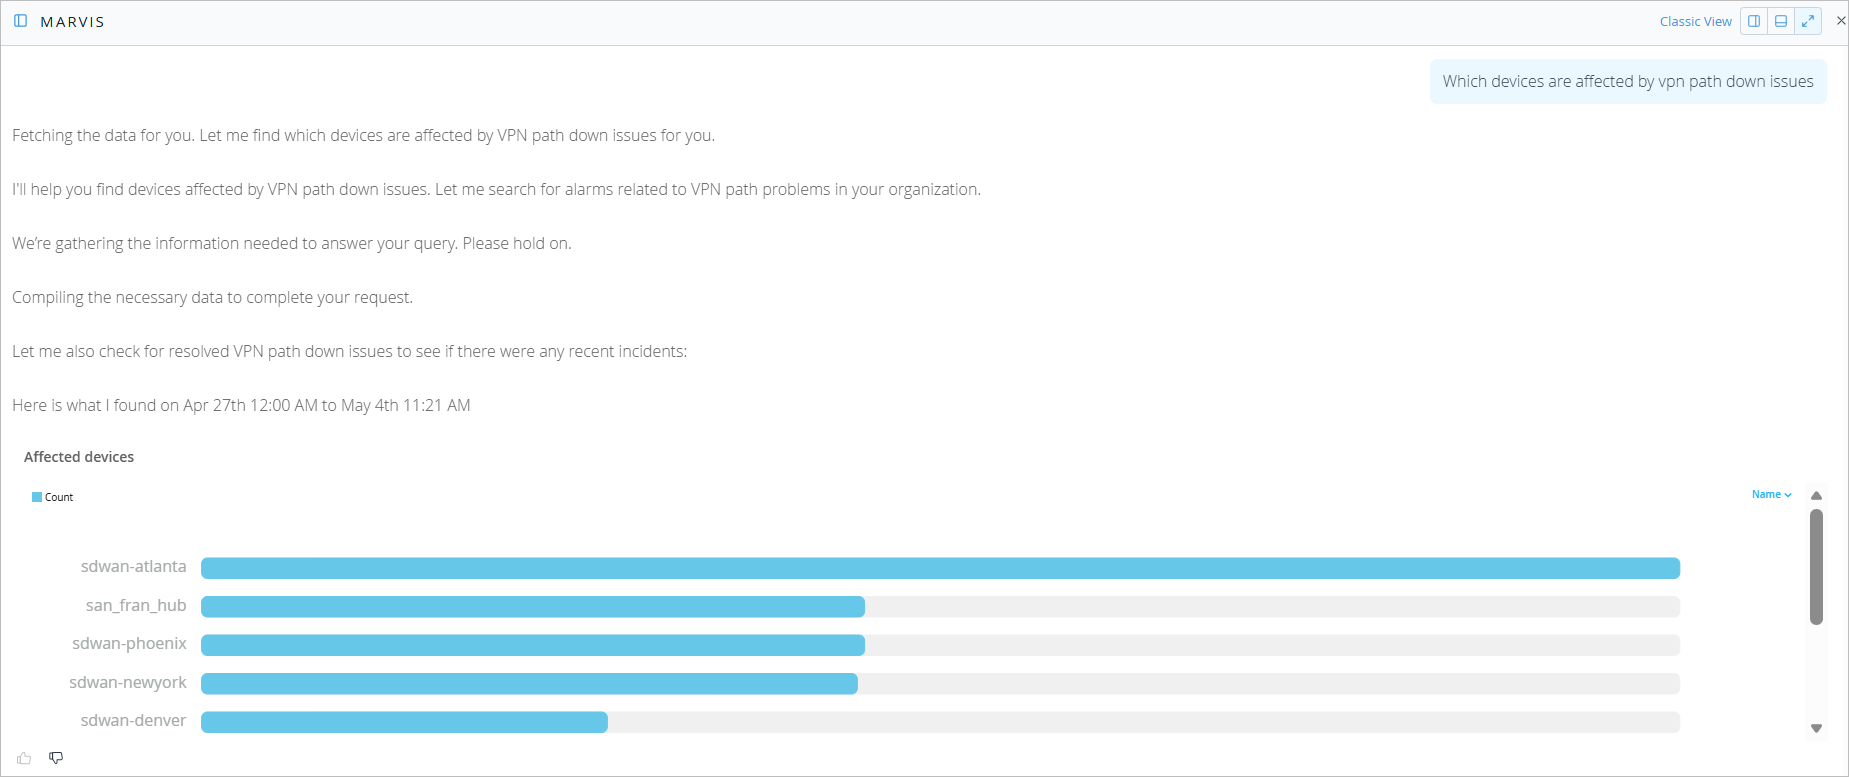
    Dashboard showing VPN path down issues analyzed by Marvis from April 27th, 12:00 AM to May 4th, 11:21 AM. Lists affected devices with issue counts: sdwan-atlanta, san_fran_hub, sdwan-phoenix, sdwan-newyork, sdwan-denver.

  • 特定のサイトで認証の問題を引き起こしている原因を特定します。

    プロンプト: クライアント everest-4 に認証の問題が表示される理由
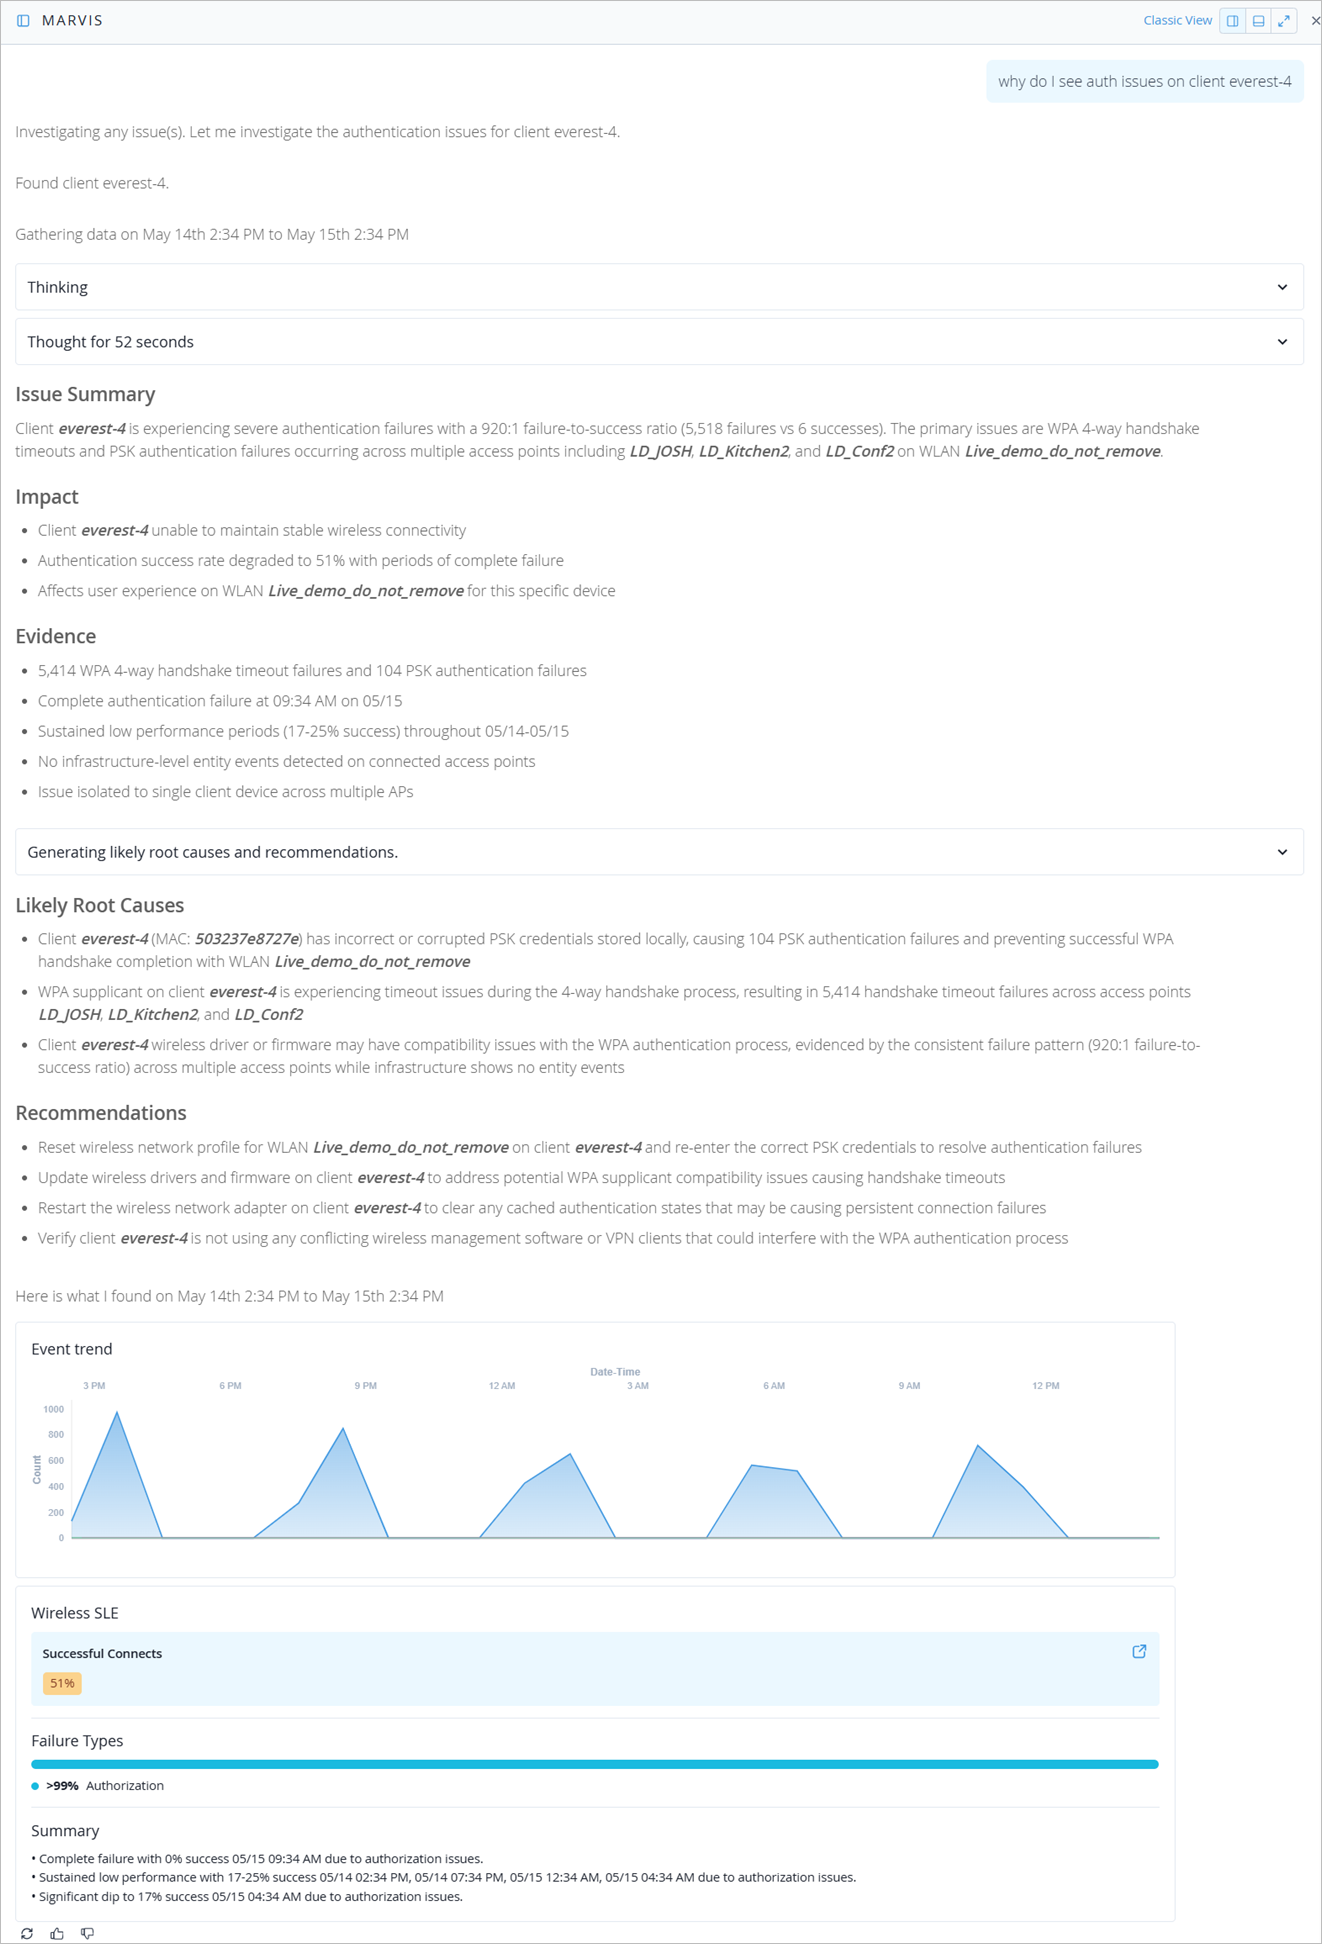
    Diagnostic report analyzing authentication issues for client device everest-4. Key findings: 920 to 1 failure-to-success ratio, major WPA handshake timeouts, PSK failures, and degraded connectivity. Recommendations include resetting PSK credentials, updating drivers, and clearing cache.

  • 特定のサイトで発生している問題を明確に理解することができます。

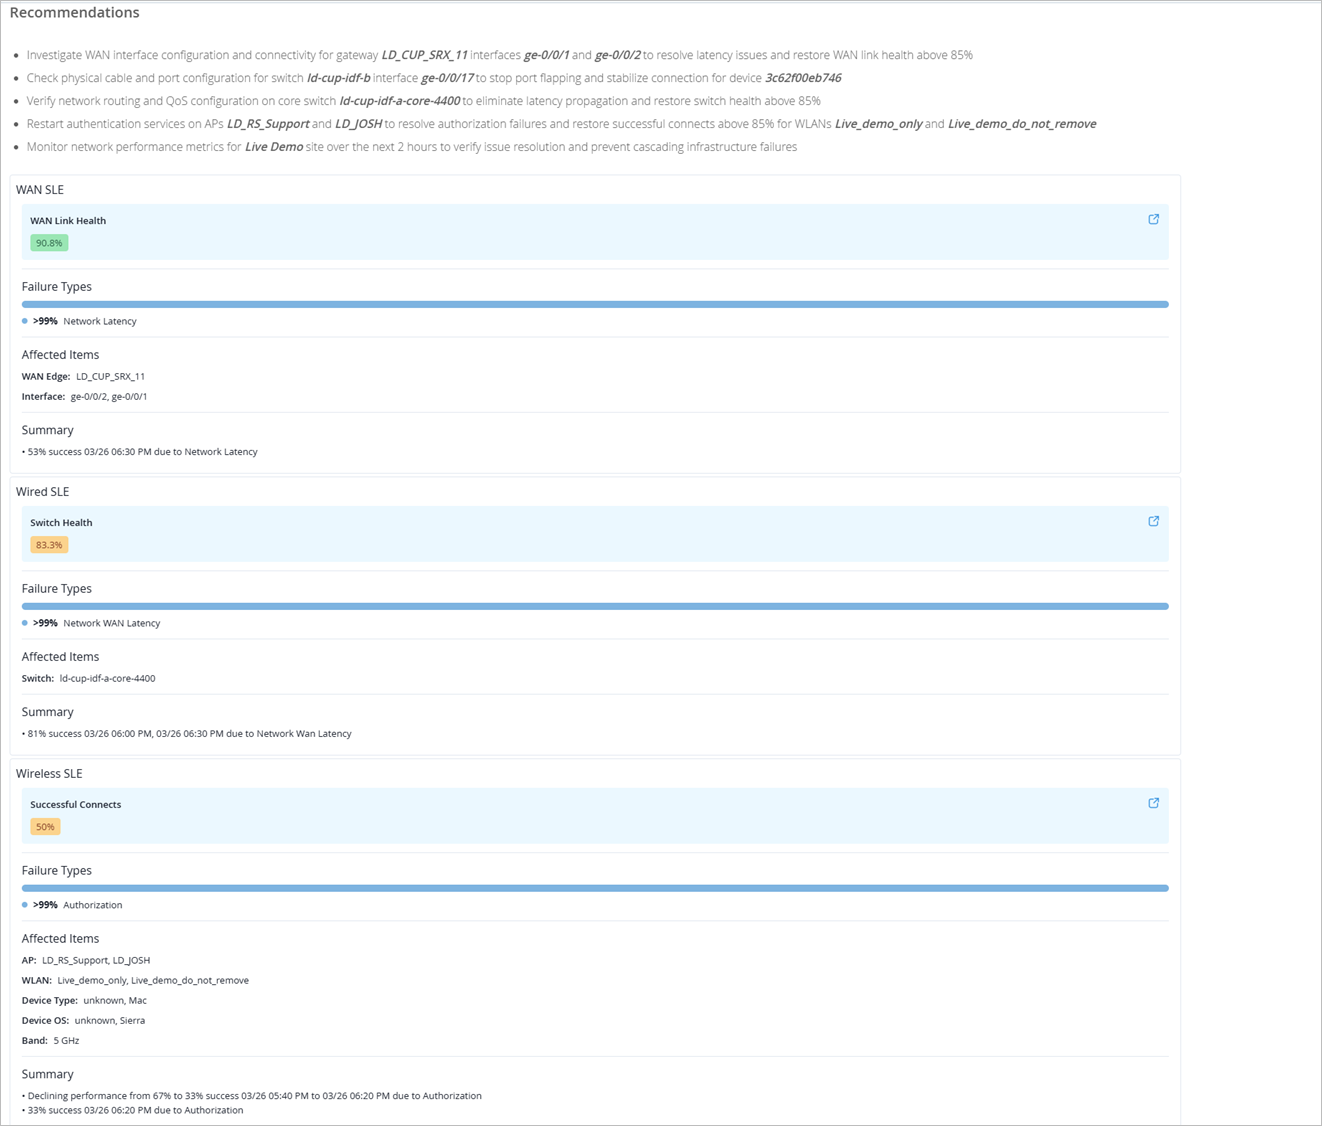
    プロンプト: 過去 60 分間にサイトのライブ デモで何が問題でしたか?
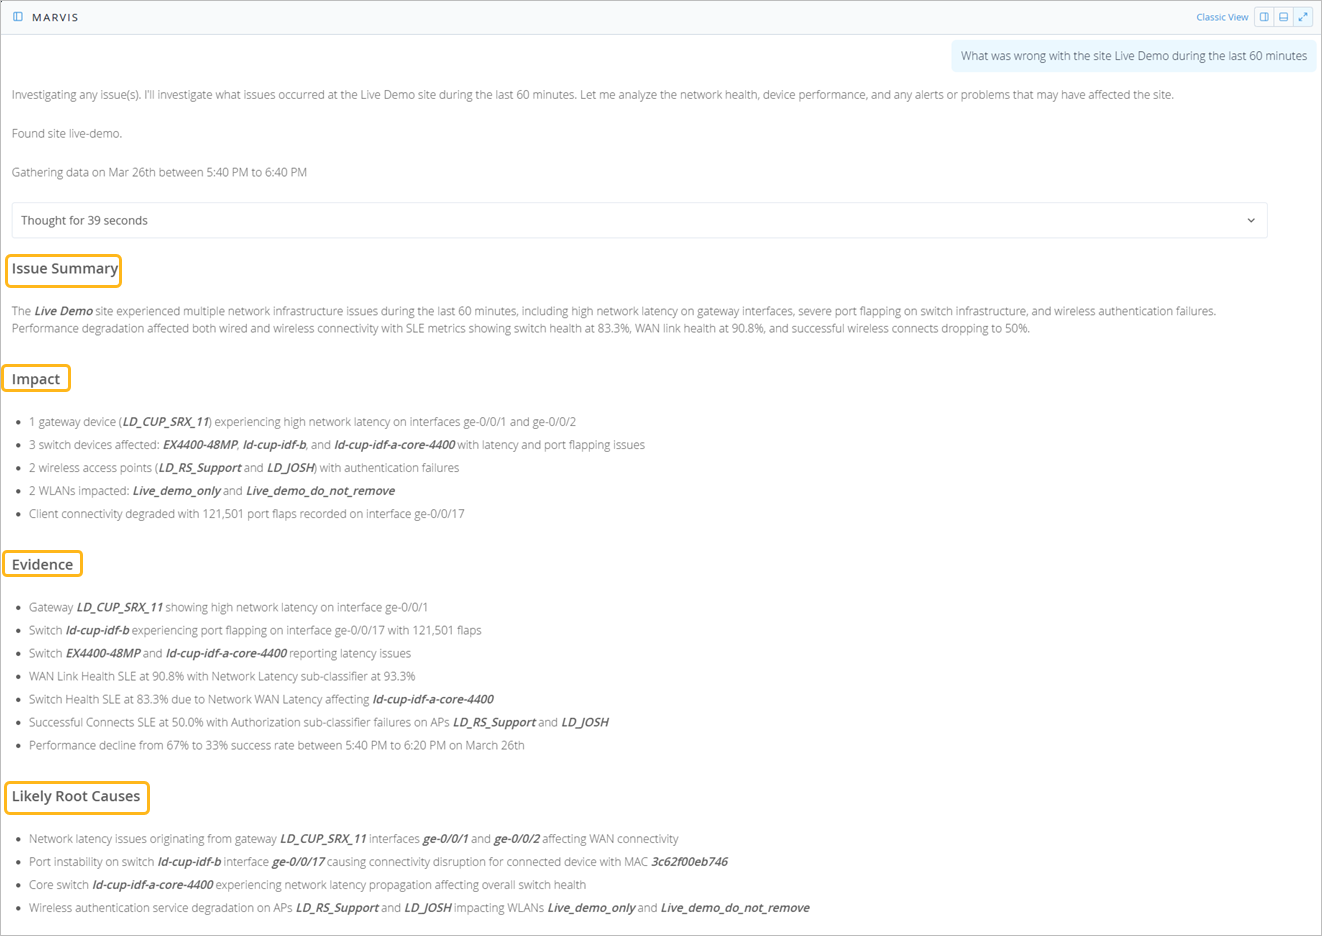
    Diagnostic report detailing network issues for Live Demo site, including high latency on gateway, port flapping on switches, wireless authentication failures, and performance degradation impacting wired and wireless connectivity. Lists affected devices, evidence of issues, and likely root causes such as gateway latency, switch instability, and wireless service degradation.

    Network performance report summarizing WAN, wired, and wireless metrics. Includes recommendations for latency resolution, WAN health at 90.9 percent, wired switch health at 83.3 percent, and wireless connection success at 50 percent. Highlights affected items and failure causes like latency and authorization issues.

  • クライアントのローミング履歴を表示します。

    プロンプト: 過去 7 日間のクライアント ZS-user106 のローミングを表示します

    Marvis interface showing 7-day roaming history of client ZS-user106 with a graph of AP associations, signal strength, roaming events marked by arrows and timestamps, and detailed event data including RSSI and channel.

  • 特定のサイトのスイッチに設定されているポートプロファイルのリストを表示します。

    プロンプト:list all port profiles on site live-demo
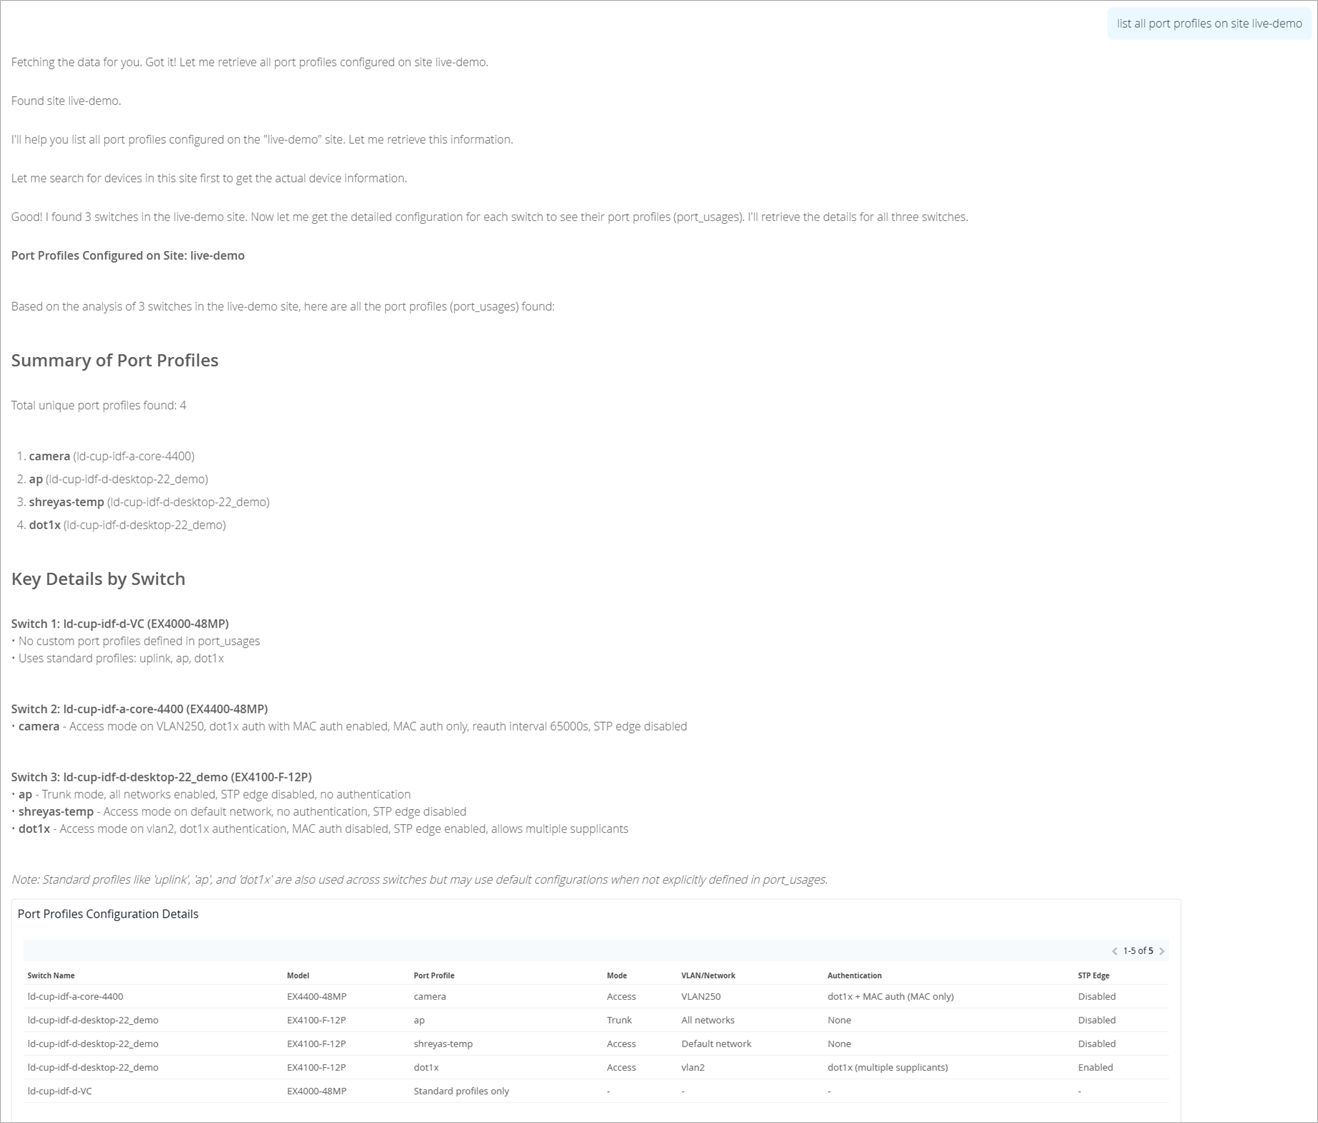
    Screenshot of a network management report showing port profiles at the live-demo site. Lists 4 unique profiles: camera, ap, shresys-temp, and dot1x. Details configurations for 3 switches, including VLAN and authentication settings. Used for network configuration and troubleshooting.

  • 帯域幅使用量別にしたアプリケーション上位5つを表示します。

    プロンプト: 過去 7 日間の帯域幅別上位 5 つのアプリケーションを表示
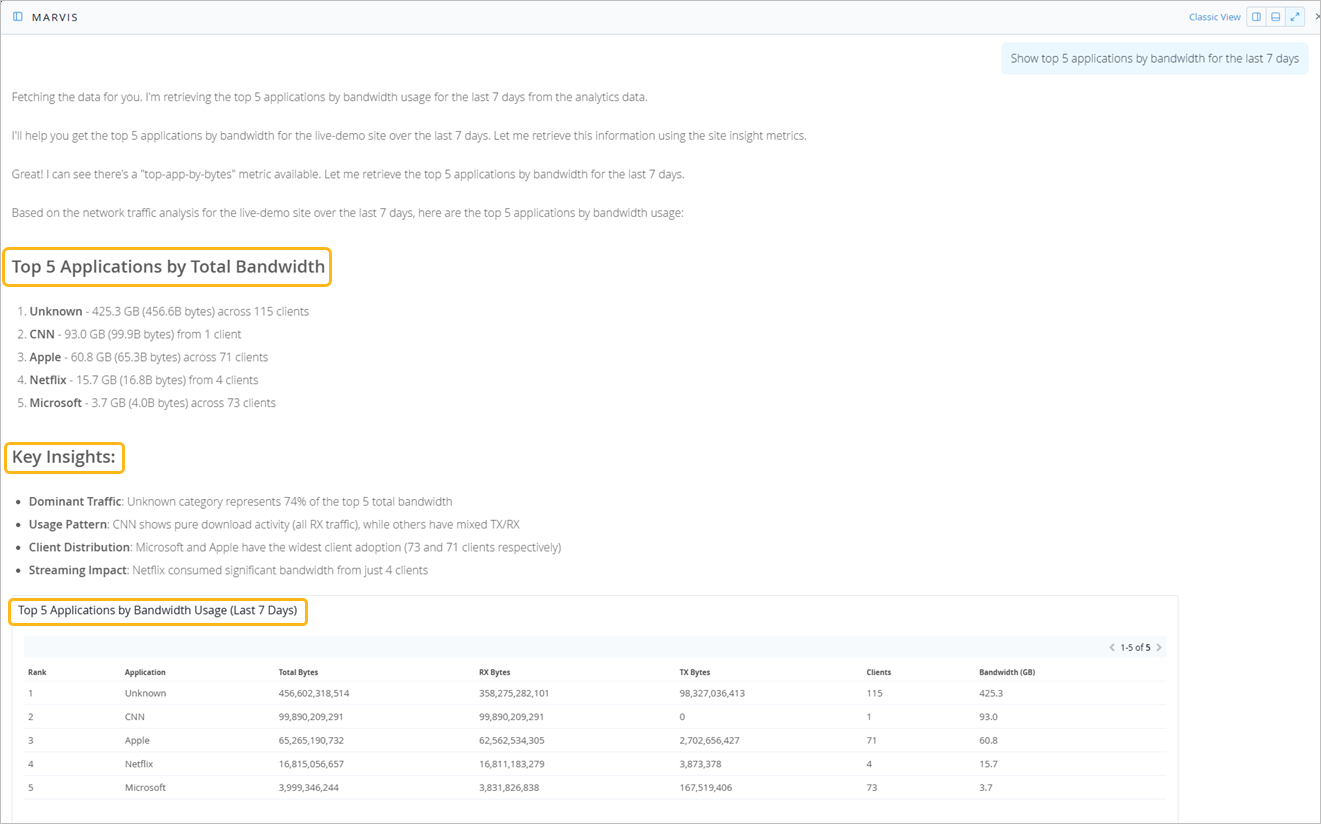
    Dashboard showing analytics of top 5 applications by bandwidth usage over 7 days: Unknown leads with 425.3 GB across 115 clients, followed by CNN, Apple, Netflix, and Microsoft. Key insights include dominant traffic from Unknown at 74 percent, CNN as pure download, and wide client adoption for Microsoft and Apple. Netflix has high bandwidth from 4 clients.

  • レーダーの問題を報告しているAPを表示する

    プロンプト:レーダーの問題を報告しているAPとそのチャネルはどれですか
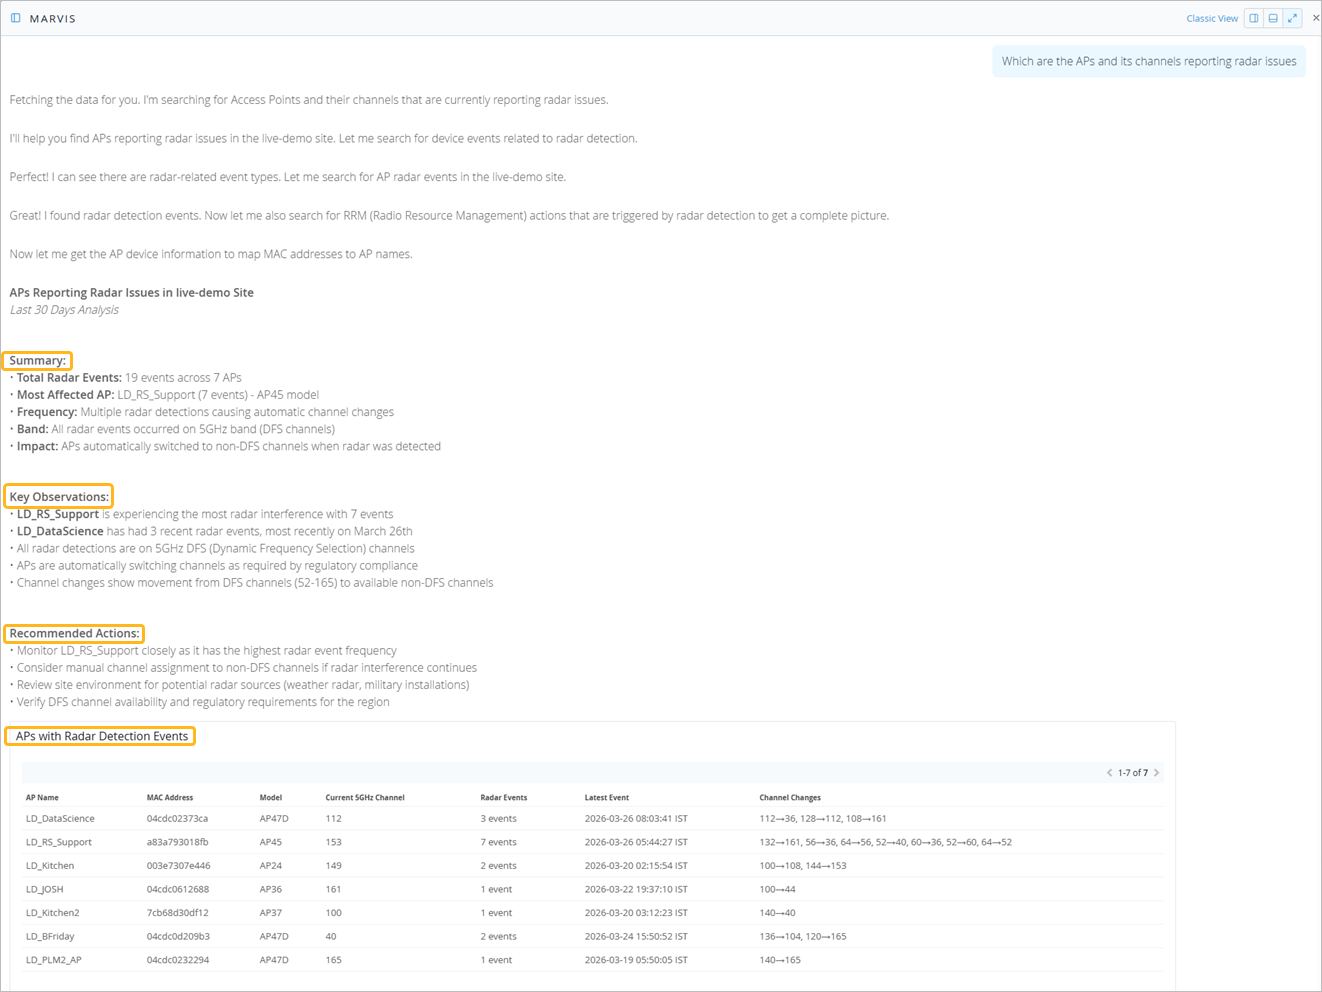
    Radar detection report for Access Points in a live-demo site, showing 19 radar events on 5GHz DFS channels, most affecting LD_RS_Support AP with 7 events. Includes summaries, key observations, and recommended actions for optimizing wireless network performance.

  • NACルールが正しく設定されているかを確認する

    プロンプト:NACルールを確認する
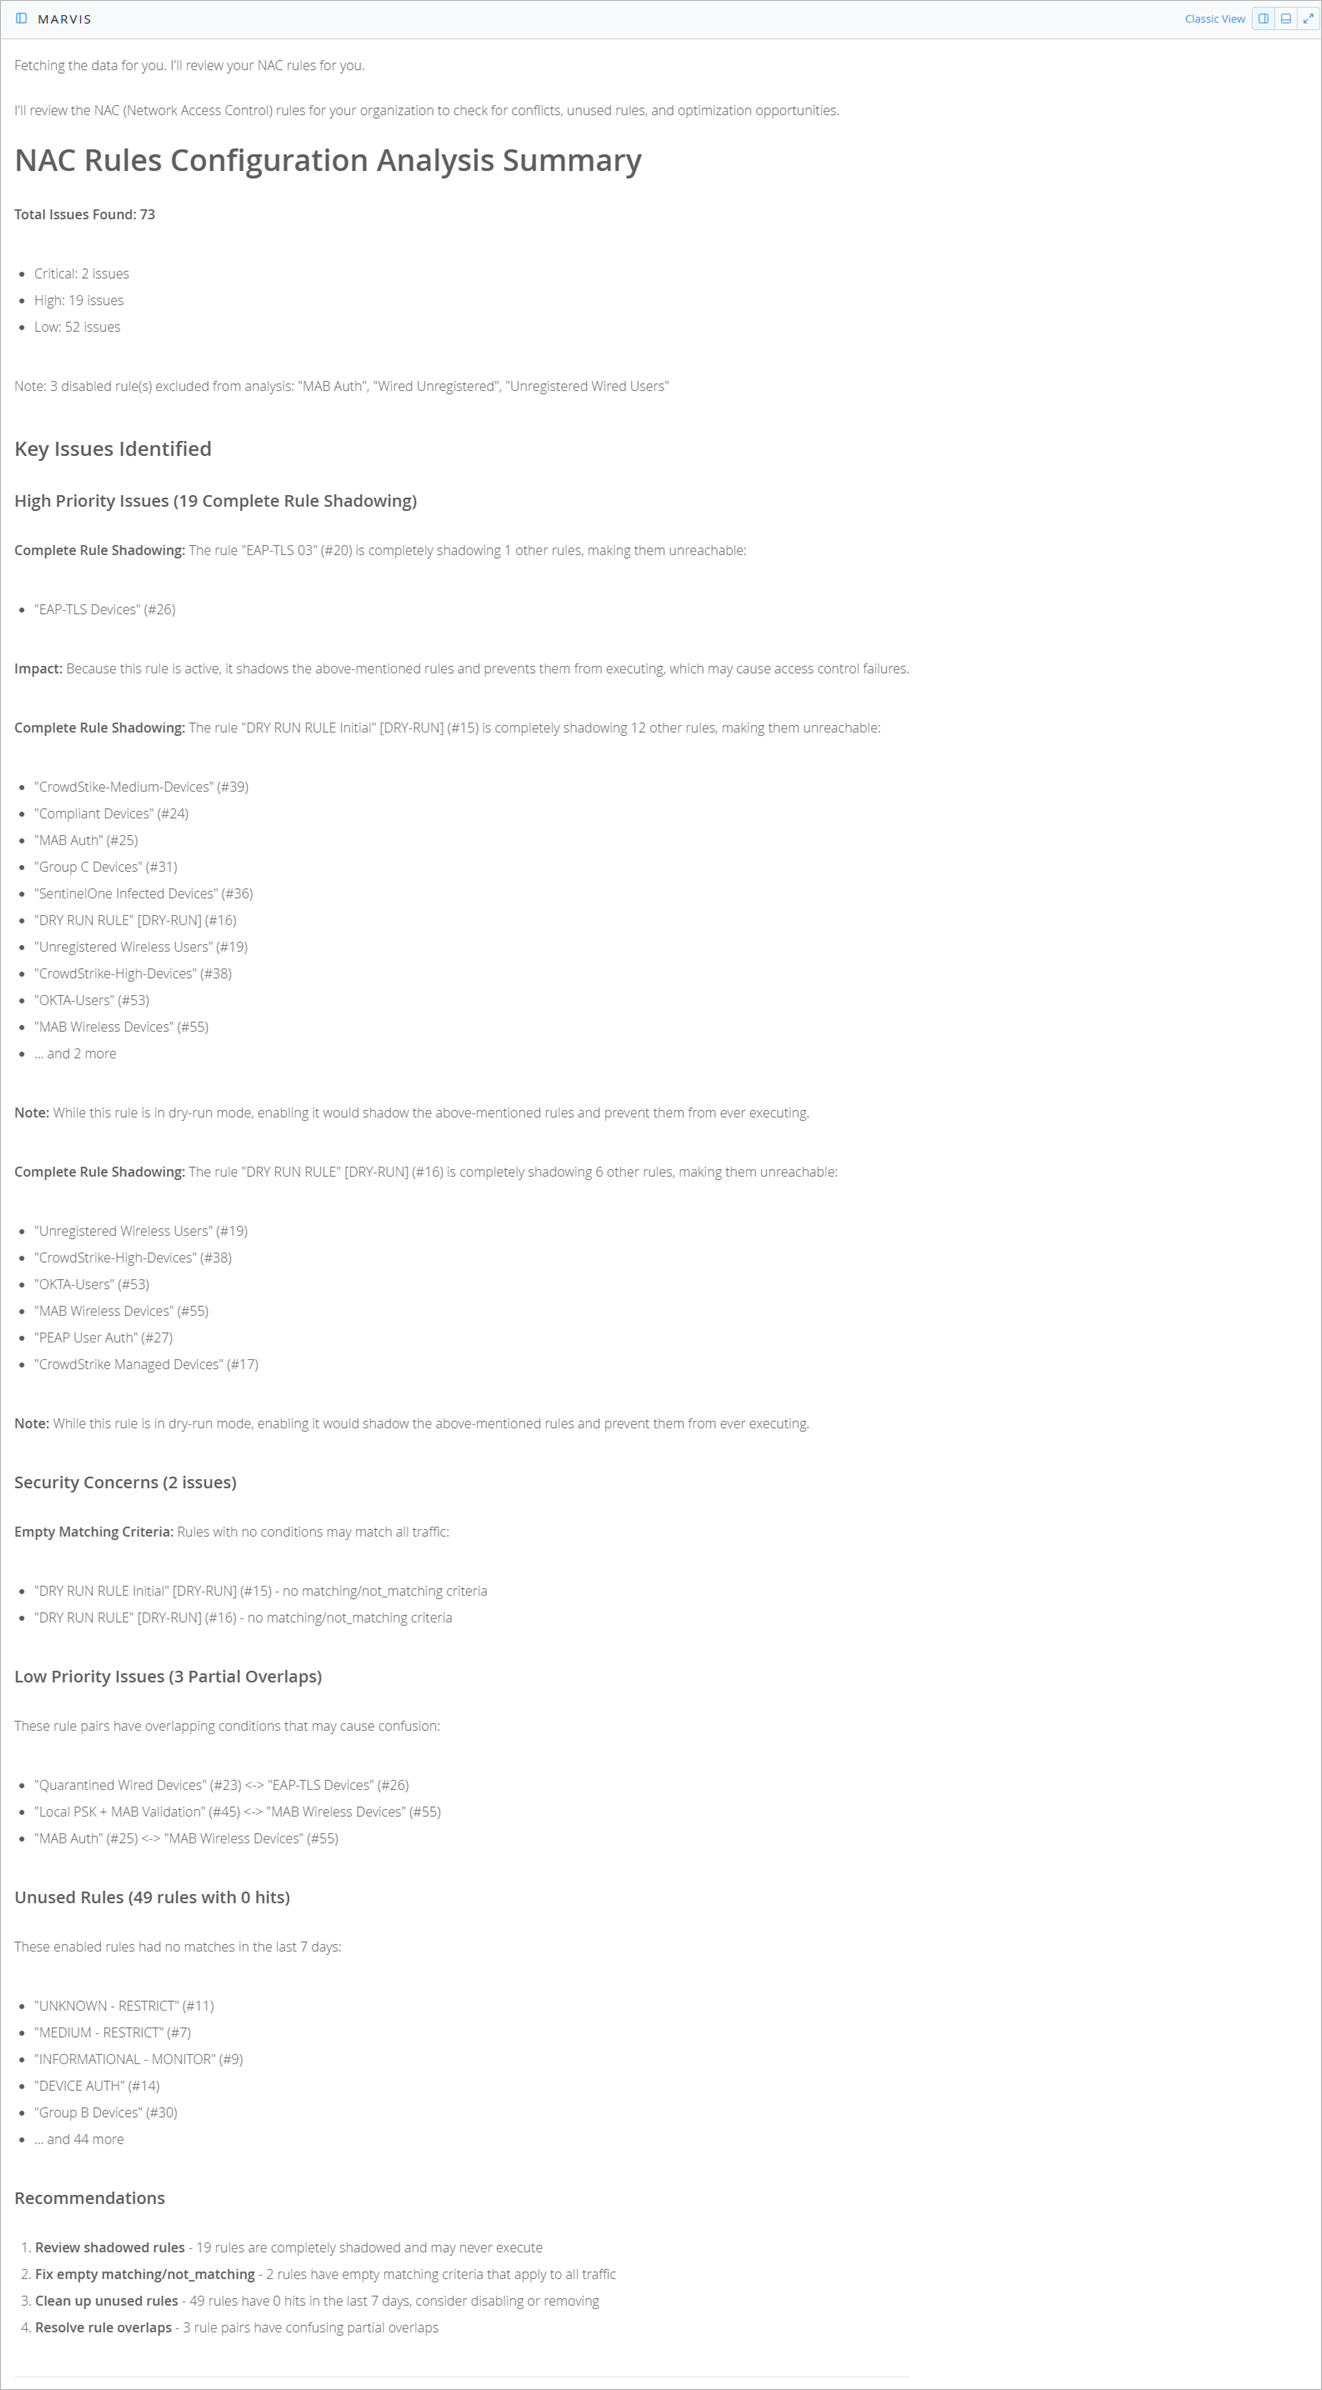
    NAC Rules Configuration Analysis Summary: 73 issues found with 2 critical, 19 high, and 52 low priority. Shadowing issues, security concerns, and unused rules identified. Recommendations include reviewing shadowed rules, fixing empty criteria, and cleaning up unused rules.

  • 特定のユーザーに影響を与えるTeamsの問題をトラブルシューティングします。

    プロンプト: 5 月 28 日にクライアント a0:xx:xx:ad:xx:e4 のアプリケーション チームのトラブルシューティングを行う
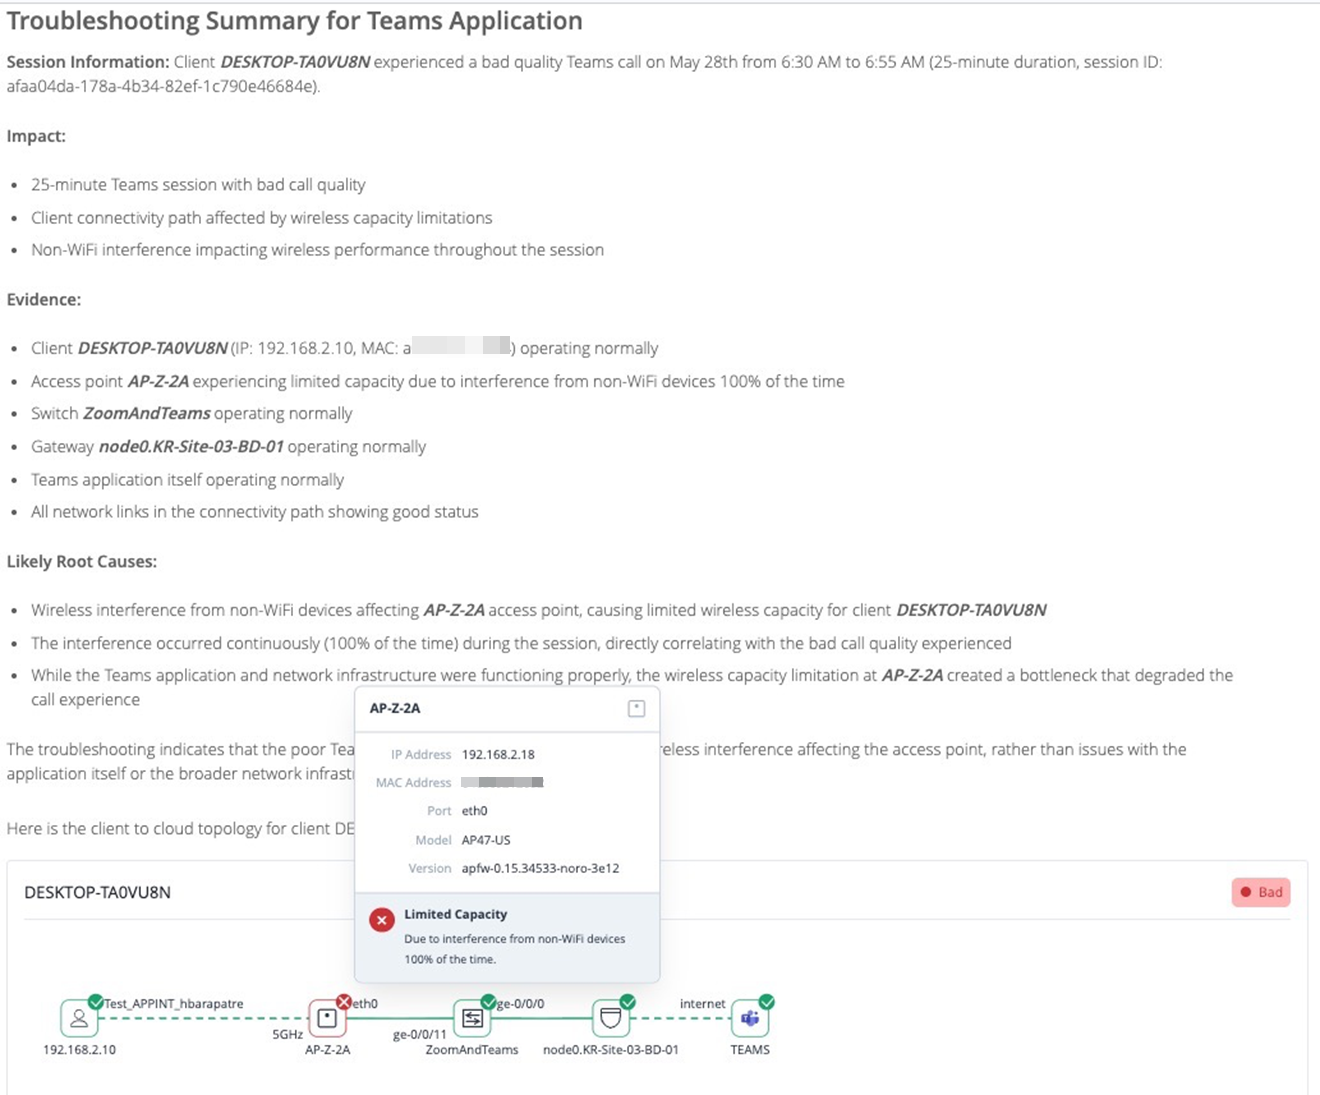
    Troubleshooting summary report for a bad-quality Microsoft Teams call session. Highlights session details, wireless interference, access point capacity limitations, evidence of network links and Teams app functioning normally, and a client topology diagram identifying access point AP-Z-2A as the bottleneck.