使用 Marvis 对话助手排解特定的连接问题

了解如何使用 Marvis 对话助手对特定的连接问题进行故障排除。

我们将提供几个故障排除示例,以便您了解如何使用 Marvis 对话助手来解决连接问题。

授权失败故障排除

授权失败的原因有多种,例如 RADIUS 服务器无响应和客户端无法完成授权过程。此示例说明如何使用 Marvis 对话助手对站点和客户端的授权失败进行故障排除。

要排除站点上的授权失败,请执行以下操作:

  1. 在 Marvis 对话助手窗口中,输入 后 troubleshoot 跟站点名称。您还可以指定持续时间。

    在此示例中,您将看到 Marvis 识别无线网络中的授权问题。
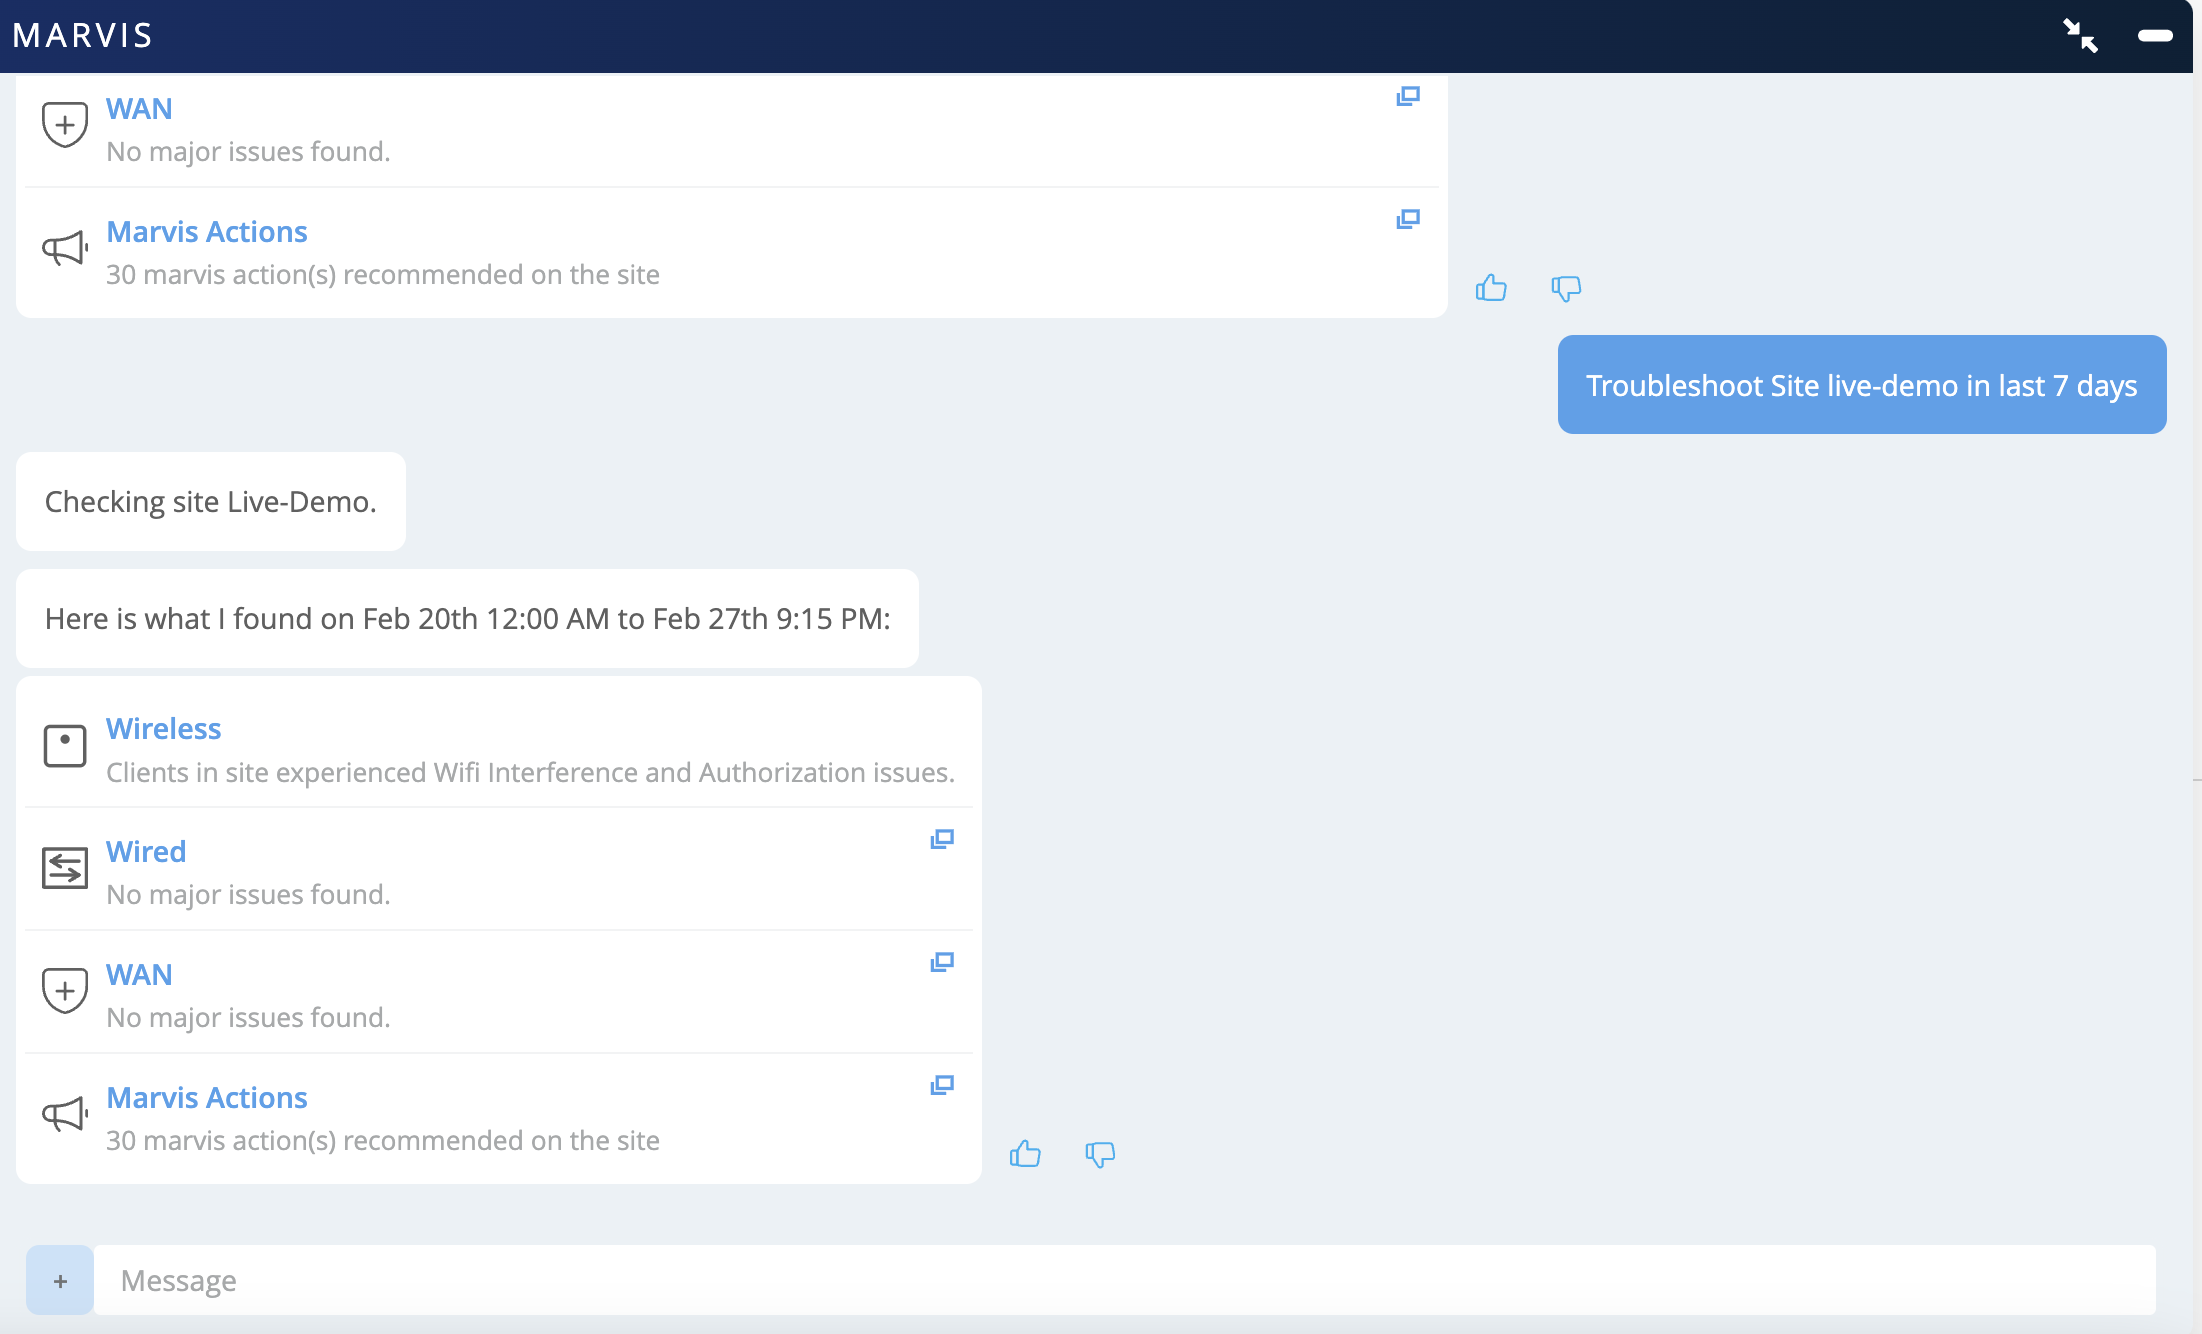
    Troubleshooting interface for MARVIS analyzing site Live-Demo from February 20th 12:00 AM to February 27th 9:15 PM. Wireless shows WiFi interference and authorization issues. Wired and WAN report no major issues. Marvis recommends 30 actions. Includes button to troubleshoot site and options for user feedback.

  2. 单击 “无线” 类别以获取有关该问题的更多详细信息。在此示例中,您将看到 Marvis 报告站点上的客户端在 36% 的时间内面临授权失败。
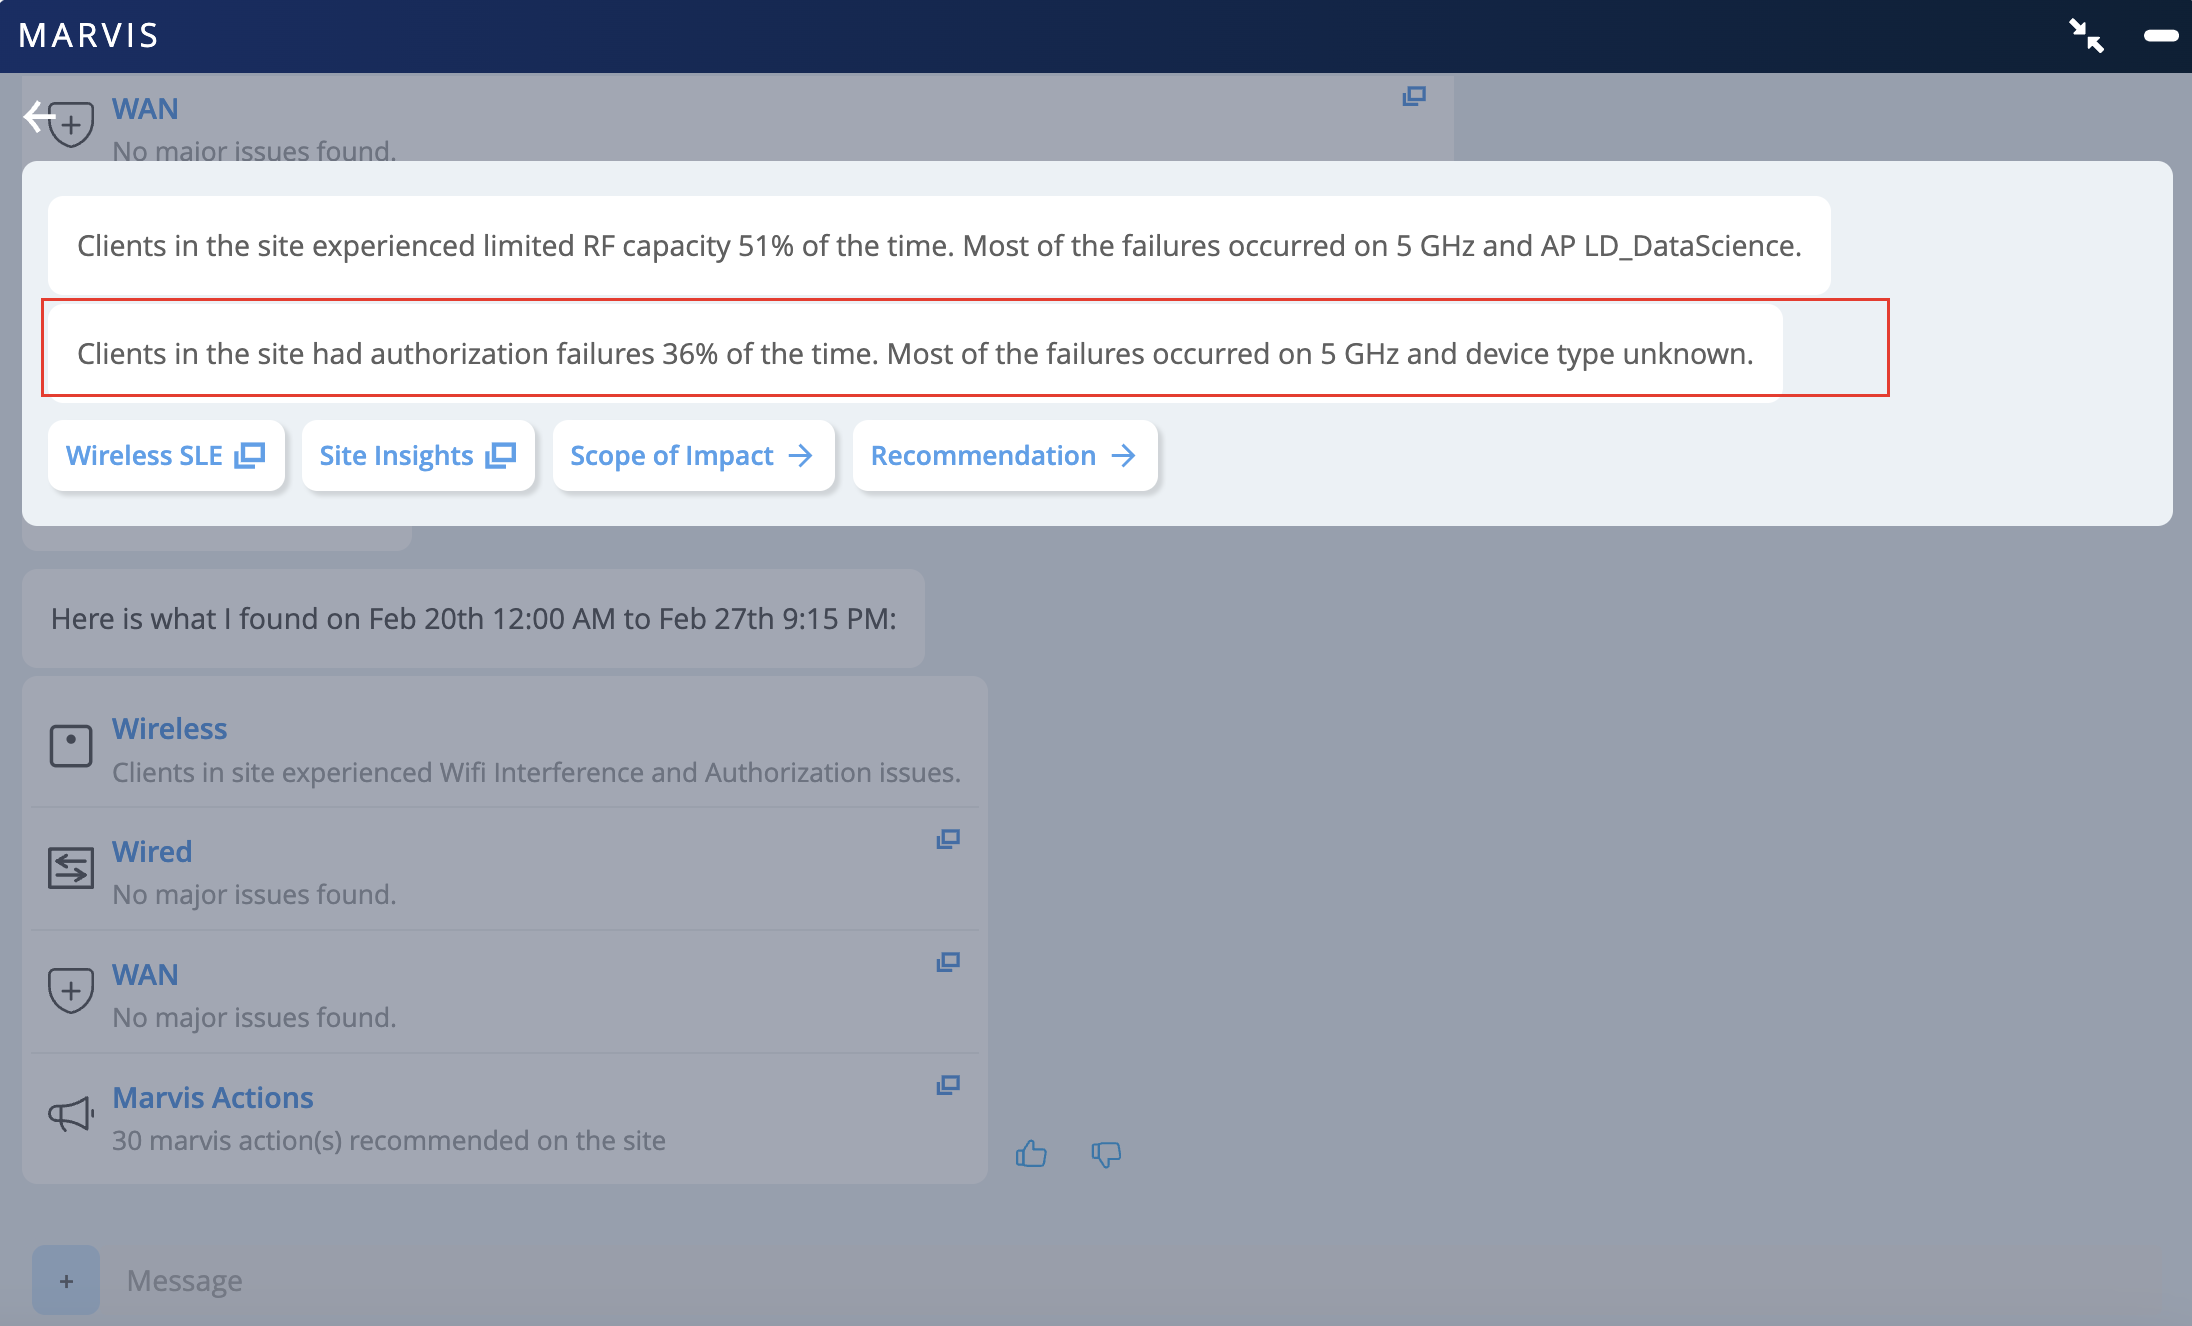
    Network monitoring tool screenshot summarizing wireless issues, wired and WAN status, and Marvis recommendations. Wireless issues include RF capacity failures 51 percent of the time and authorization failures 36 percent of the time, mostly on the 5 GHz band linked to AP LD_DataScience. Wired and WAN connections show no major issues. System suggests 30 actions to resolve site issues. Timestamped February 20th to February 27th.

可以使用显示的选项进行进一步调查。

影响范围

影响范围 (Scope of Impact) 以图形形式表示遇到问题的所有客户端。您还可以使用右侧的下拉列表选择基于无线 LAN (WLAN)、接入点 (接入点) 或无线电频段查看信息。
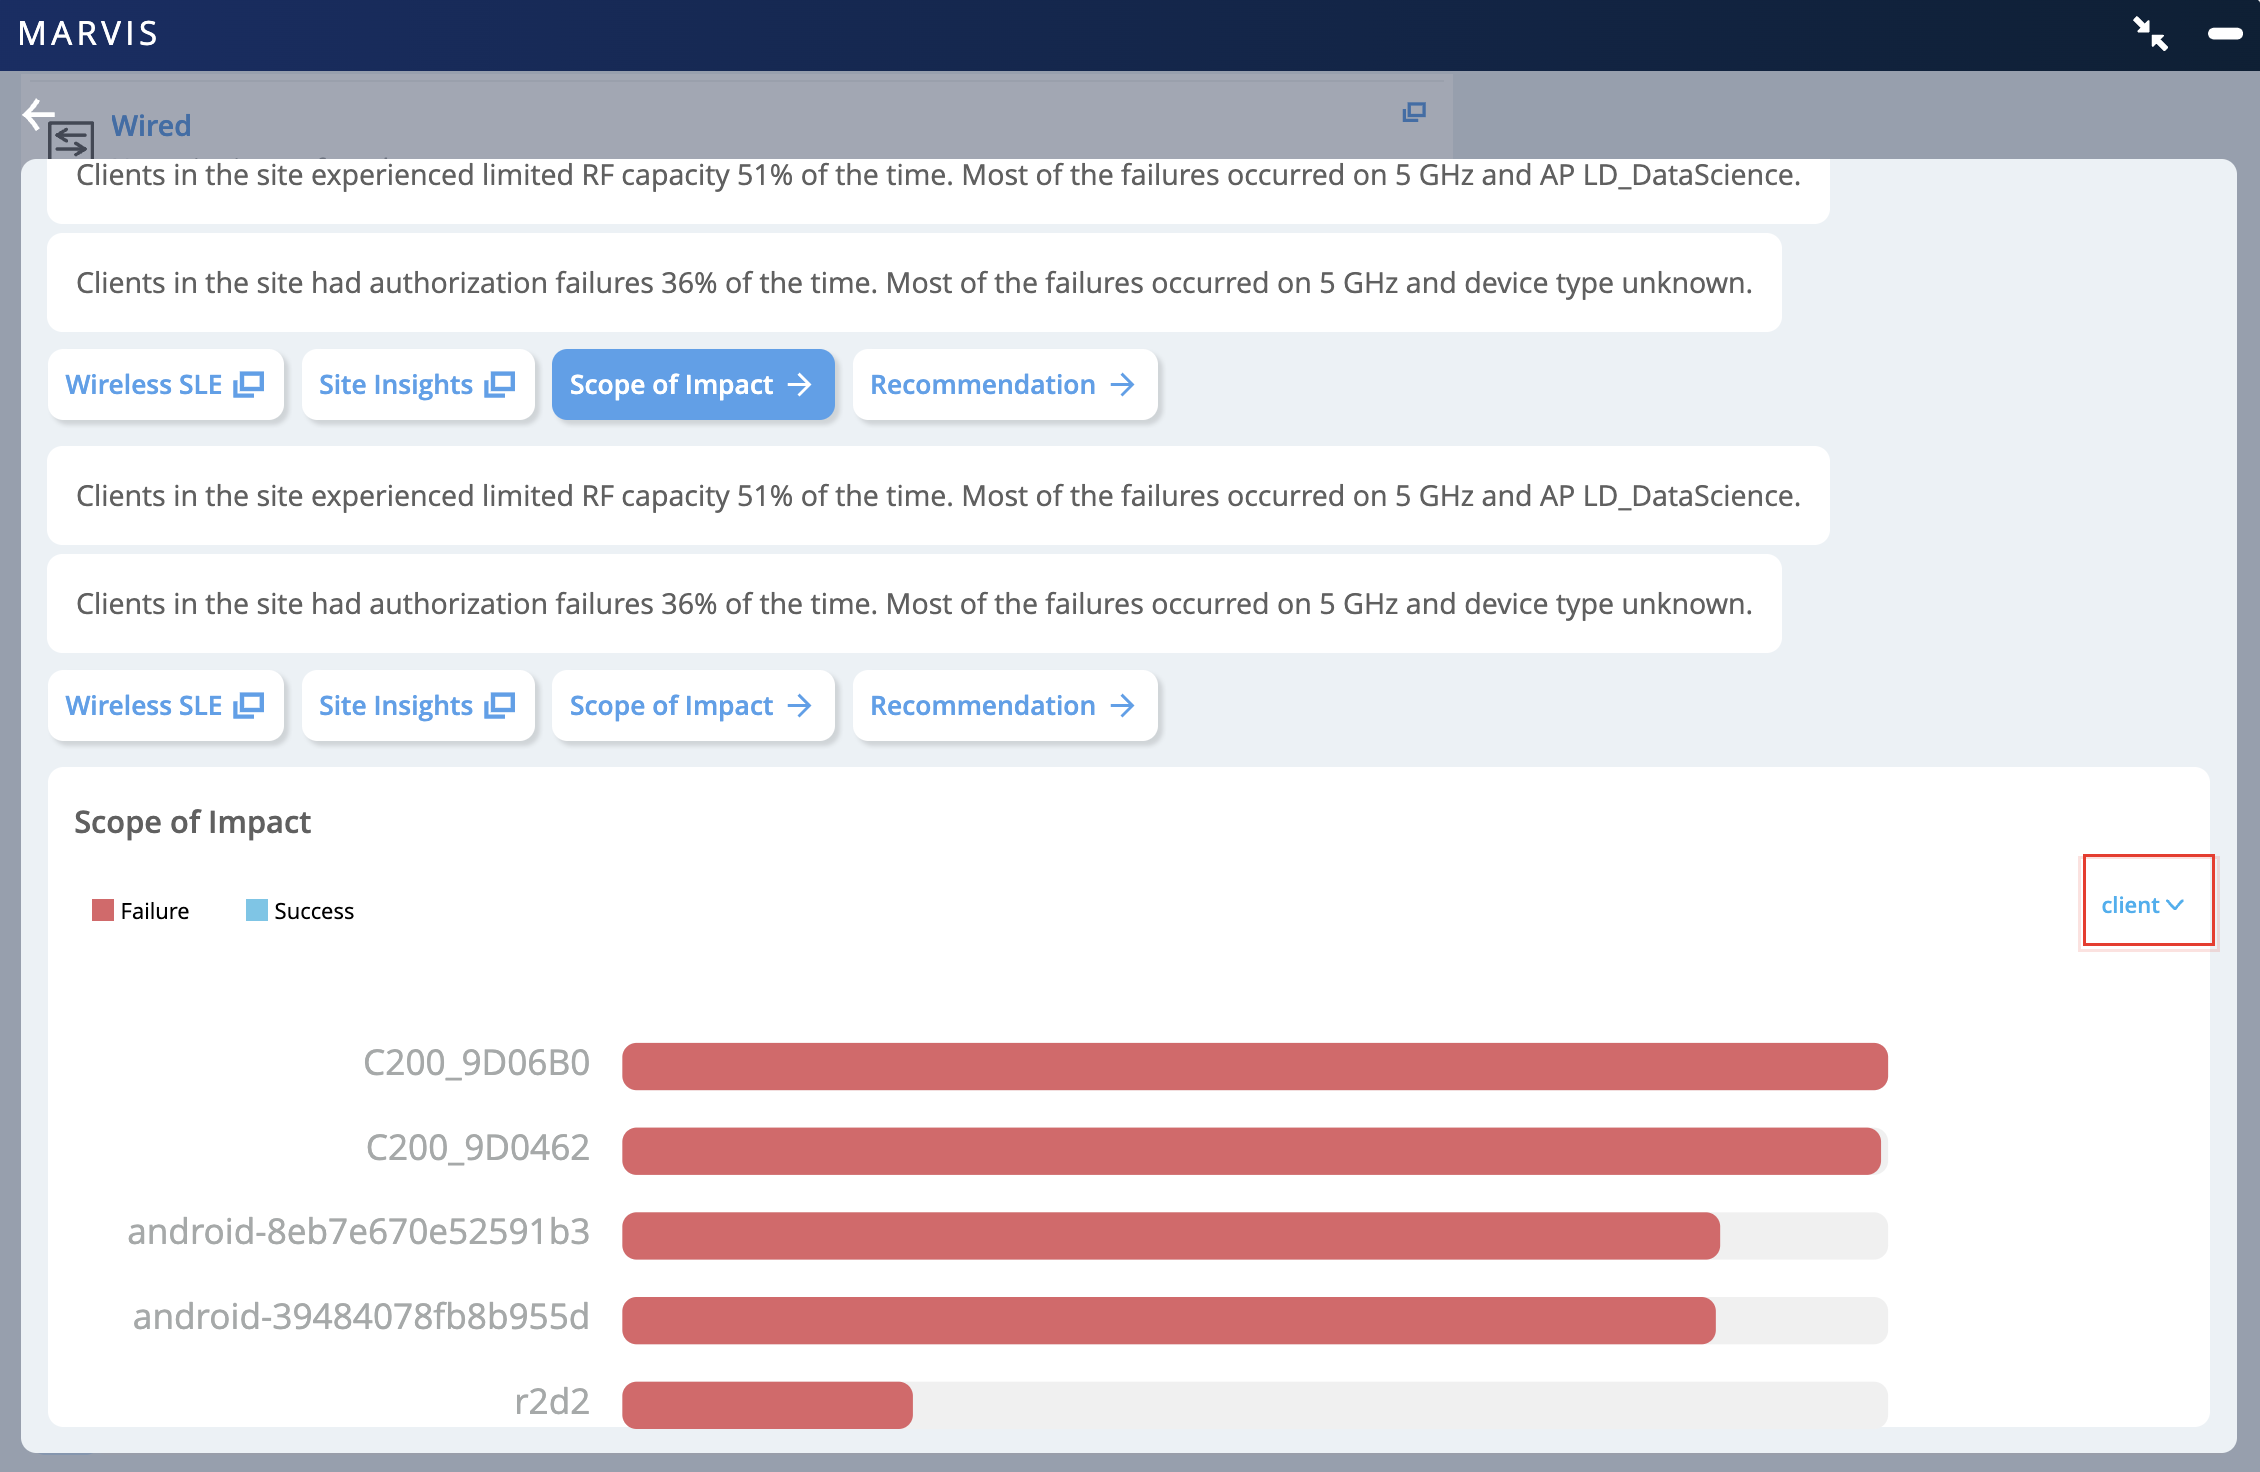
Network monitoring dashboard from Marvis showing wireless performance issues. Summary highlights RF capacity issues 51 percent of the time and authorization failures 36 percent of the time, mostly on 5 GHz band. Tabs include Wireless SLE, Site Insights, Scope of Impact, and Recommendation. Bar chart displays client impact with red bars for failures and blue bars for successes. Dropdown menu allows filtering by client.

无线 SLE

无线 SLE 仪表板提供站点级洞察和 SLE 分类器。在此示例中,你将看到成功连接服务级别预期 (SLE) 显示 64% 的连接成功。
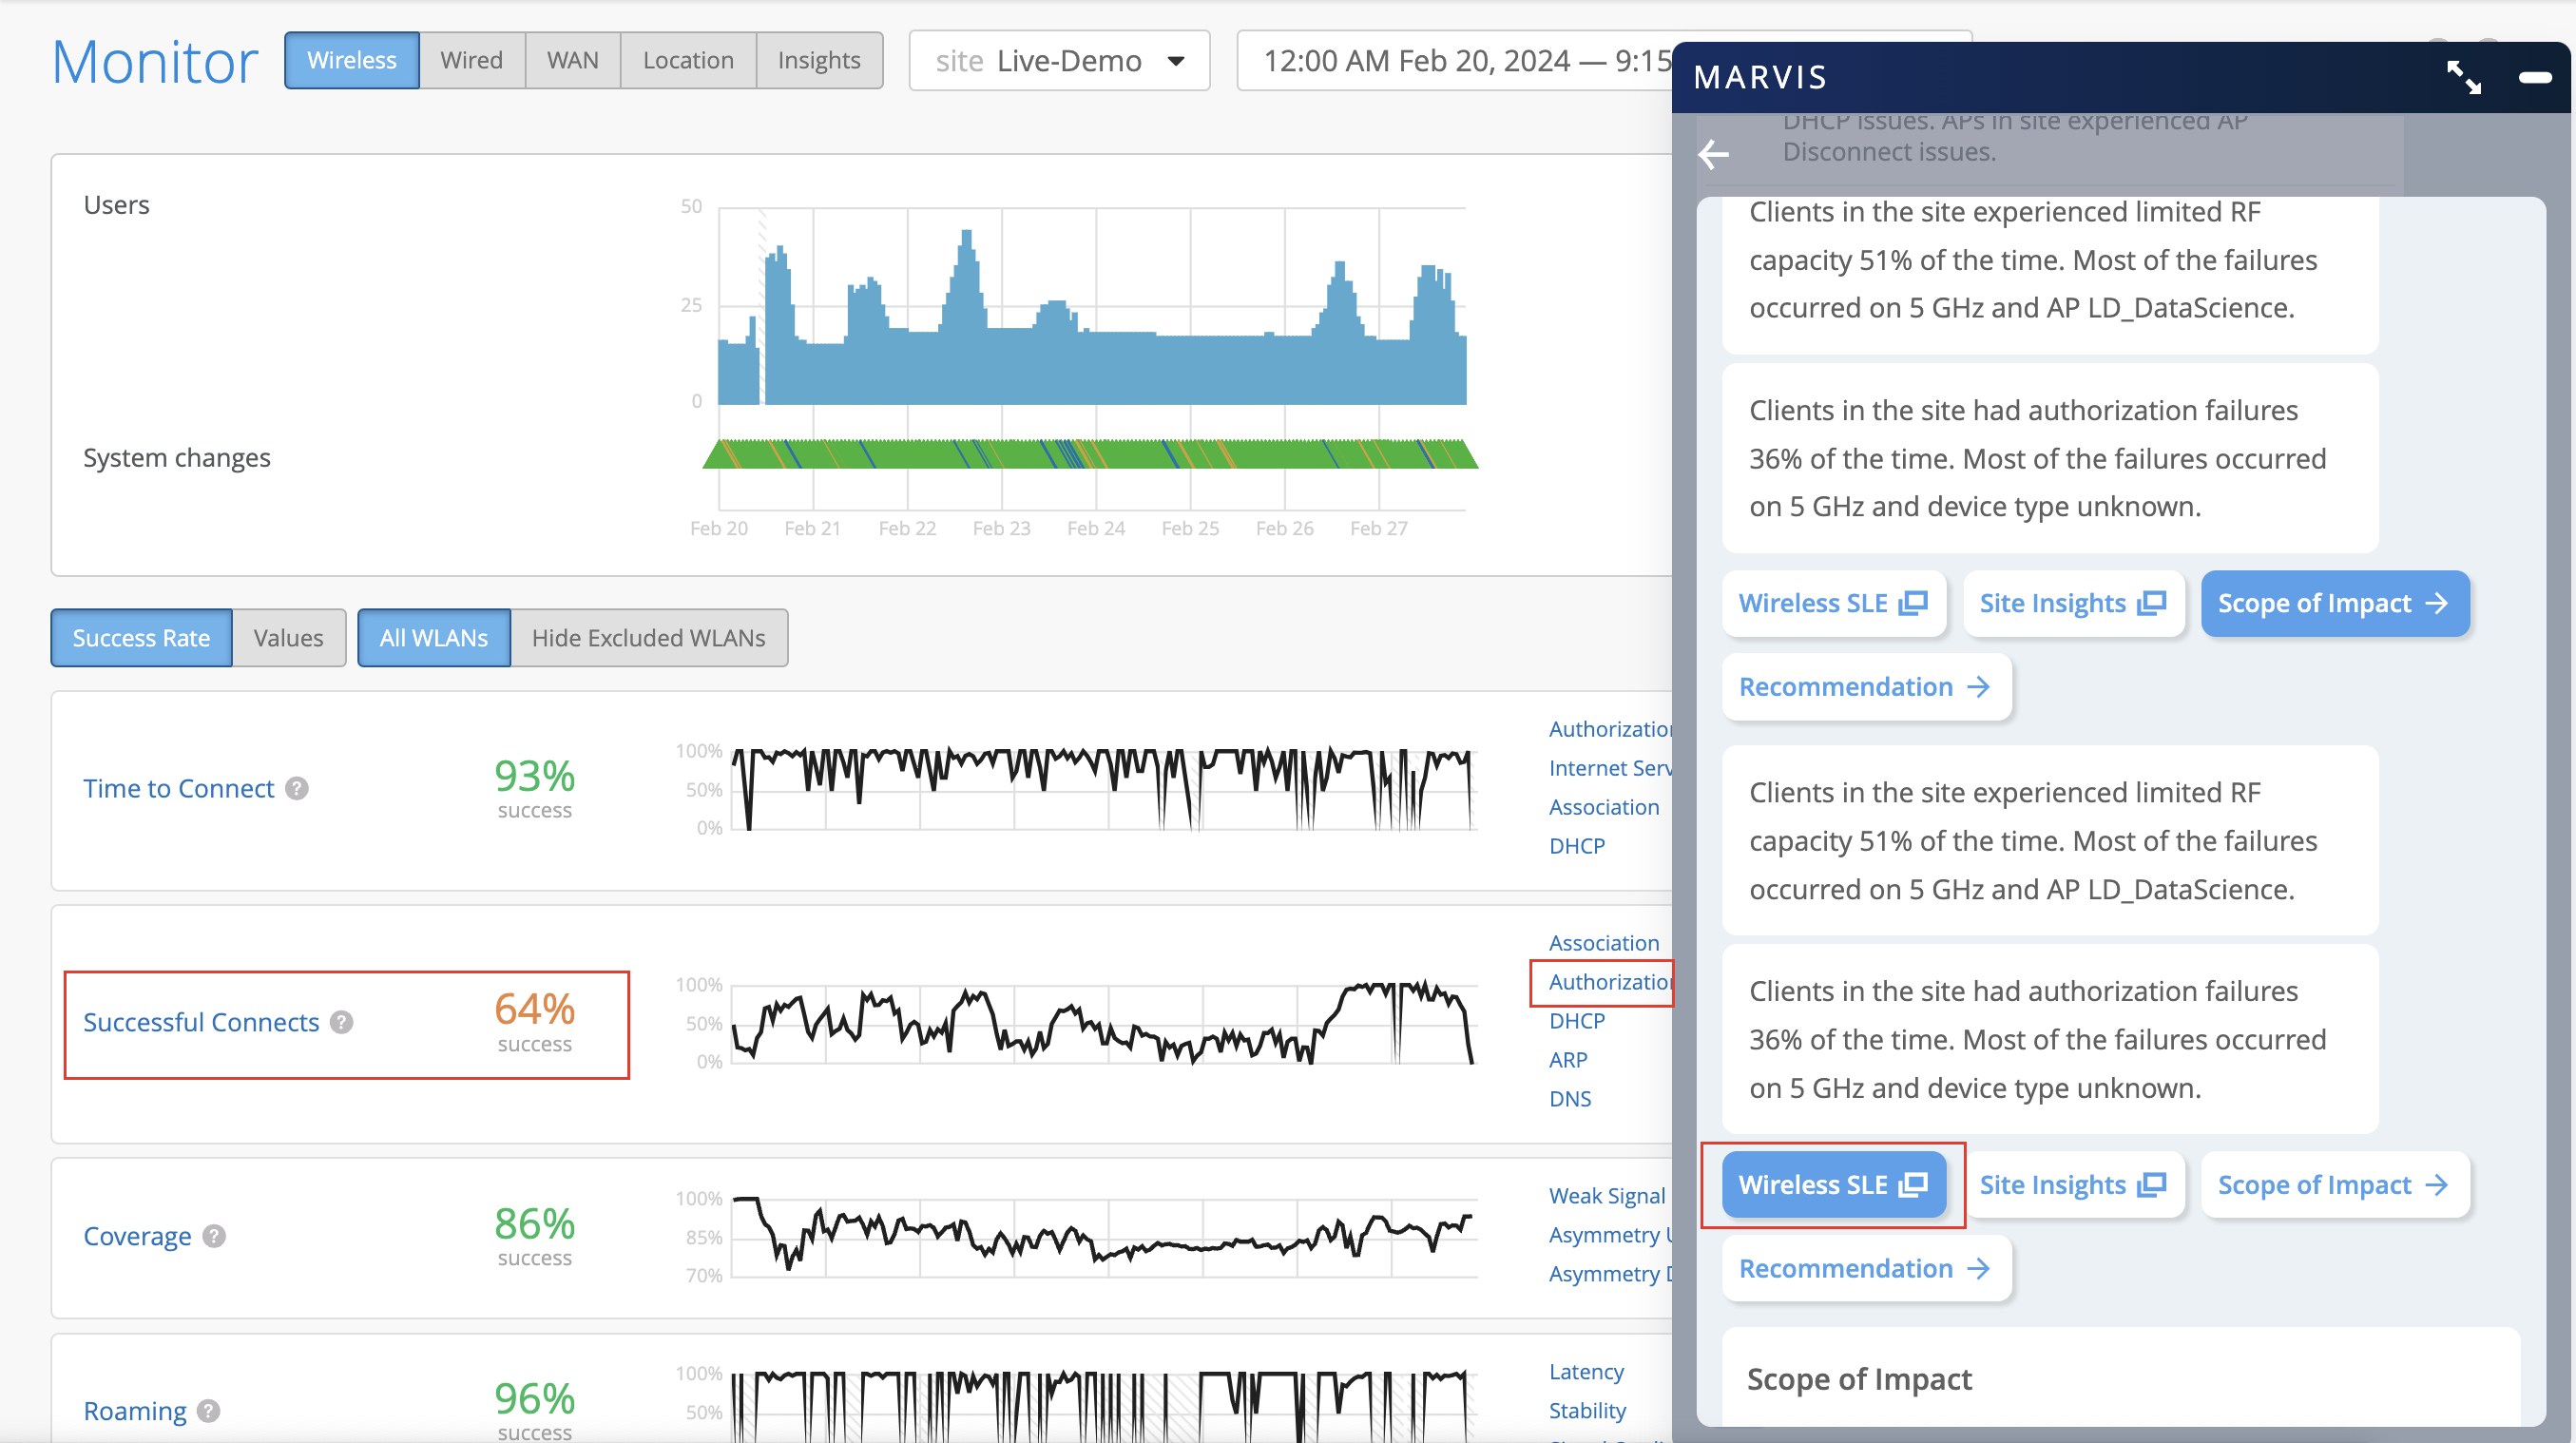
Network monitoring dashboard showing wireless performance metrics and issues. Key data includes 64 percent successful connects, highlighted in red. MARVIS panel lists issues like limited RF capacity and authorization failures on 5 GHz, with recommendations for resolution.

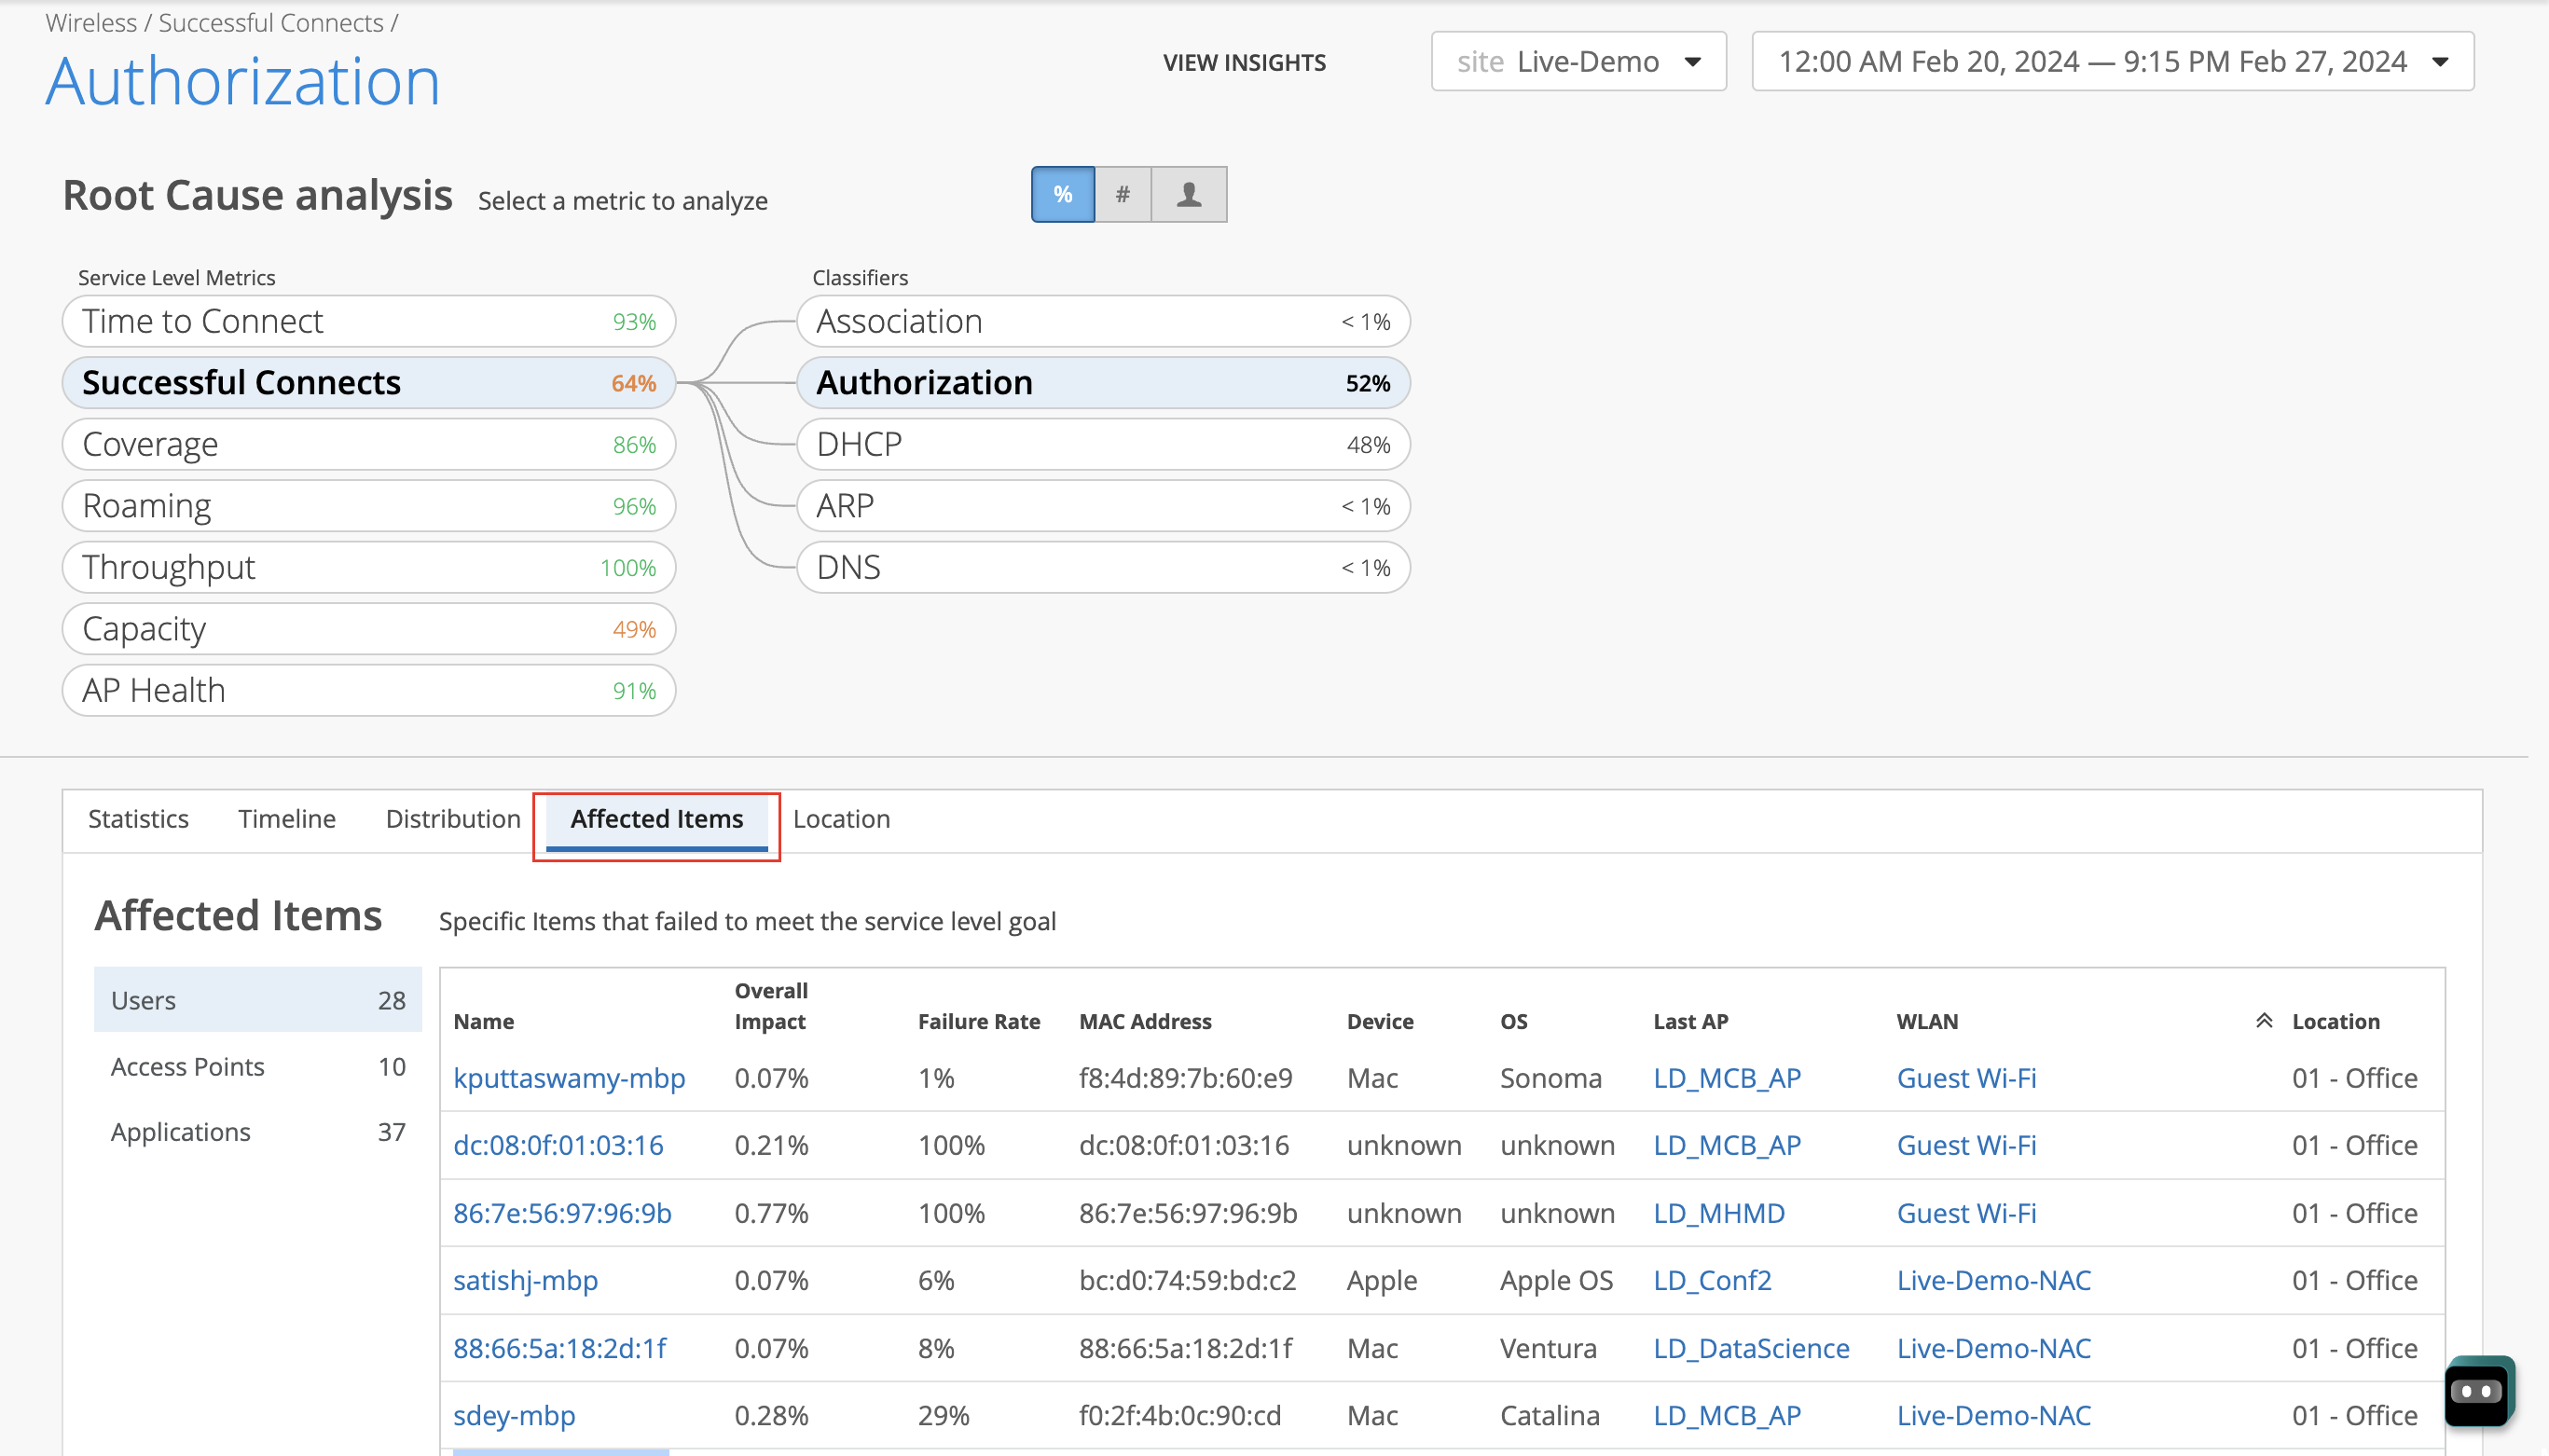
单击右侧的 授权 分类器,查看根本原因分析页面。此页面提供了详细信息。您可以浏览页面上的每个选项卡。例如,您可以使用“分布”选项卡来确定是否在以下方面观察到问题:

  • 所有接入点或特定接入点

  • 所有用户或特定用户

  • 所有 WLAN 或特定 WLAN

  • 所有设备类型或特定设备类型

Dashboard analyzing wireless network performance, highlighting Successful Connects with a 64 percent success rate and Authorization as a major classifier with 52 percent impact. Includes root cause analysis metrics, affected items with failure details, and filters set to Live-Demo from February 20, 2024, to February 27, 2024.

“ 受影响项目” 选项卡将显示受影响的用户、接入点和应用。您可以通过单击用户进一步向下钻取。 “失败率 ”列指示用户是否总是无法连接。在很长一段时间内失败率达到 100% 的用户会列在 Marvis 操作的持续 失败客户端 类别下,如以下示例所示:
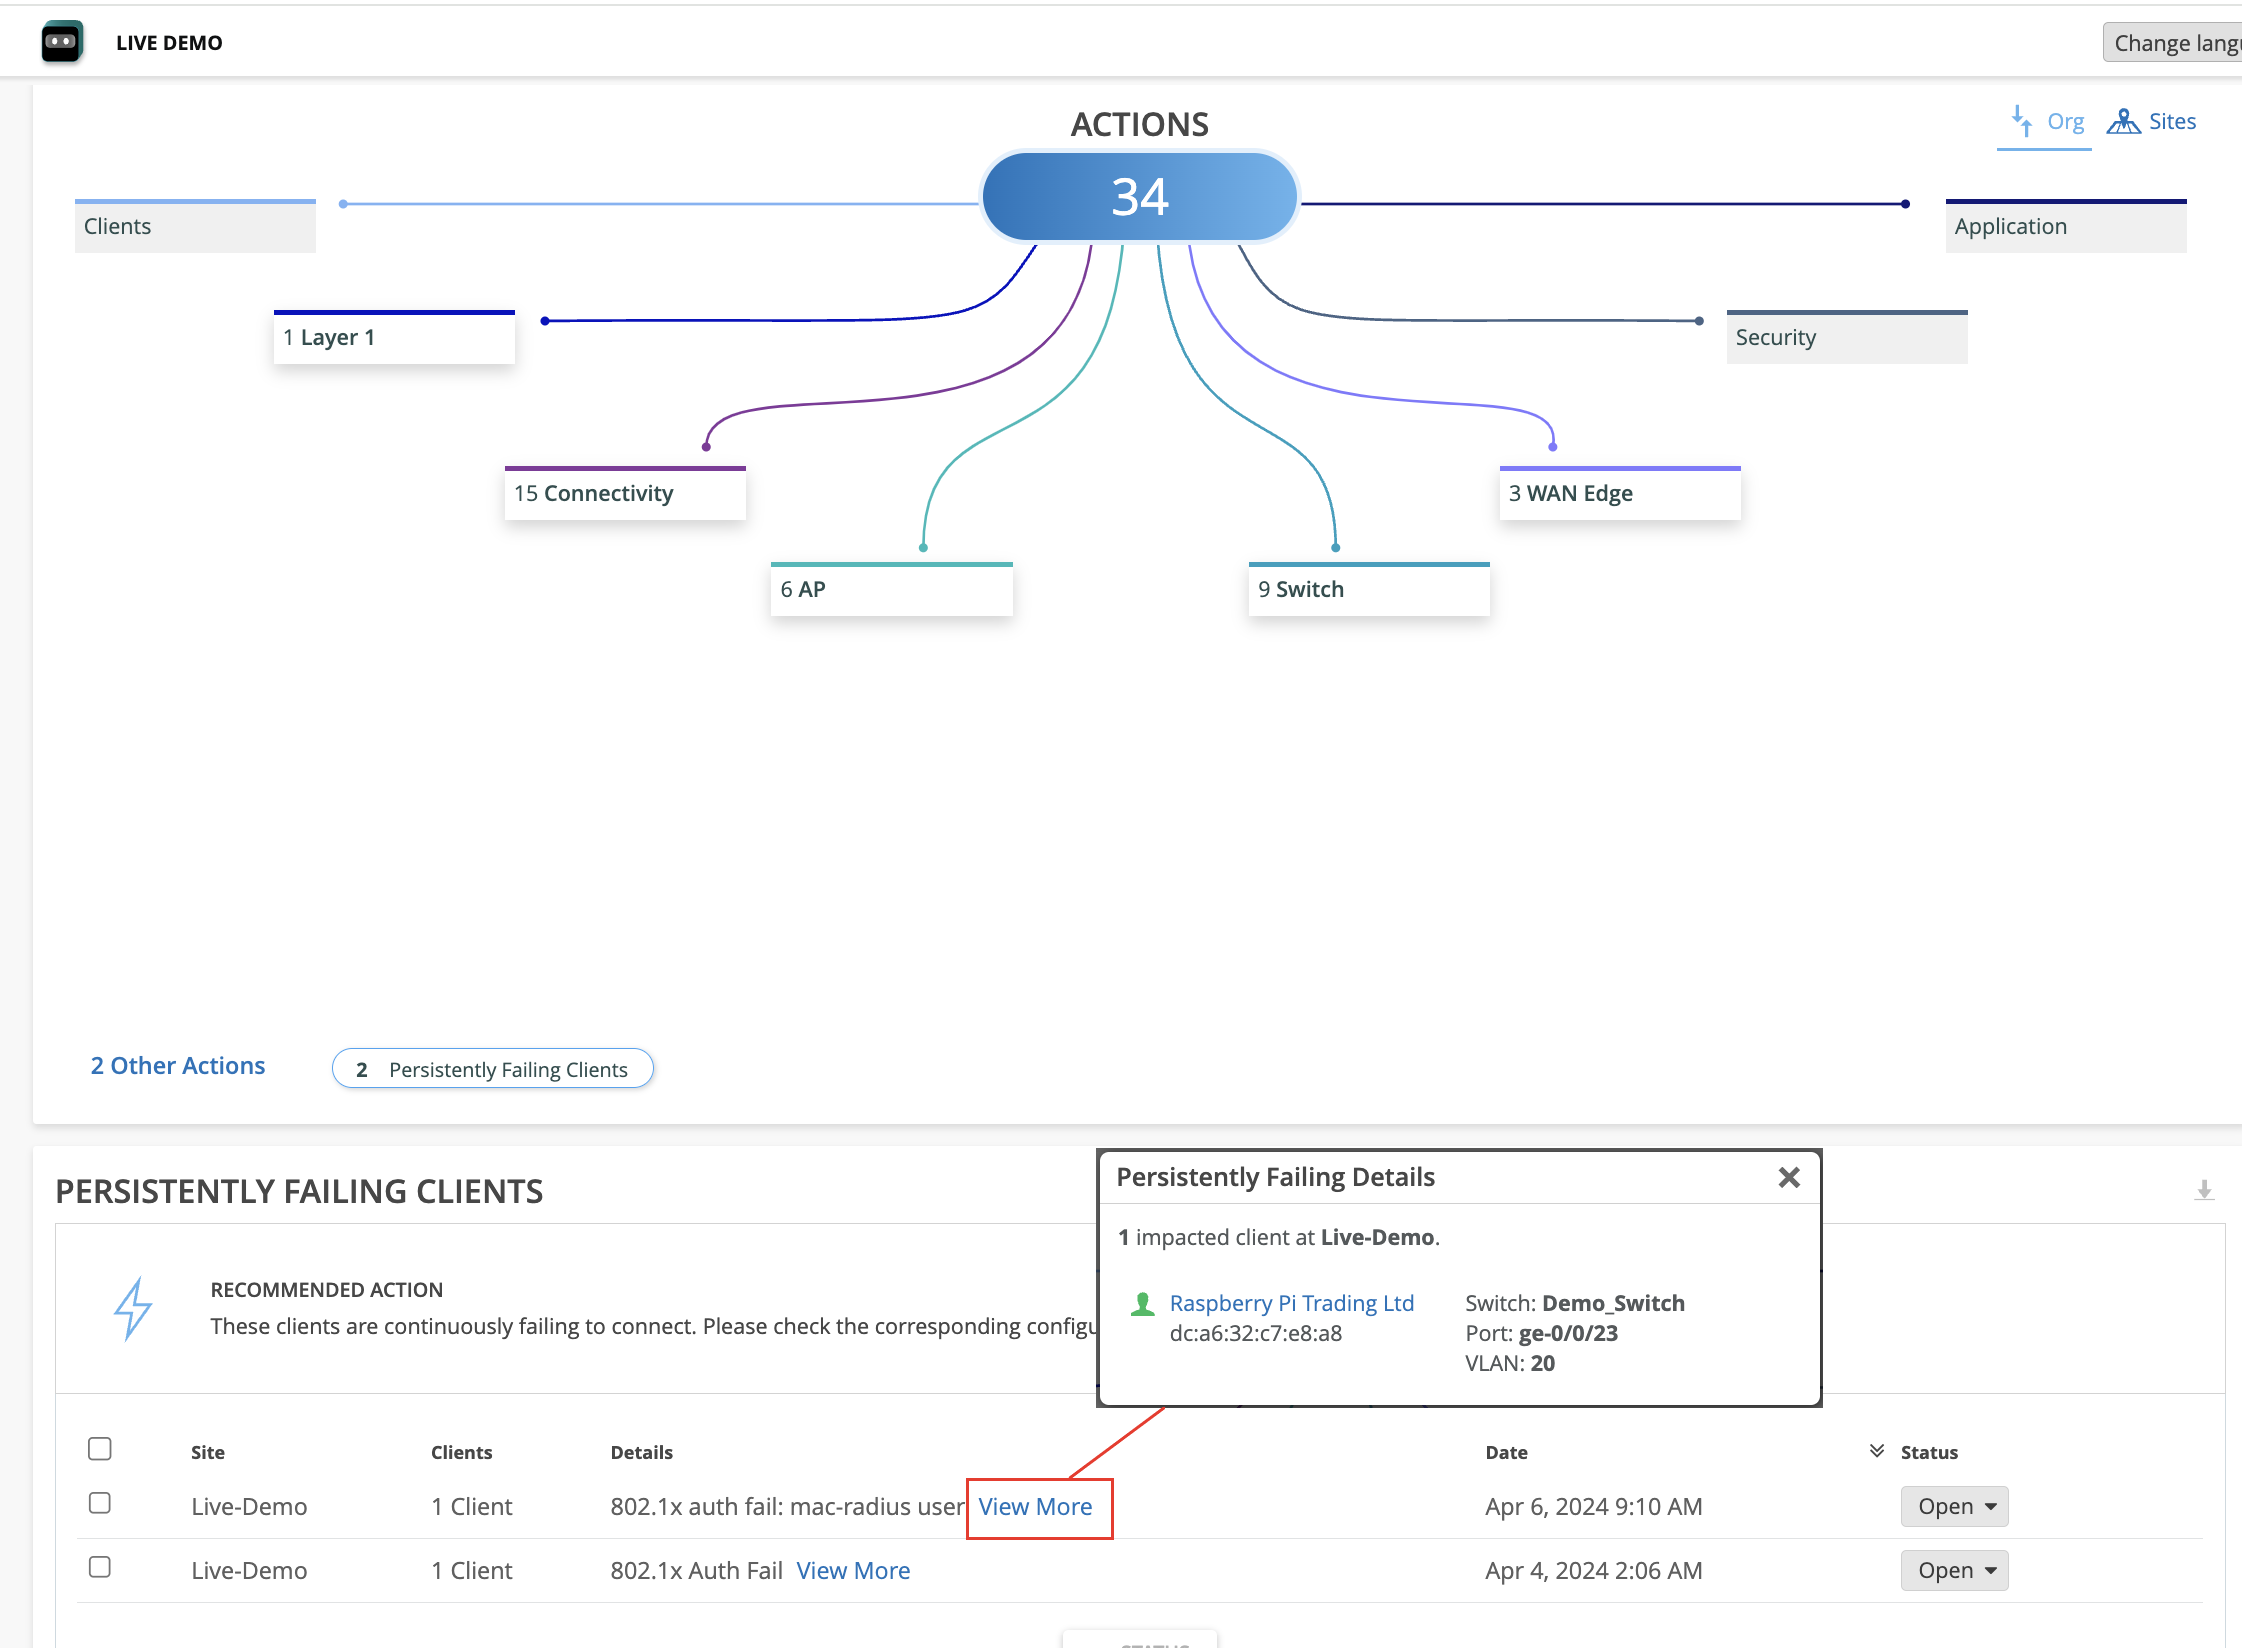
Dashboard showing network issues: 34 actions categorized into Clients, Connectivity, AP, Switch, WAN Edge, Application, and Security. Bottom section lists persistently failing clients with site names, failure details, timestamps, and statuses. Detailed view includes client name, MAC address, switch name, port, and VLAN. Options for filtering by organization or site and changing language are available.

要排查客户端的授权失败,请执行以下操作:

  1. 在 Marvis 对话助手窗口中,输入 tshoot client 后跟客户端的 MAC 地址或主机名。在以下示例中,您将看到 Marvis 检测到客户端的授权错误。
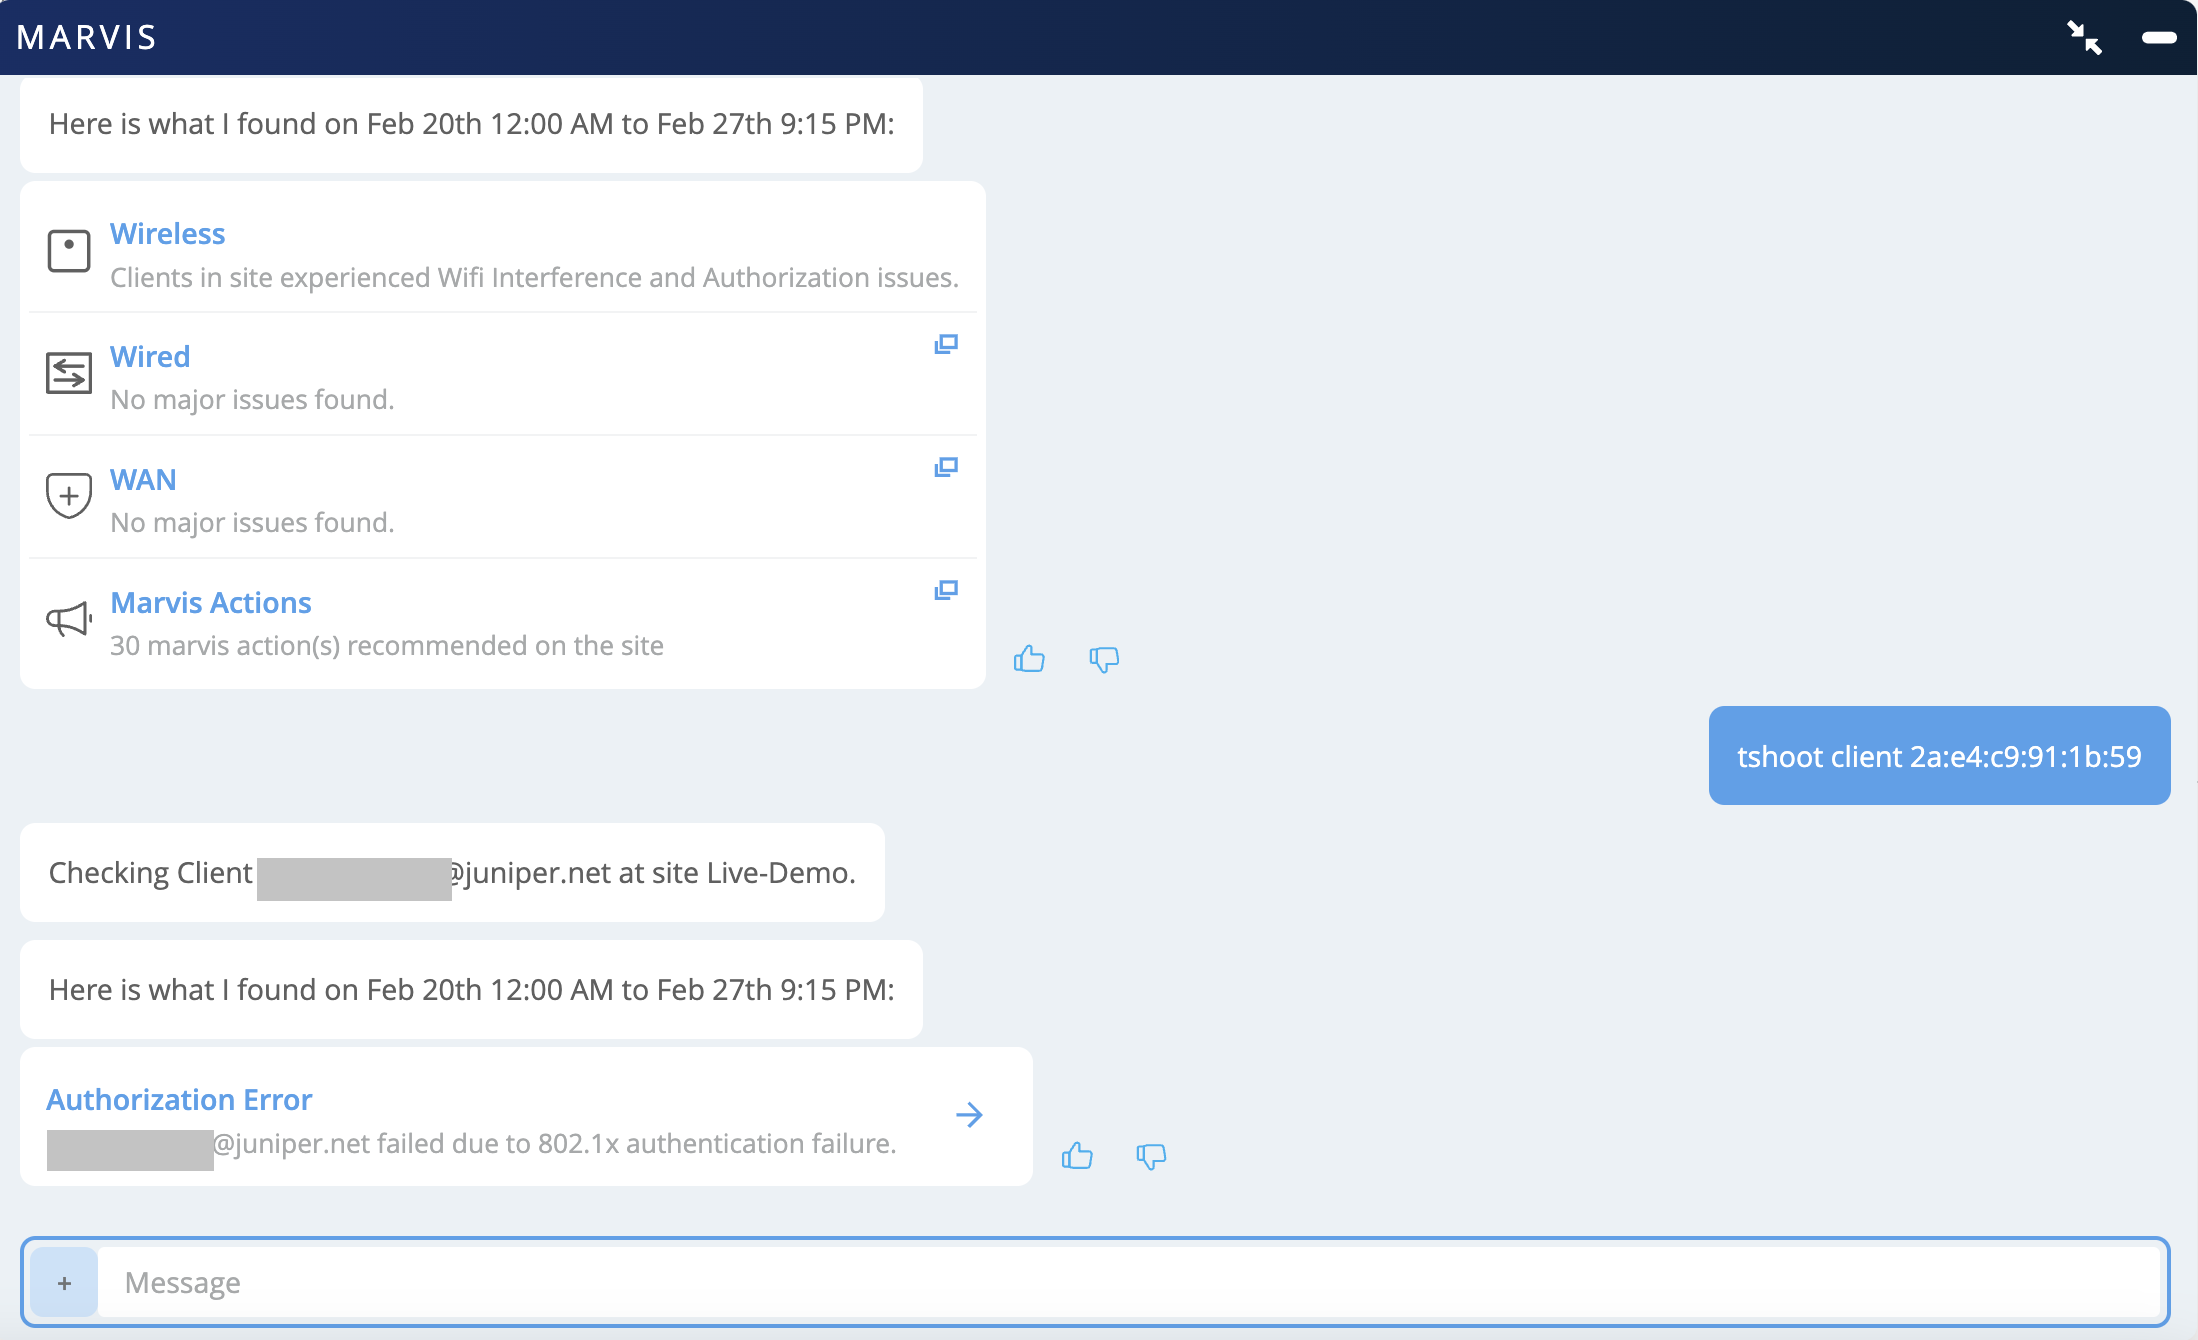
    Troubleshooting interface from Marvis showing network diagnostics. Summary includes WiFi interference and authorization issues, 30 recommended actions, and an 802.1x authentication failure for a specific client. Feedback options available.

  2. 单击 “授权错误 ”以查看更多详细信息。在此示例中,您将看到 Marvis 报告客户端在 100% 的情况下面临授权失败。
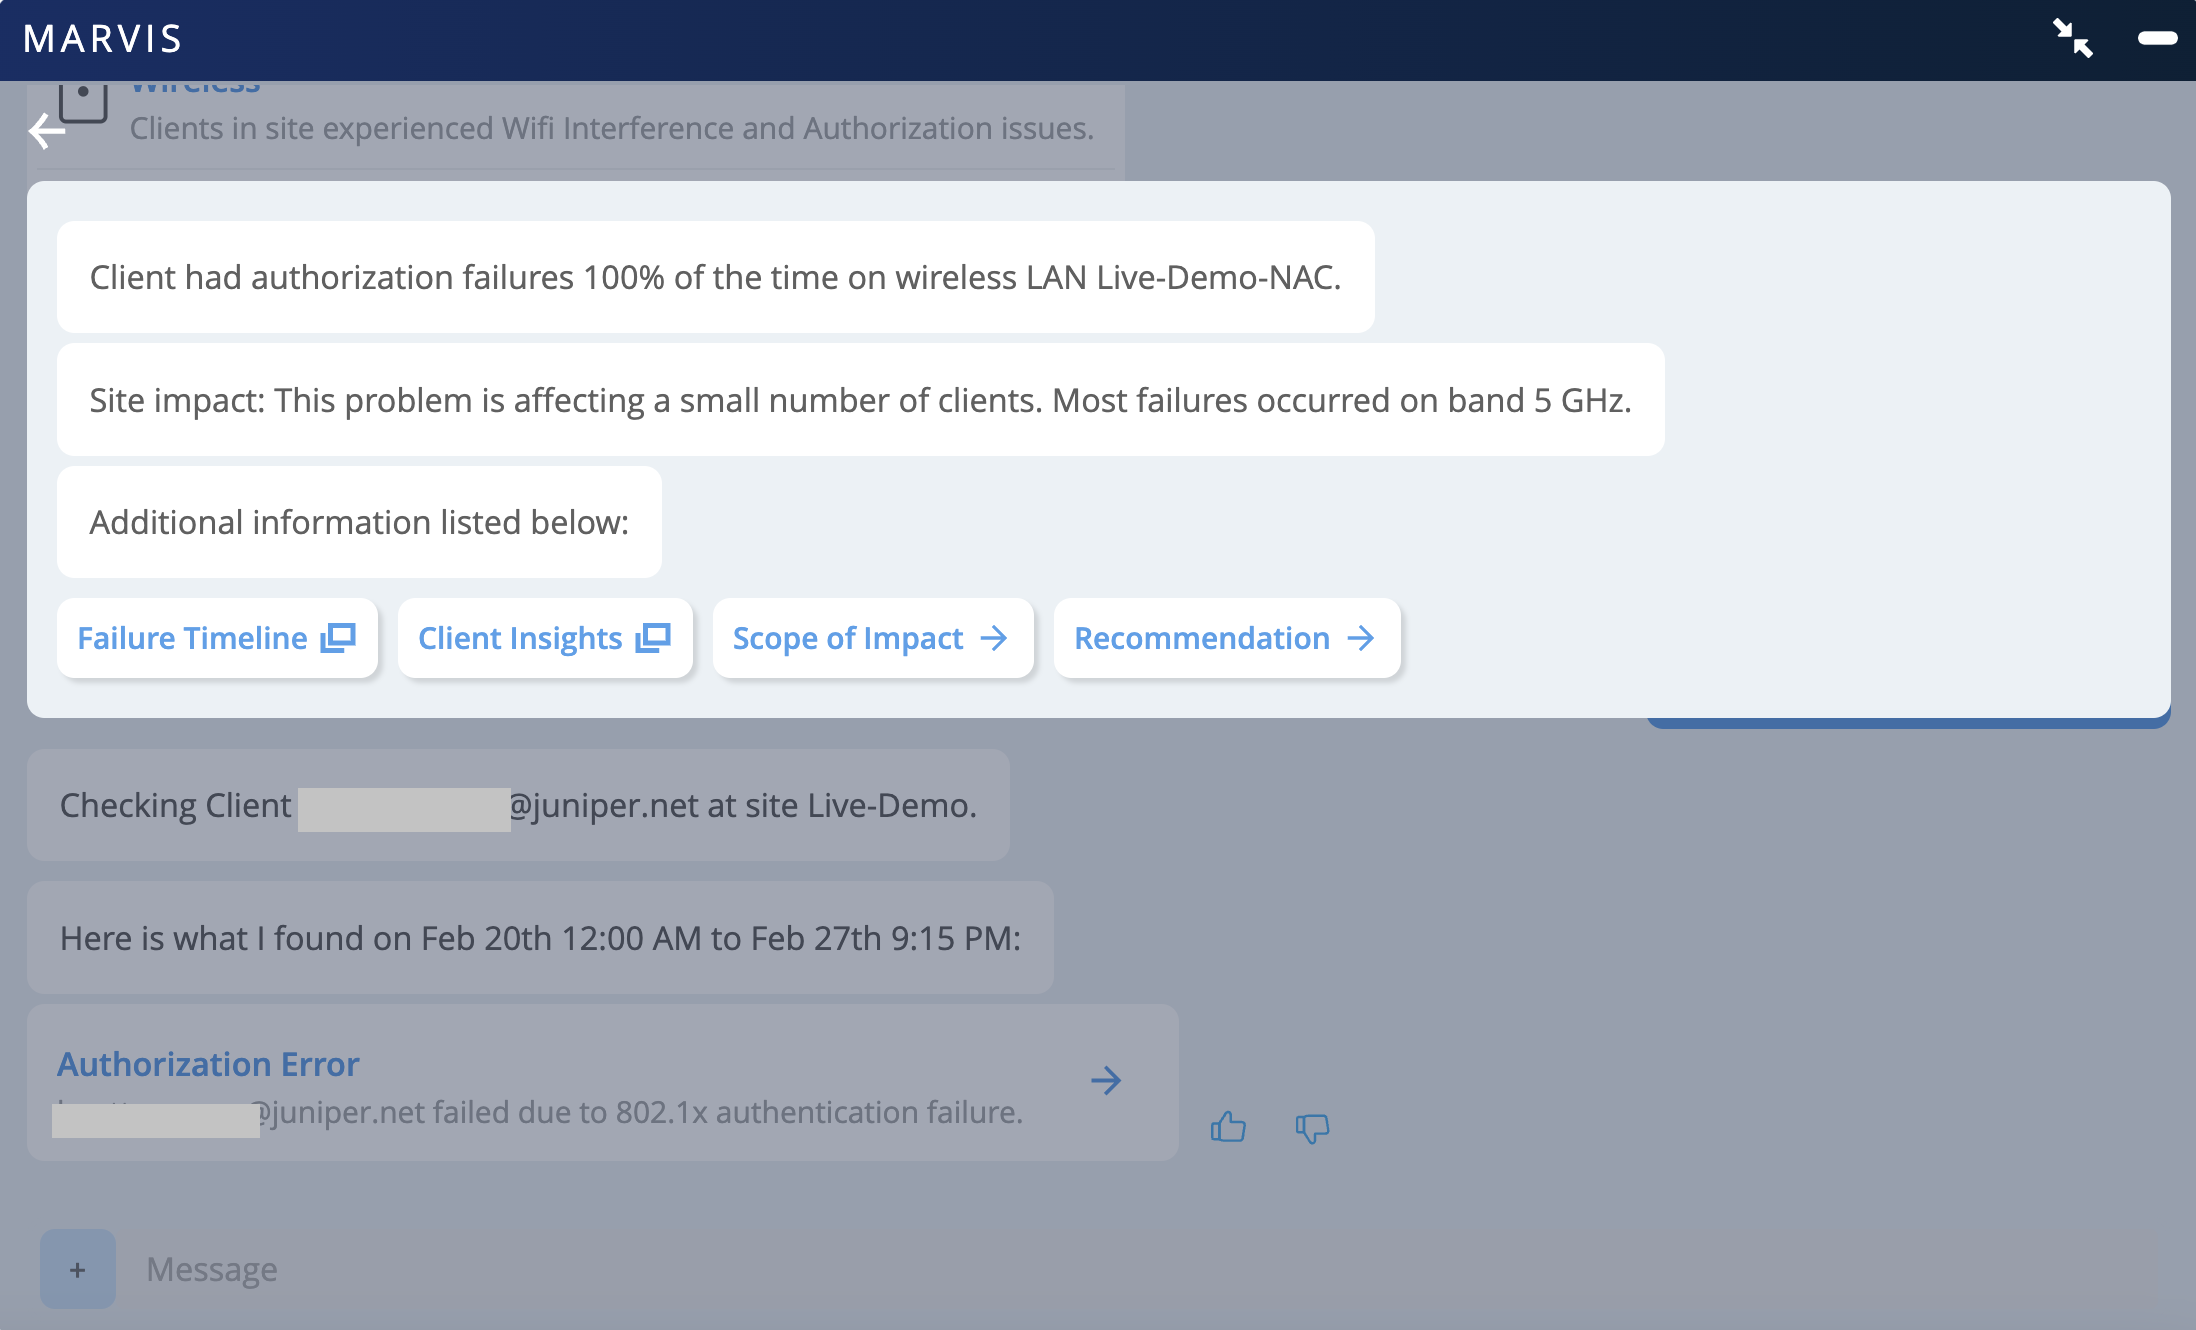
    Client experiencing 100 percent authorization failures on wireless LAN Live-Demo-NAC due to 802.1x authentication issues from Feb 20th to Feb 27th. Most failures occurred on the 5 GHz band. Options for further investigation include Failure Timeline, Client Insights, Scope of Impact, and Recommendation.

    请注意,Marvis 也会在 Marvis 操作页面的连接类别下报告此问题。

当我们正在调查特定于客户端的问题时,您可以单击 客户端洞察。“客户端事件”部分列出了与客户端关联的所有事件。您可以单击授权失败事件查看失败原因。
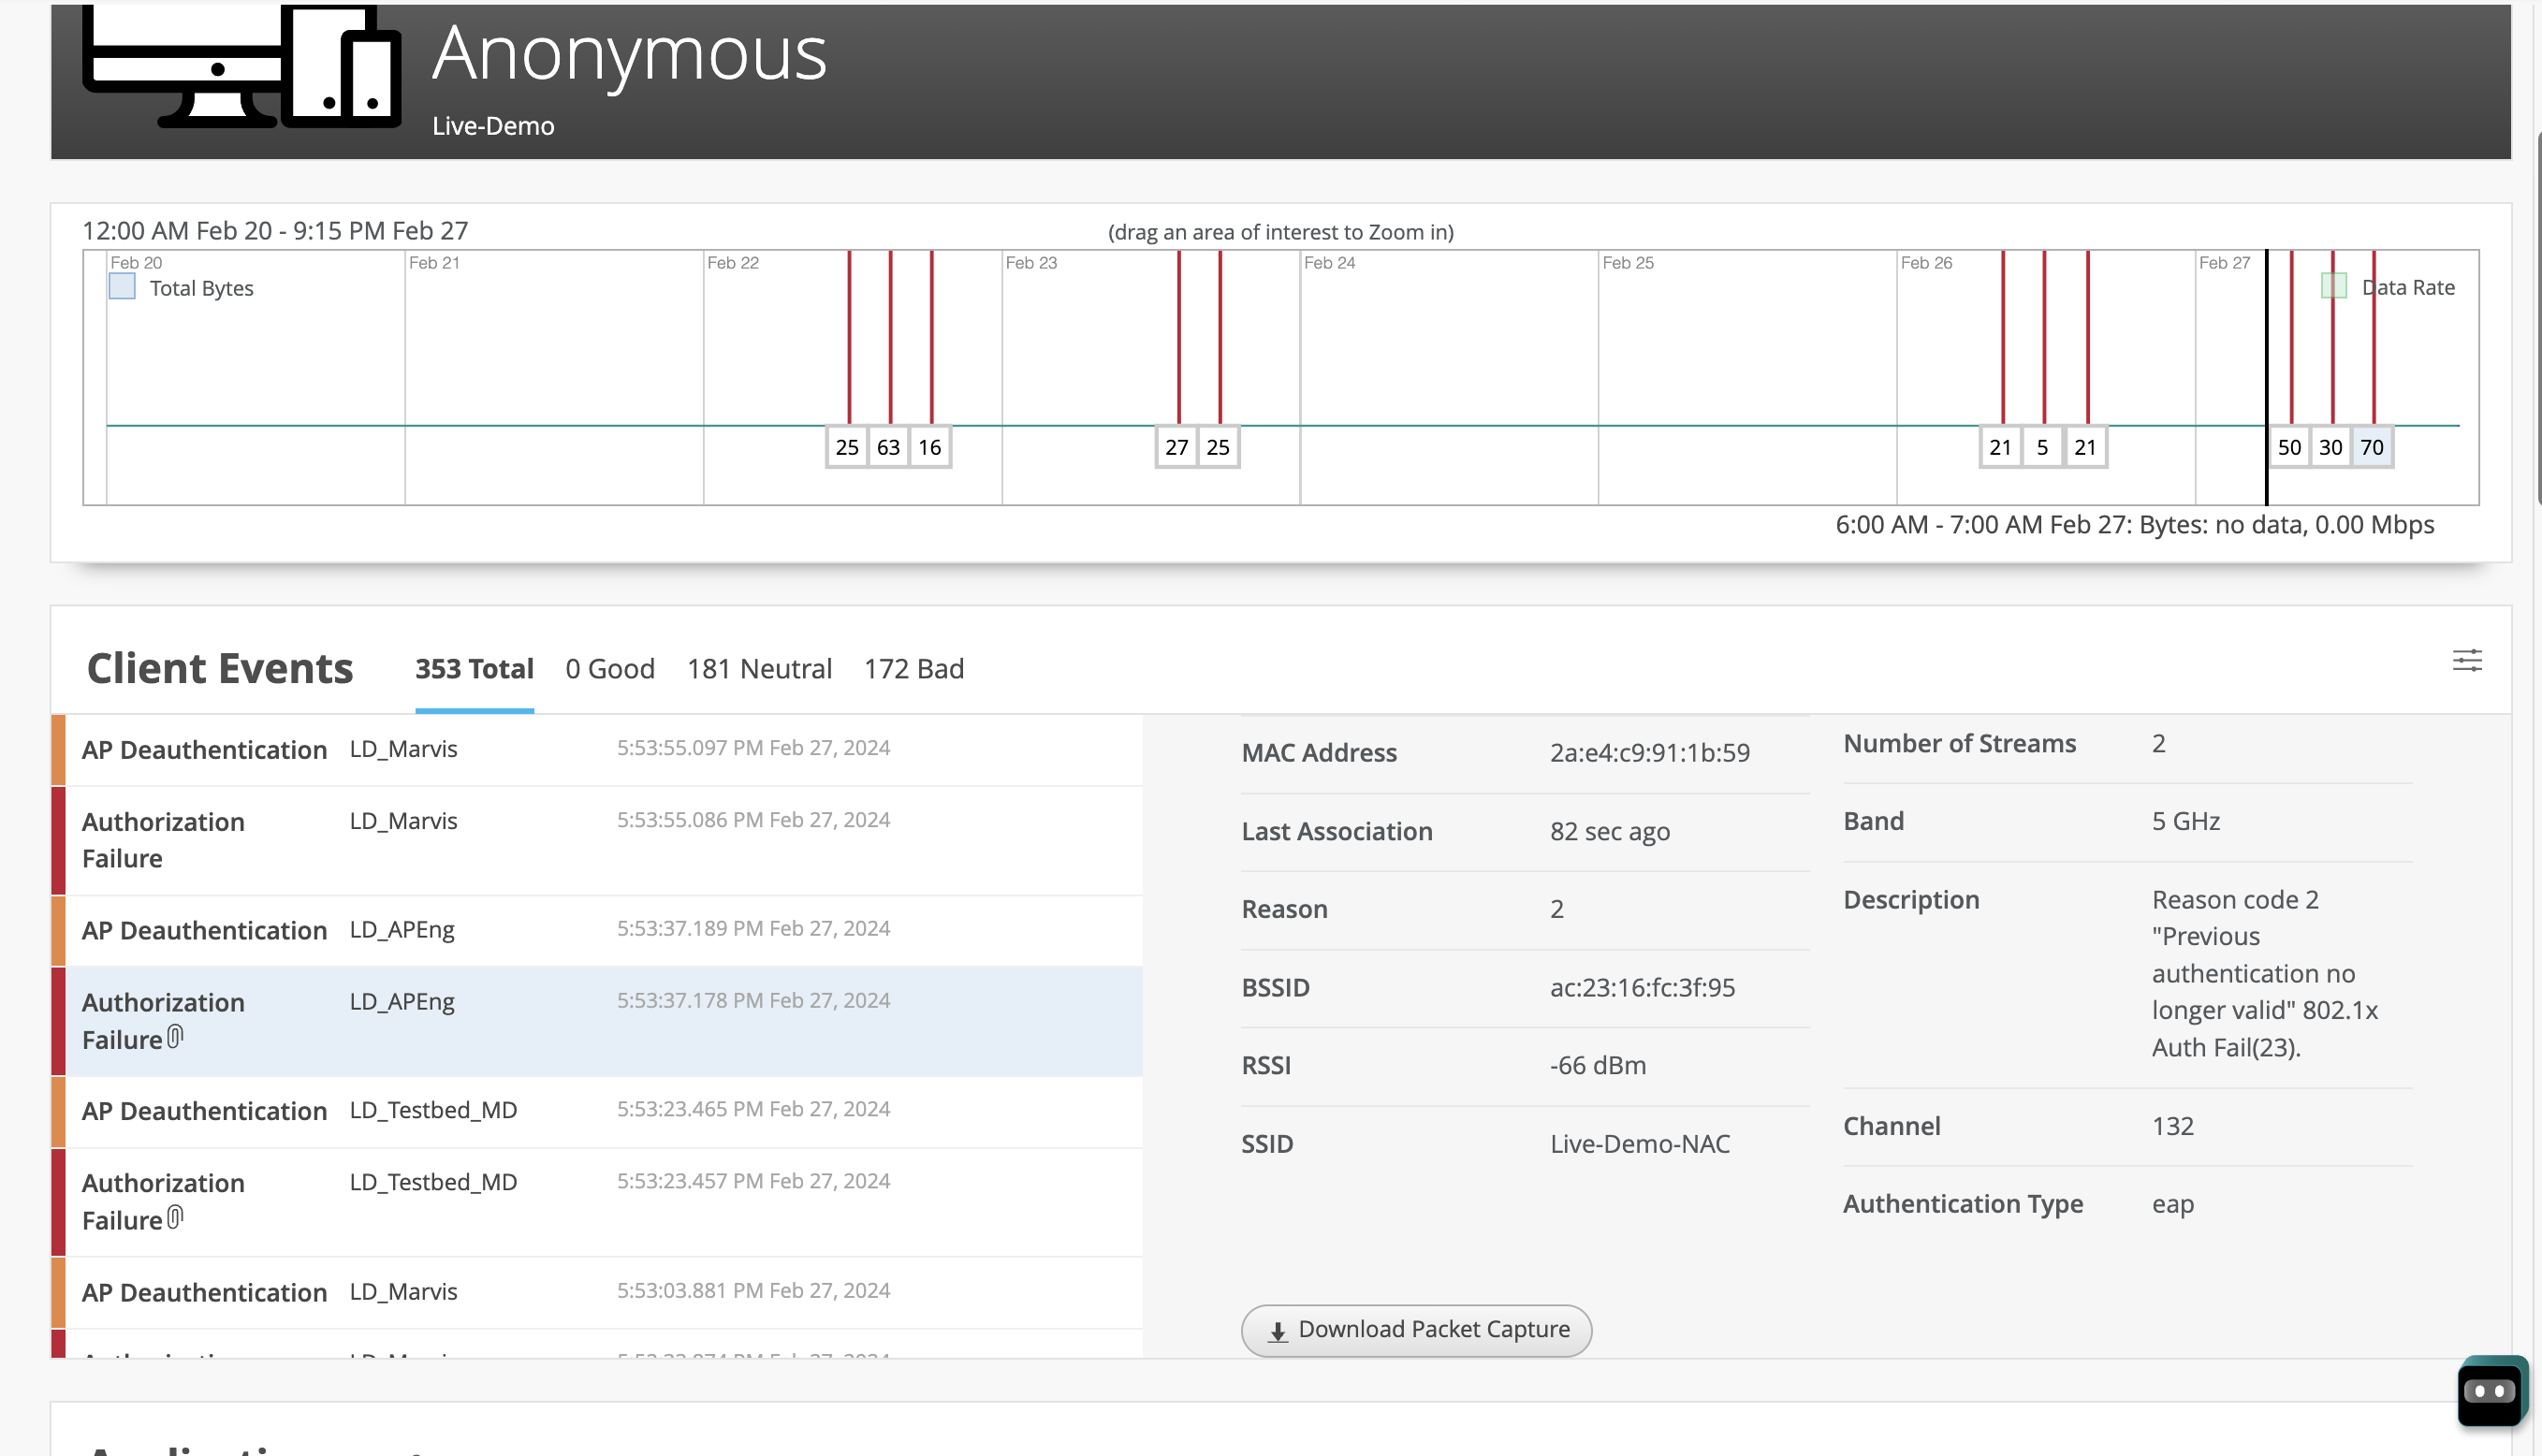
Network monitoring dashboard showing data usage graph from February 20 to 27, client events like AP Deauthentication, client details including MAC Address and RSSI, and a download packet capture button.

您还可以下载授权失败的数据包捕获。下面是一个数据包捕获示例。您可以看到,客户端不响应身份请求,并且反复尝试连接而不提供客户端身份响应。
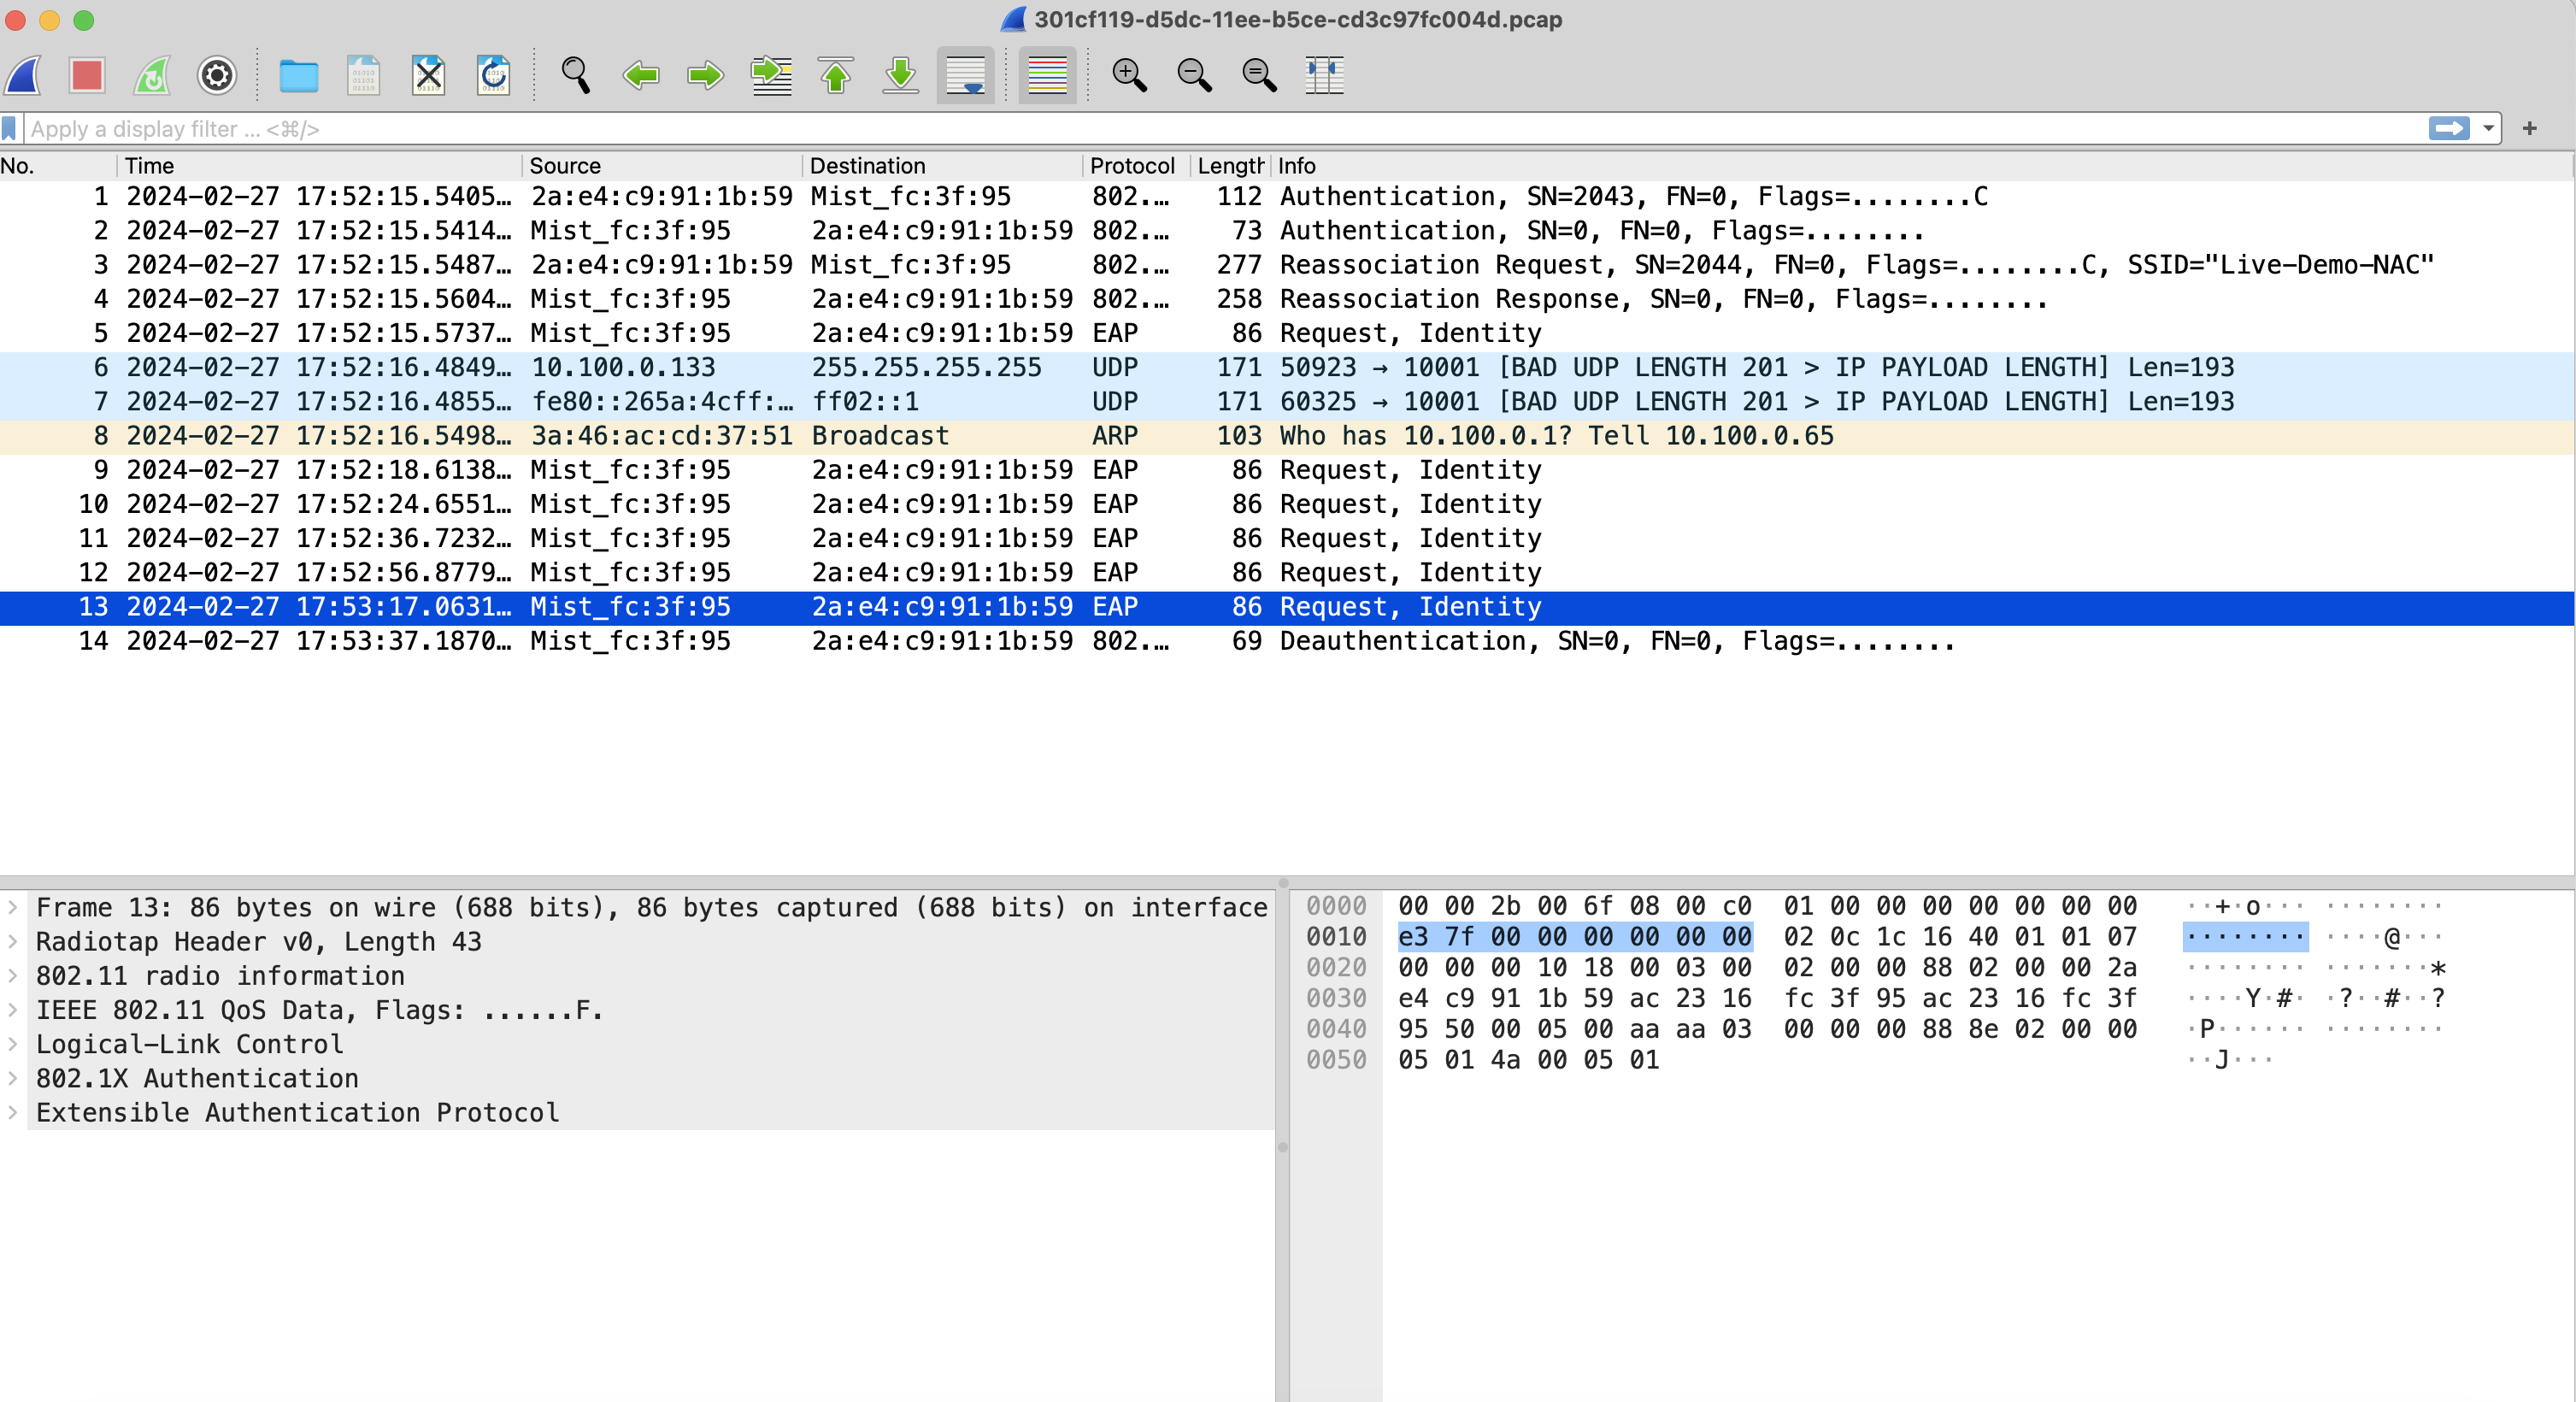
Wireshark interface analyzing network packet capture with highlighted EAP Request Identity message, showing packet list, details, and raw data bytes.

DHCP 问题故障排除

当客户端由于动态主机配置协议 (DHCP) 服务器缺乏响应而无法获取 IP 地址时,可能会面临连接问题。

要排除 DHCP 问题,请执行以下操作:

  1. 在 Marvis 对话助手窗口中,输入 tshoot client 后跟客户端的 MAC 地址或主机名。在以下示例中,您将看到 Marvis 检测到网络中的 DHCP 问题。
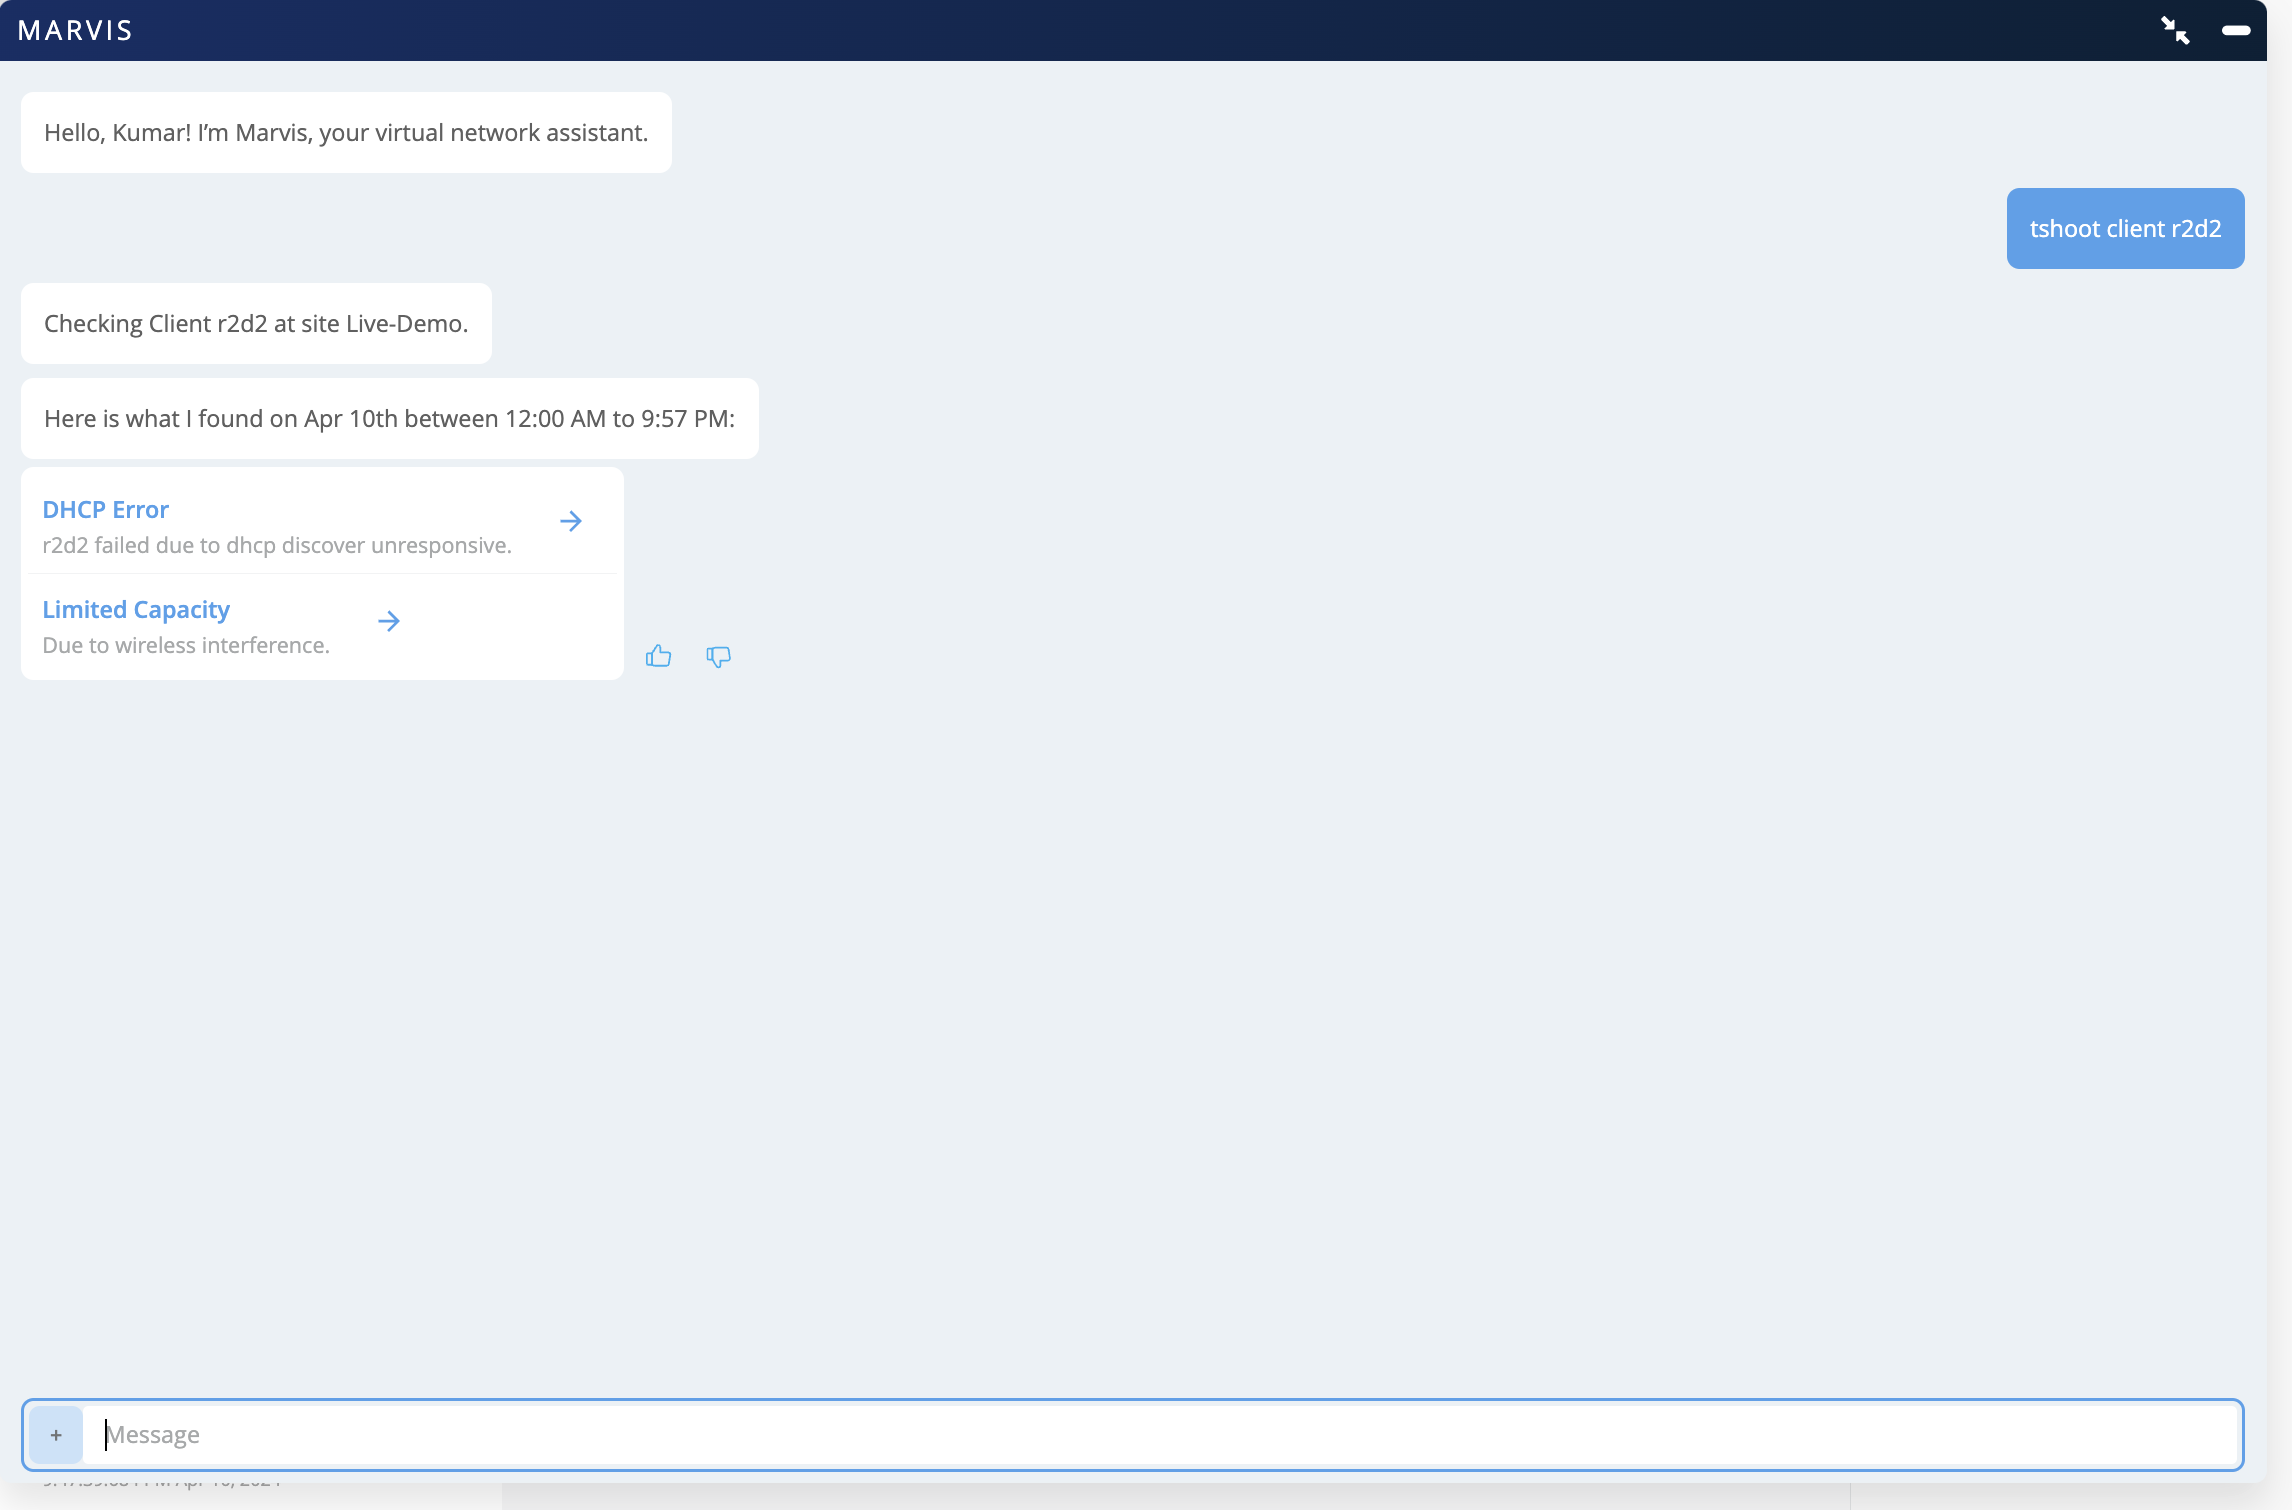
    Virtual network assistant Marvis troubleshooting client r2d2 for April 10th, highlighting DHCP discover unresponsive and wireless interference issues. Links for details and feedback options available.

  2. 单击 DHCP 错误以 查看详细信息。在以下示例中,您会看到 Marvis 报告特定客户端在 100% 的情况下都面临 DHCP 故障。
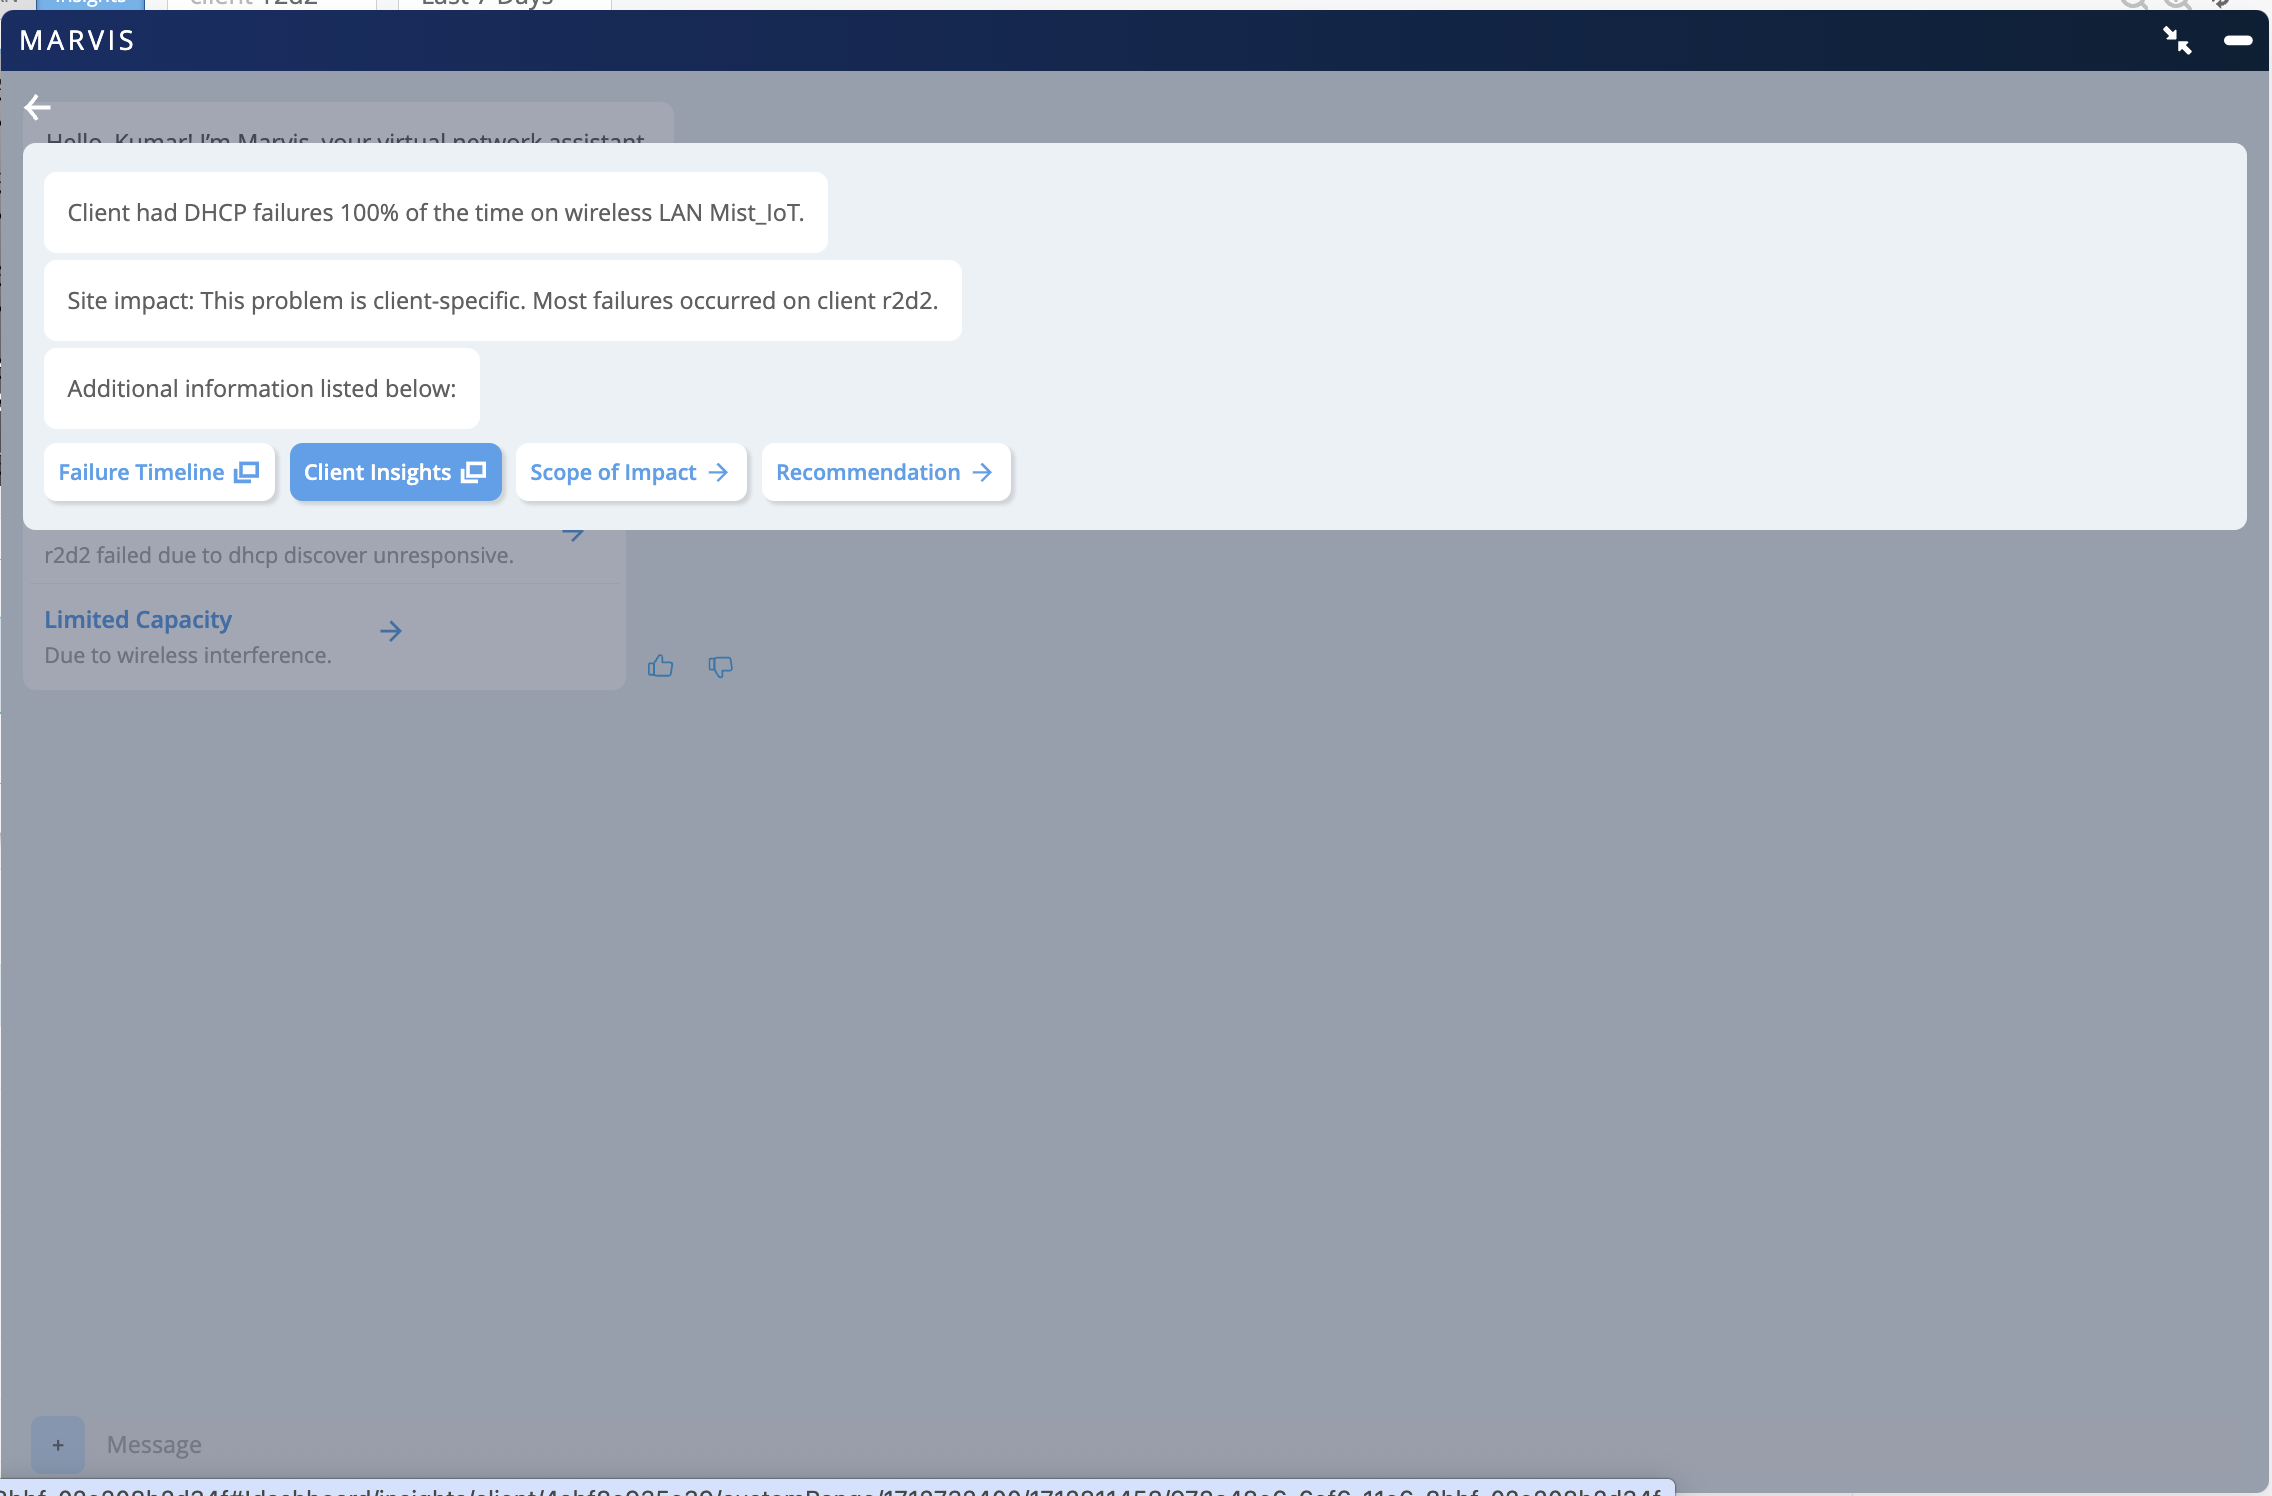
    Network troubleshooting interface from Marvis showing DHCP failures 100 percent on Mist_IoT wireless LAN for client r2d2. Options include Failure Timeline, Client Insights, Scope of Impact, and Recommendation.

可以使用显示的选项进行进一步调查。

影响范围

可以先查看“影响范围”,其中列出了成功和失败的连接尝试。您可以使用右侧的下拉列表检查客户端是否在一个 WLAN/接入点或多个 WLAN/AP 上发生故障。
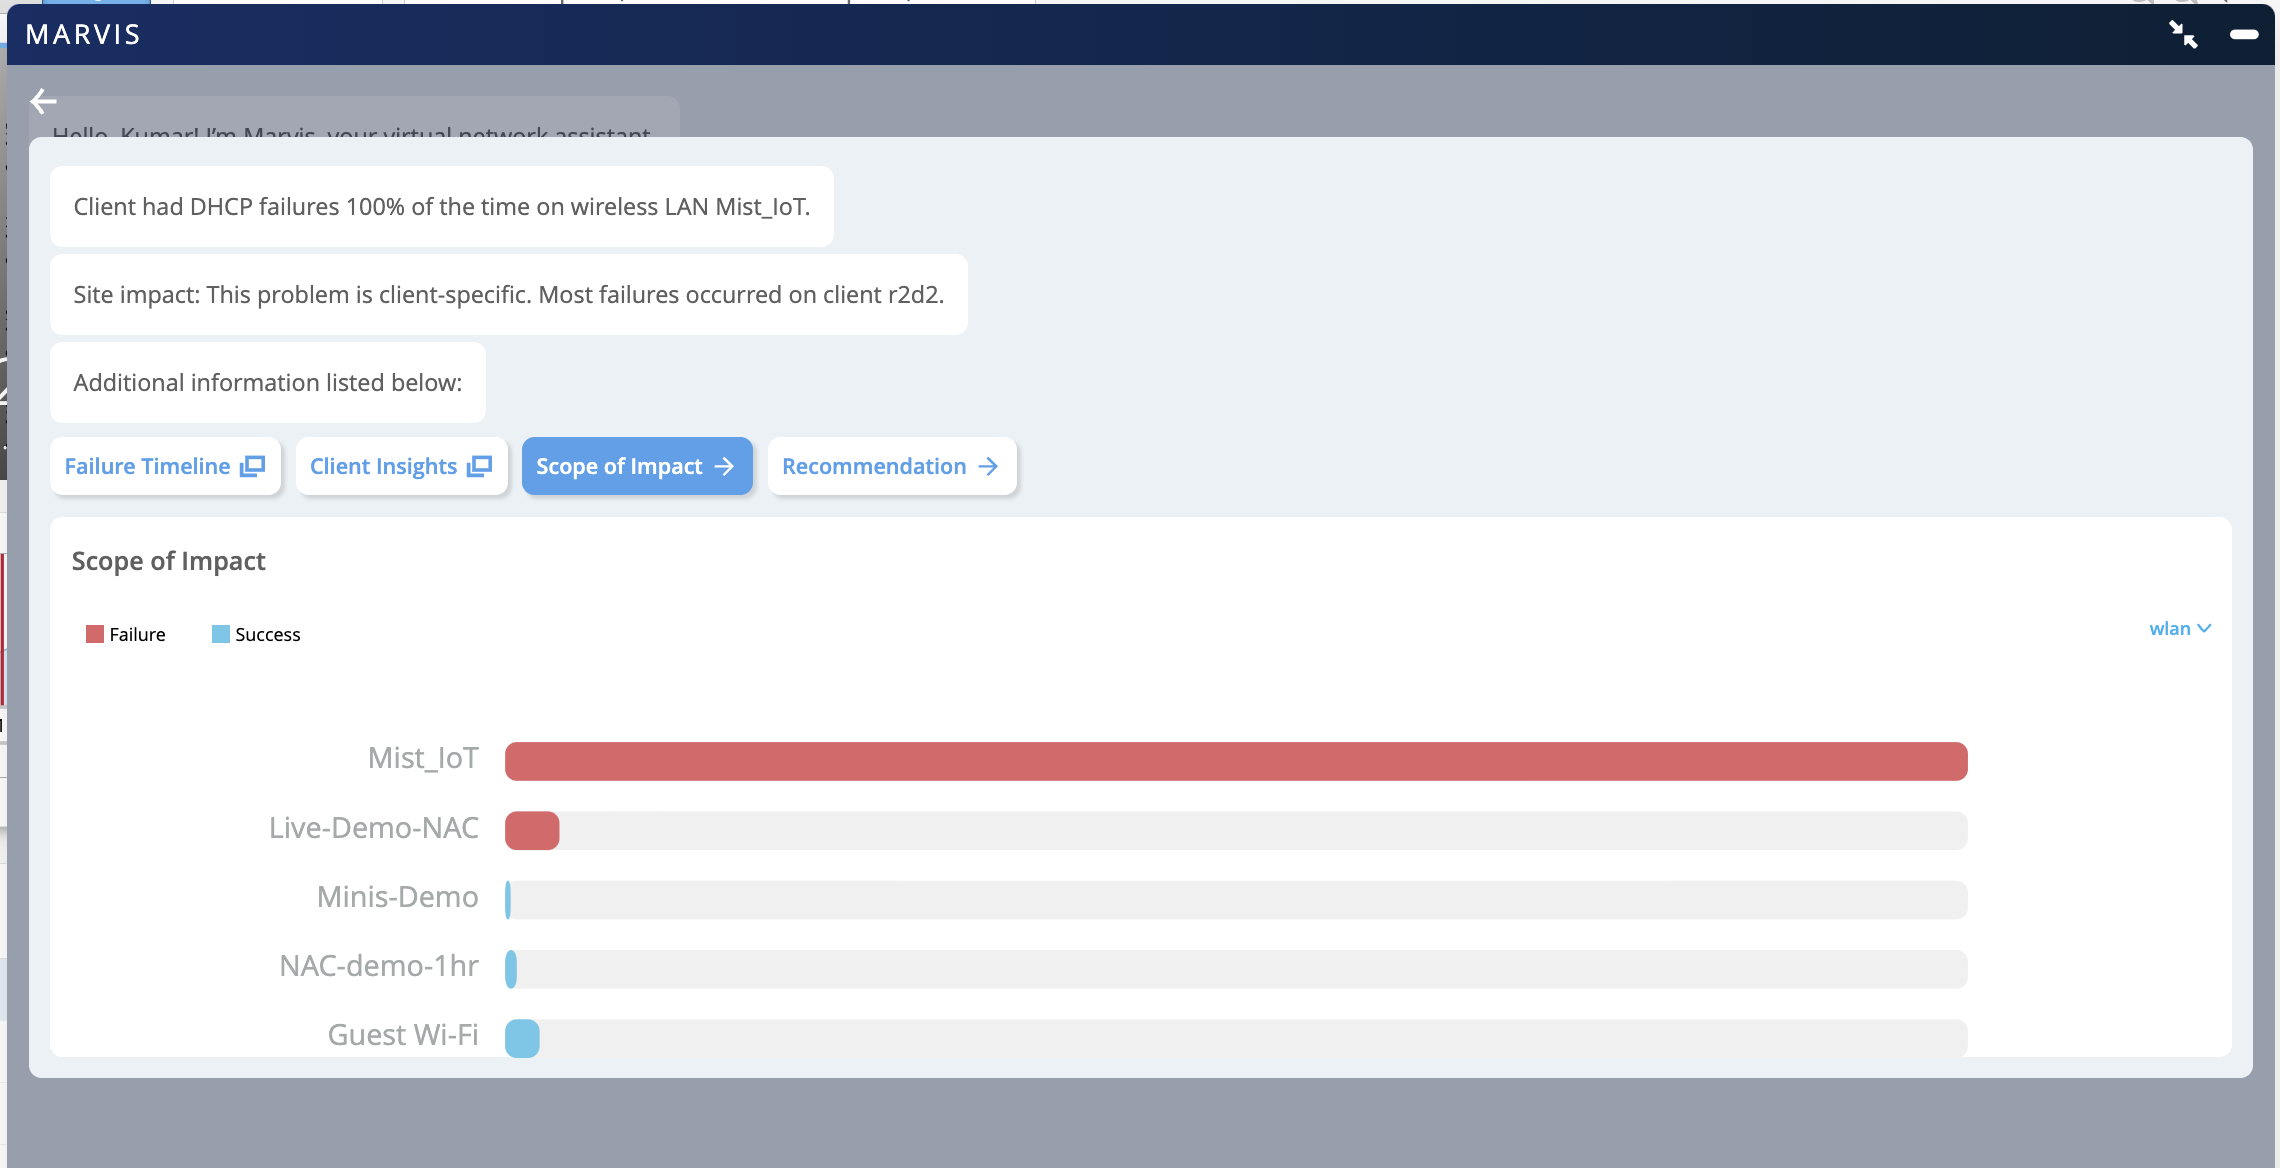
Network troubleshooting interface showing diagnostic details of DHCP failures on Mist_IoT wireless LAN. Tabs include Failure Timeline, Client Insights, Scope of Impact, and Recommendation. Scope of Impact bar chart highlights total failure on Mist_IoT network and partial successes on other networks like Live-Demo-NAC and Guest Wi-Fi.

客户端洞察

您还可以单击 客户端见解 以查看所有与客户端相关的事件。您可以单击“DHCP 超时”事件,查看 DHCP 请求失败的 DHCP 服务器的详细信息。
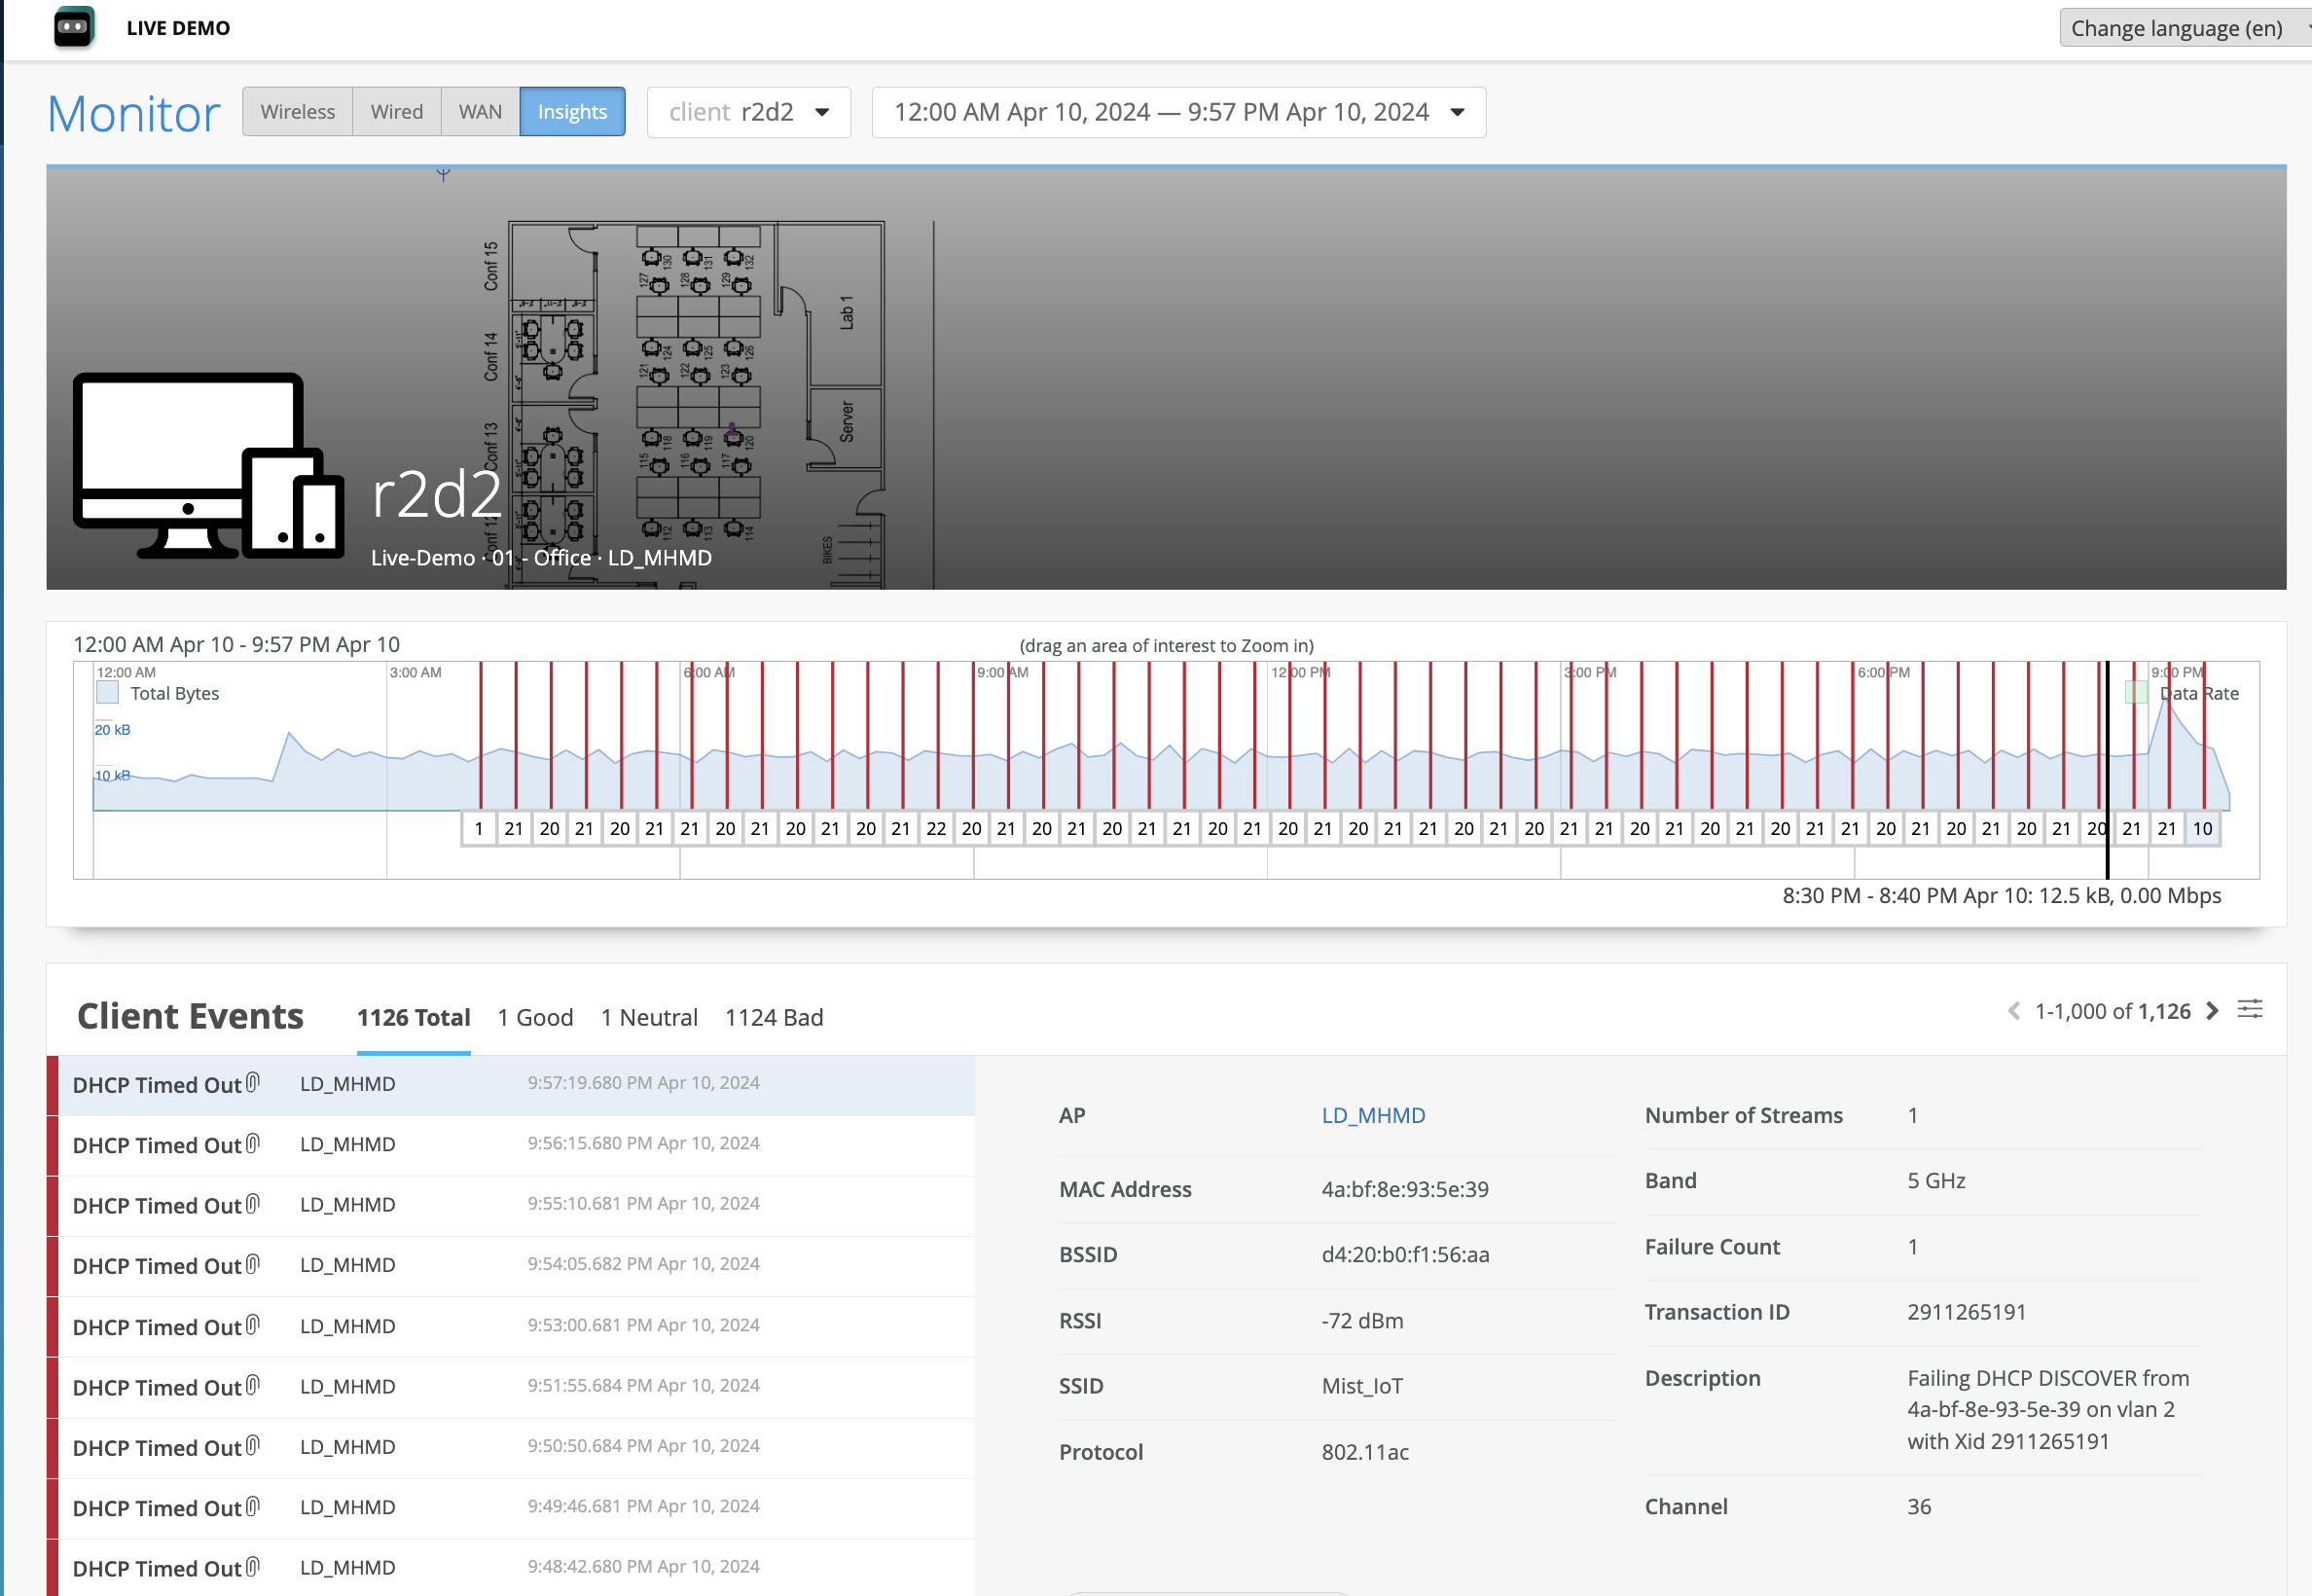
Network monitoring dashboard showing device r2d2 data usage graph, DHCP timed-out events, and technical details like MAC address, RSSI, and SSID.

您可以下载特定事件的动态数据包捕获。以下是遇到 DHCP 超时事件的客户端的数据包捕获示例。
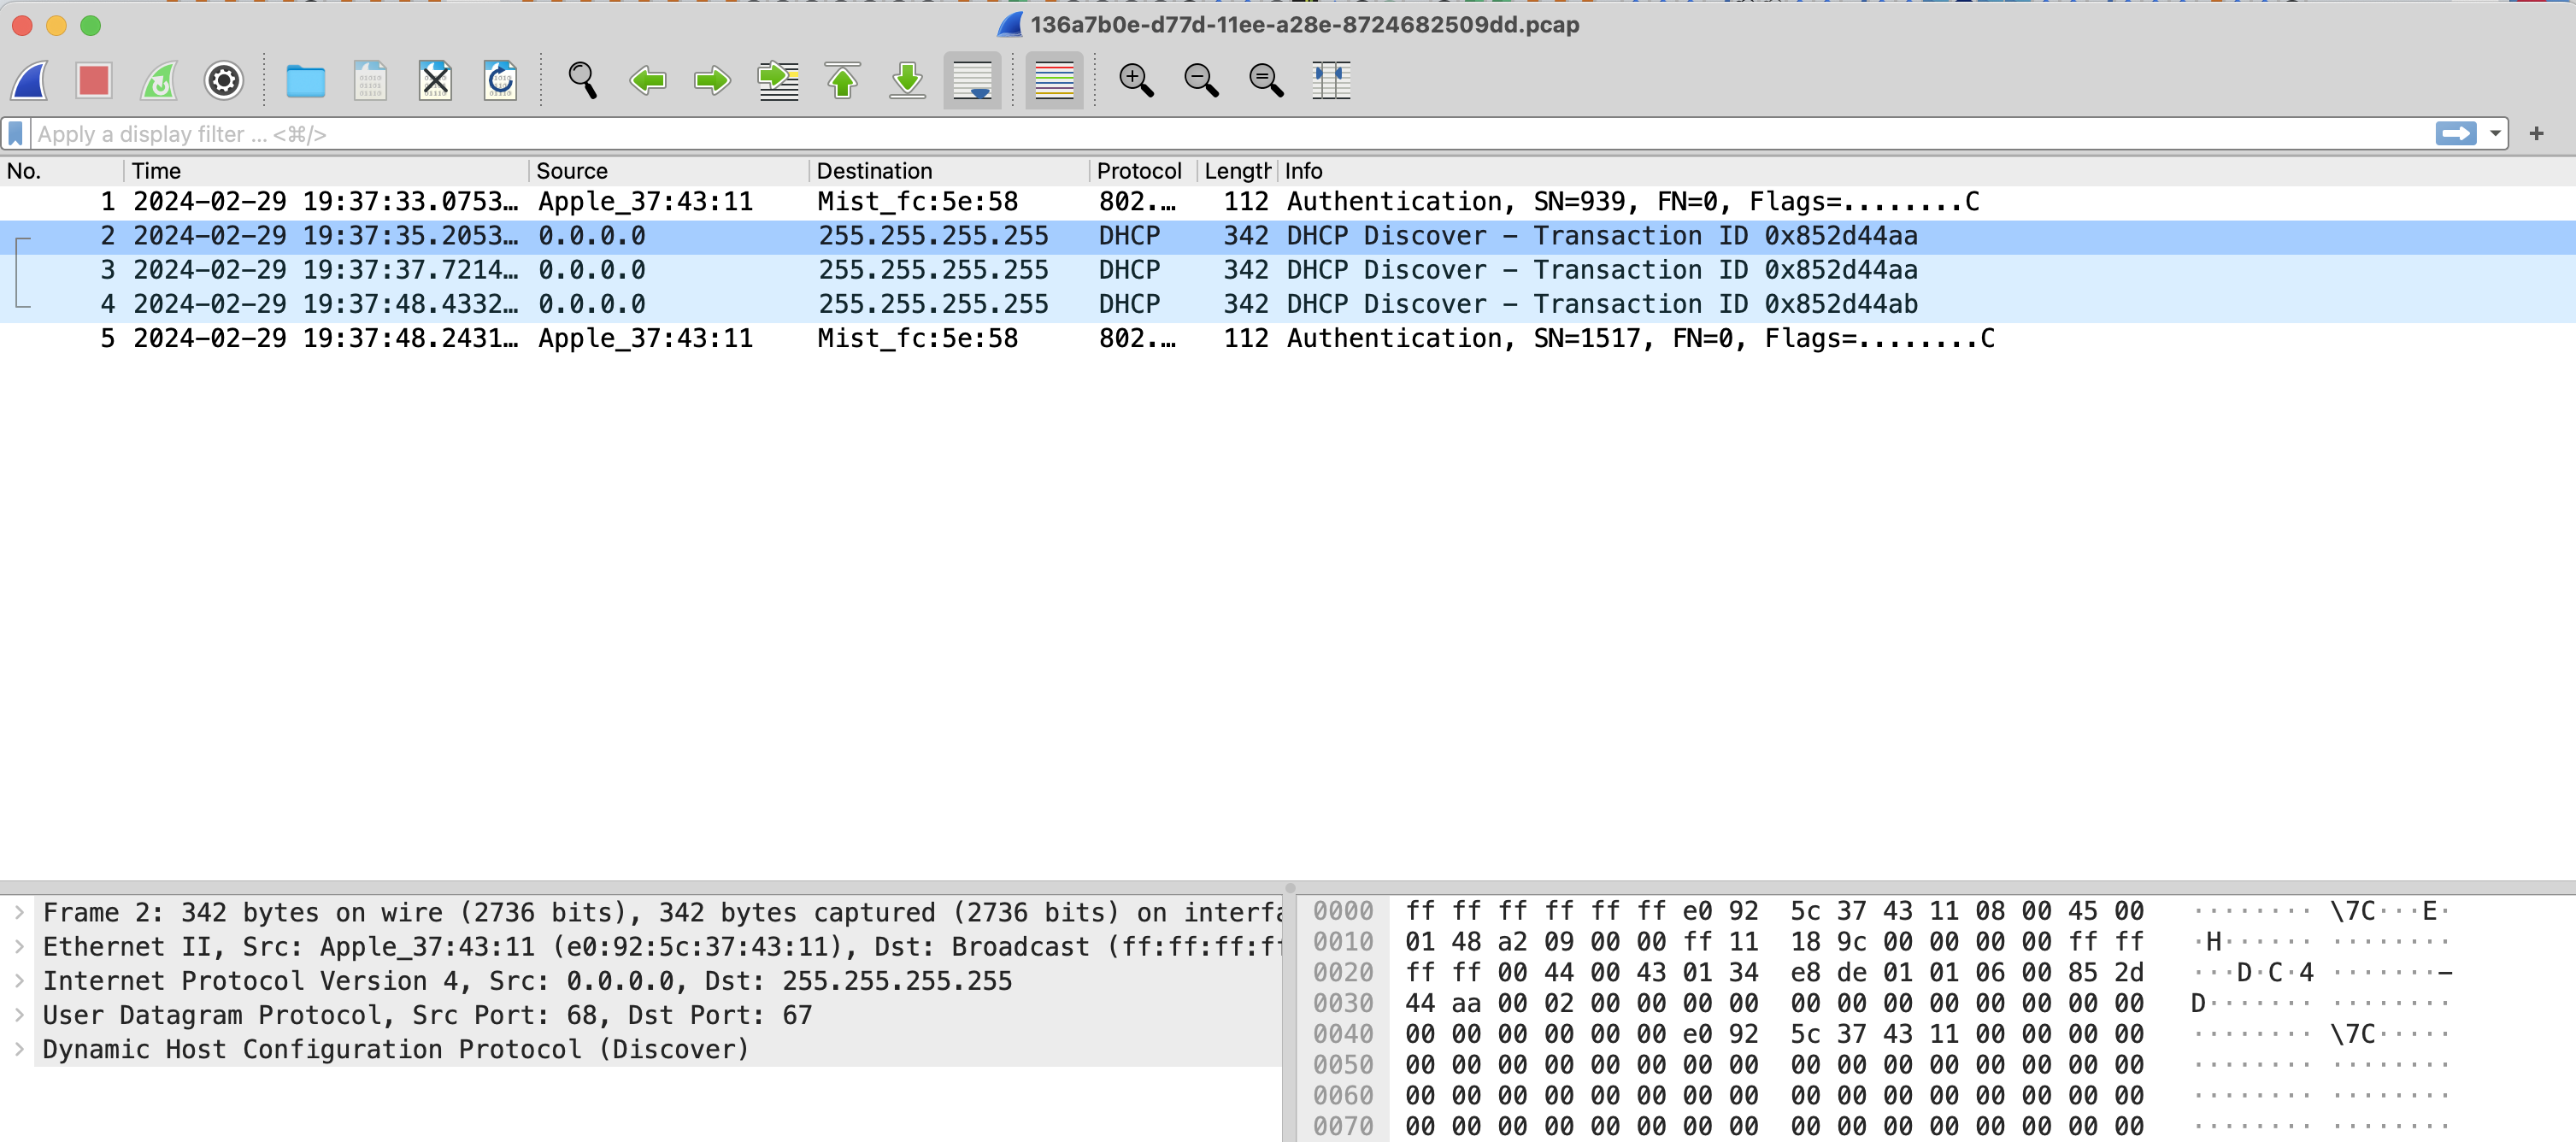
Screenshot of a Wireshark network packet capture showing DHCP Discover packets with source 0.0.0.0 and destination 255.255.255.255, detailed protocol layers, and raw packet data.

PSK 故障故障排除

当大量客户端无法向 PSK WLAN 进行身份验证时,Marvis 会检测预共享密钥 (PSK) 故障。此问题的一个可能原因可能是最近未传达给用户的 PSK 更改。

要排除 PSK 故障,请执行以下操作:

  1. 在 Marvis 对话助手窗口中,输入 tshoot 后跟客户端的 MAC 地址或主机名。在以下示例中,您将看到 Marvis 报告了由于无线密码不正确而导致的授权问题。
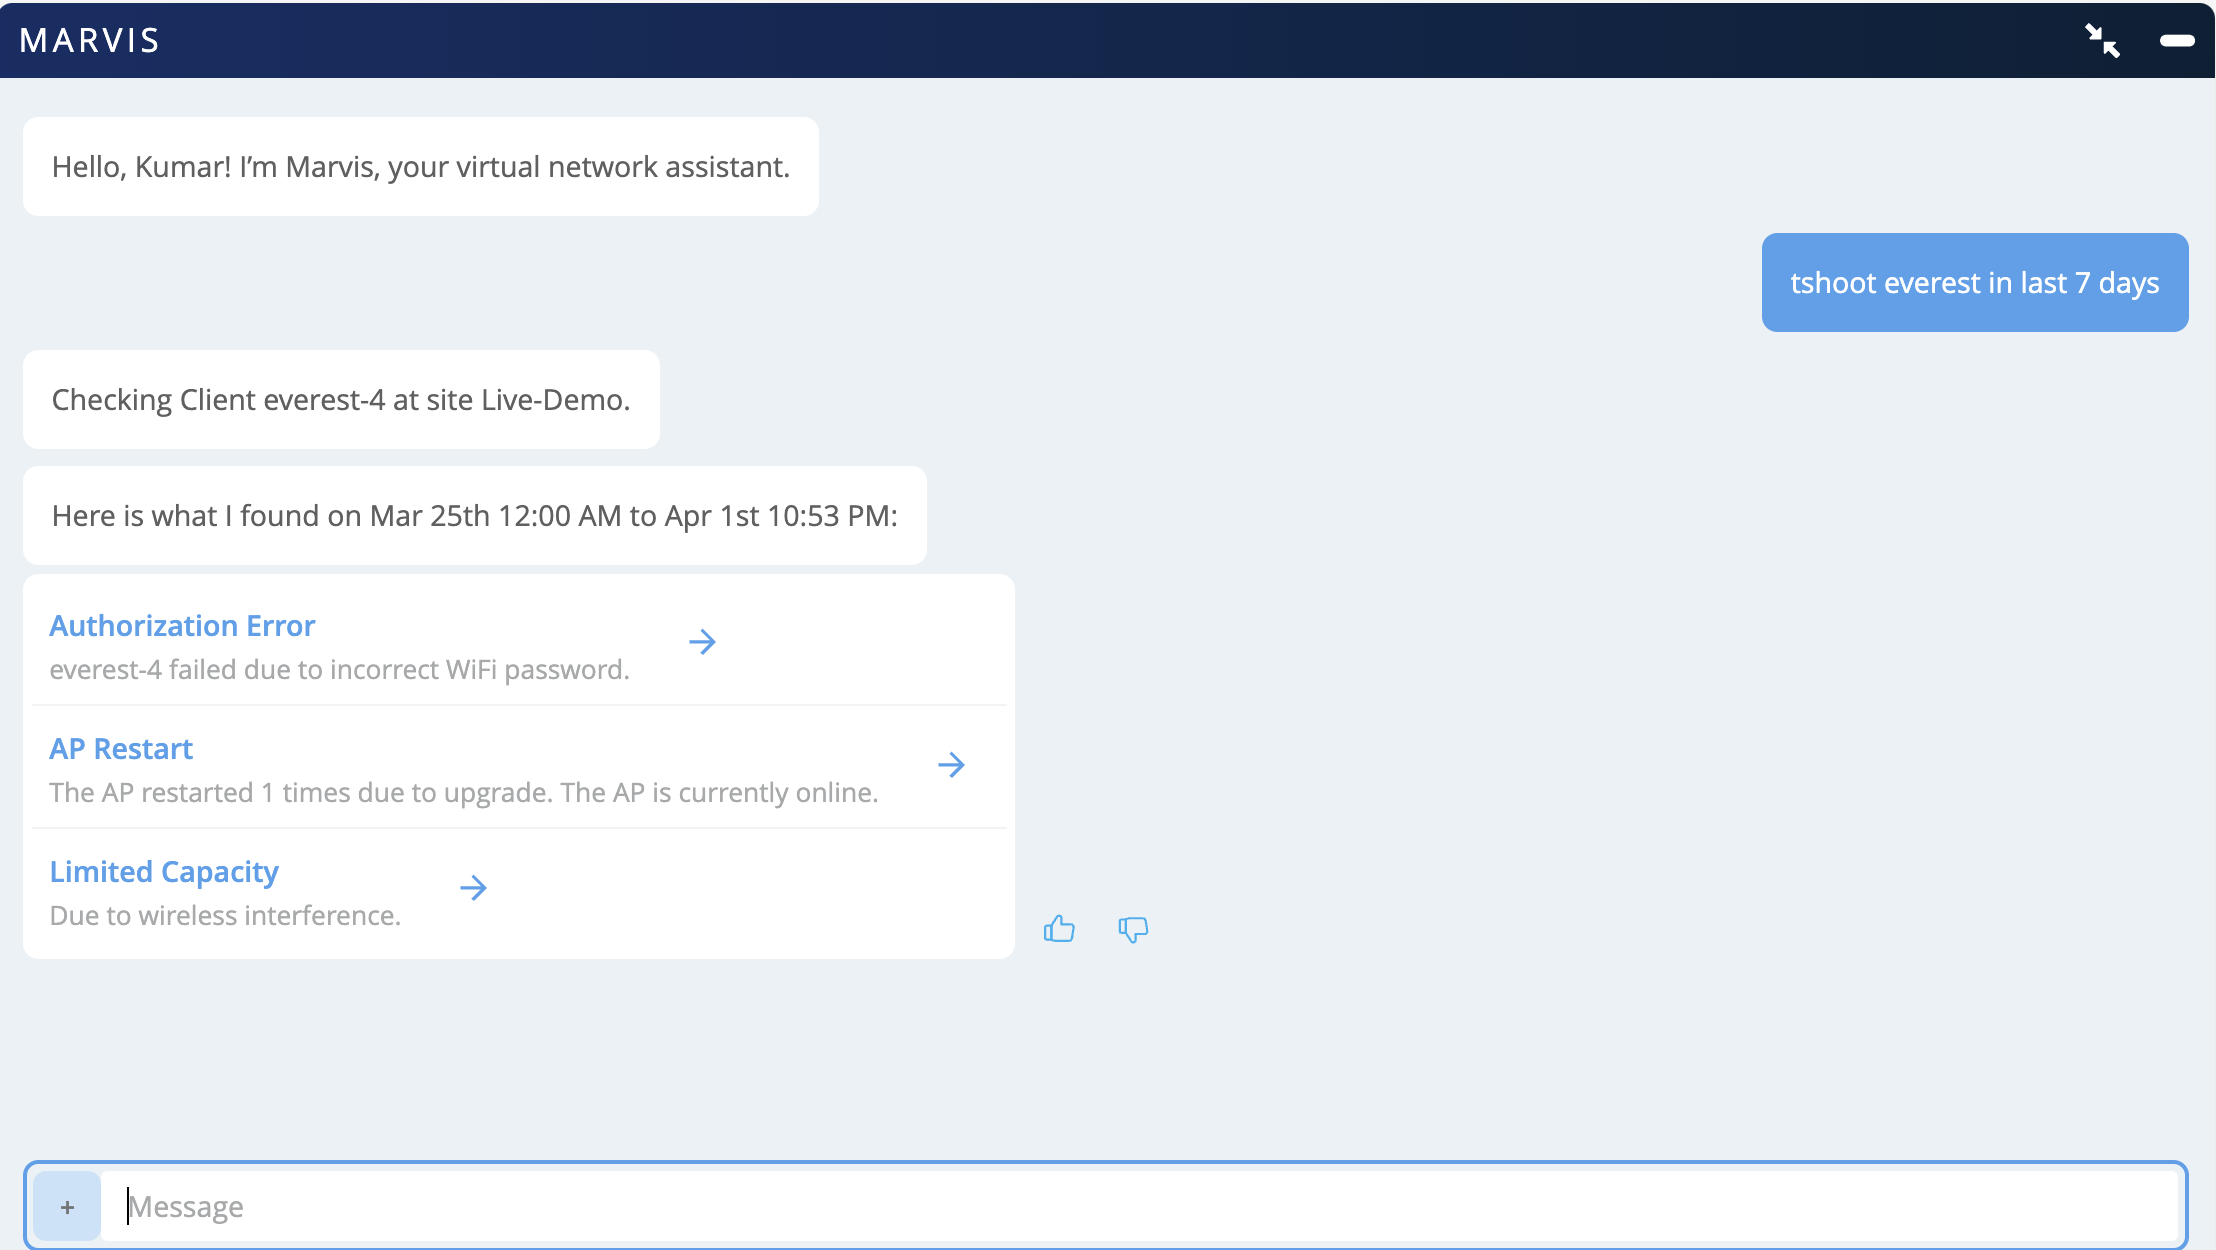
    Virtual network assistant Marvis responds to a query about troubleshooting client everest-4 over 7 days, listing findings: authorization error due to incorrect WiFi password, AP restarted once due to upgrade, and limited capacity from wireless interference, with links for more details and a text input box for interaction.

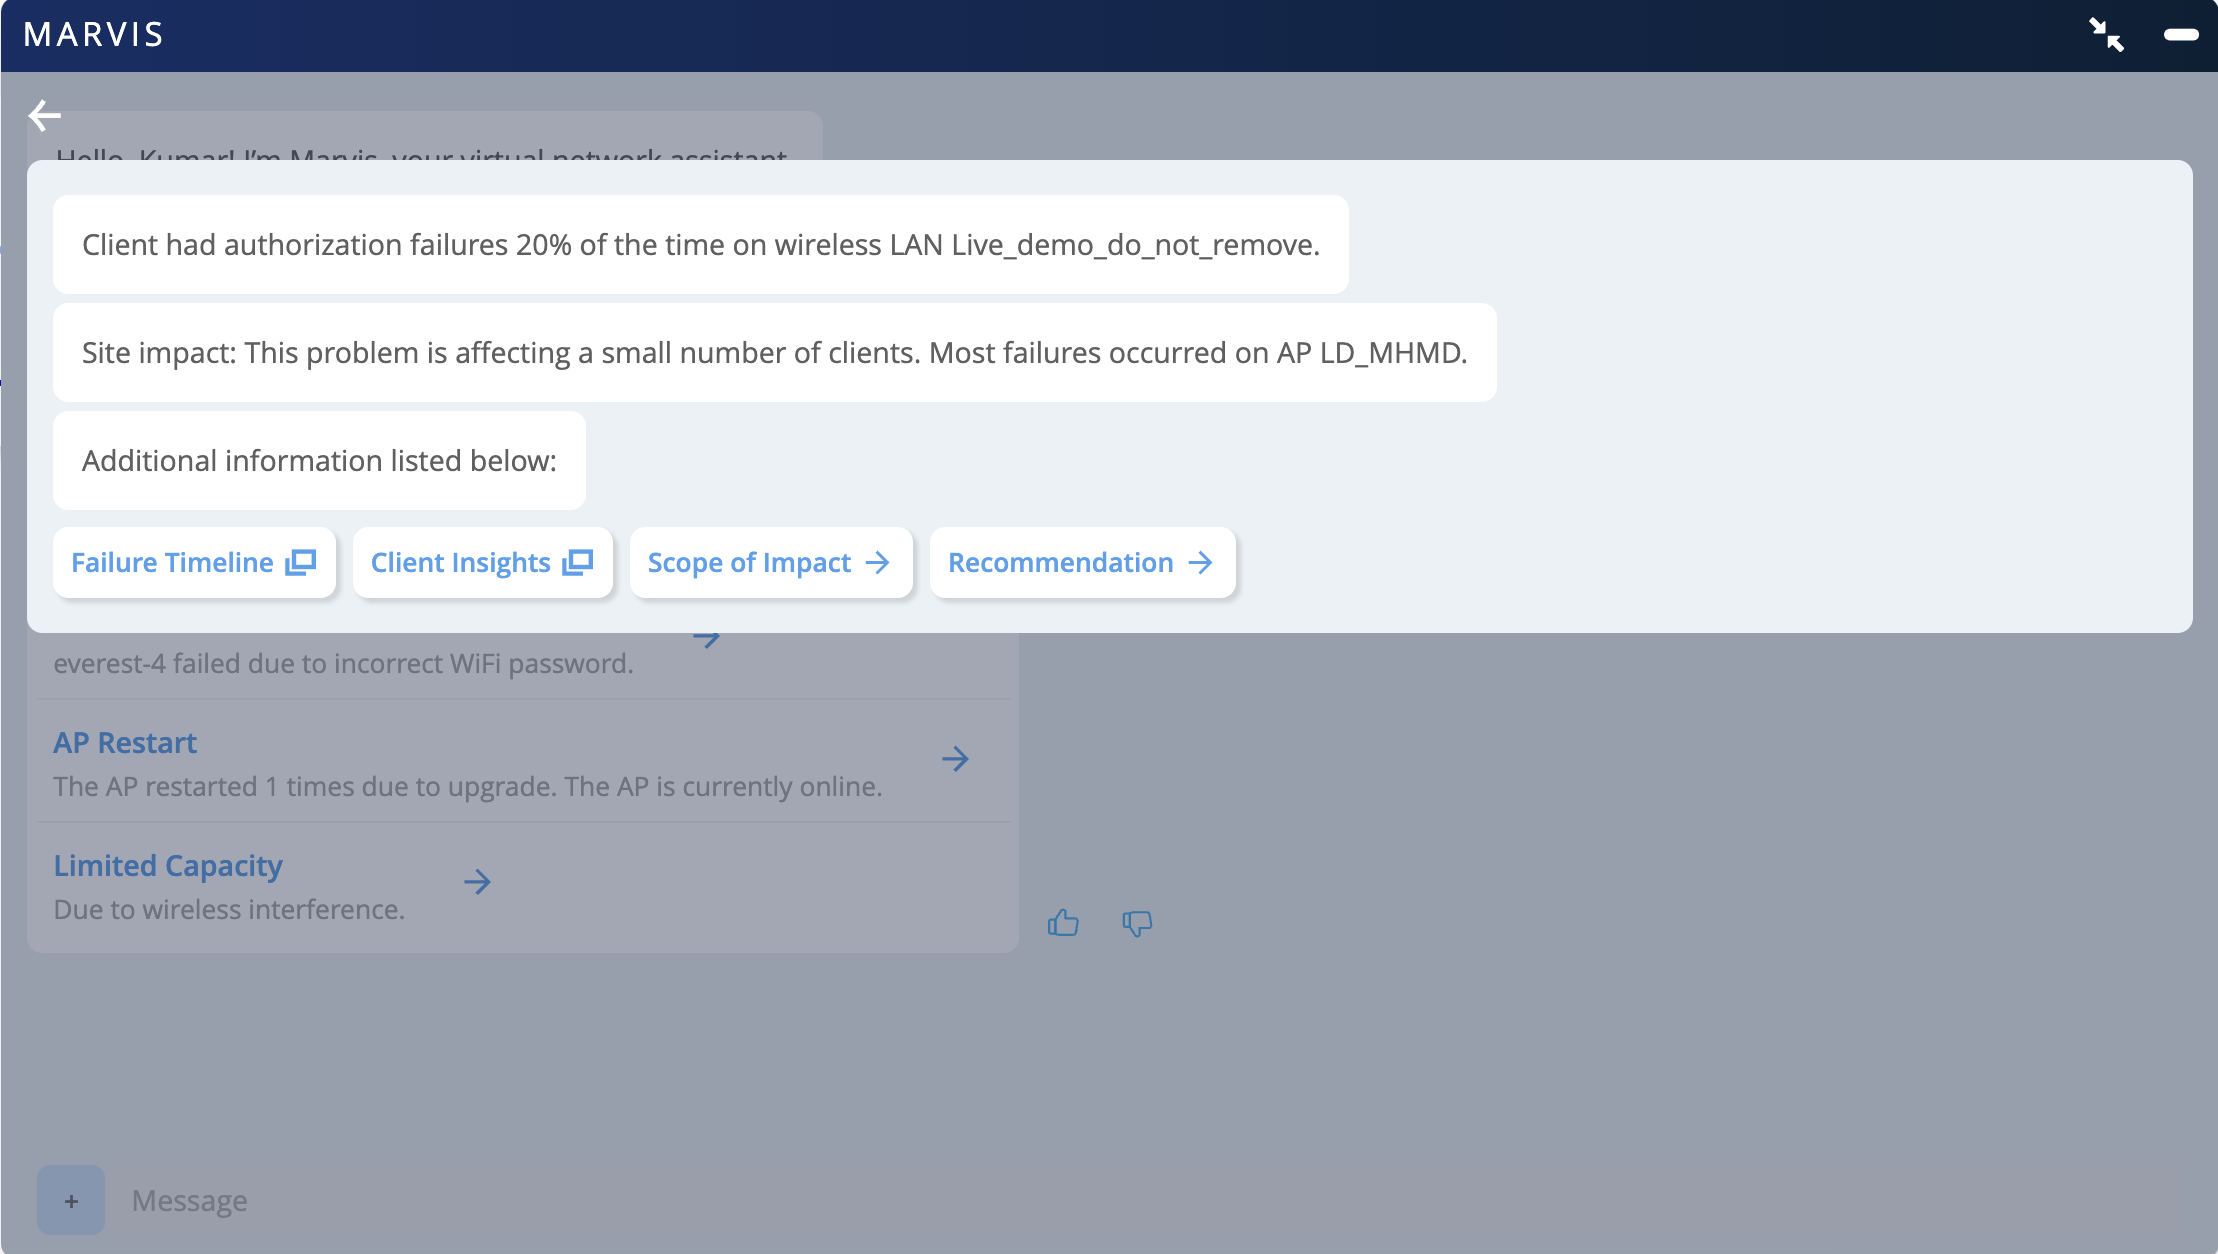
  2. 单击 “授权错误 ”以查看详细信息。

    Network troubleshooting interface from Marvis showing authorization failures 20 percent of the time on WLAN Live_demo_do_not_remove, mostly affecting AP LD_MHMD, with options for further details like Failure Timeline and Recommendation.

使用显示的选项进一步调查。

影响范围

可以先查看“影响范围”,其中列出了成功和失败的连接尝试。您可以检查客户端是否在一个或多个 WLAN 上出现故障。
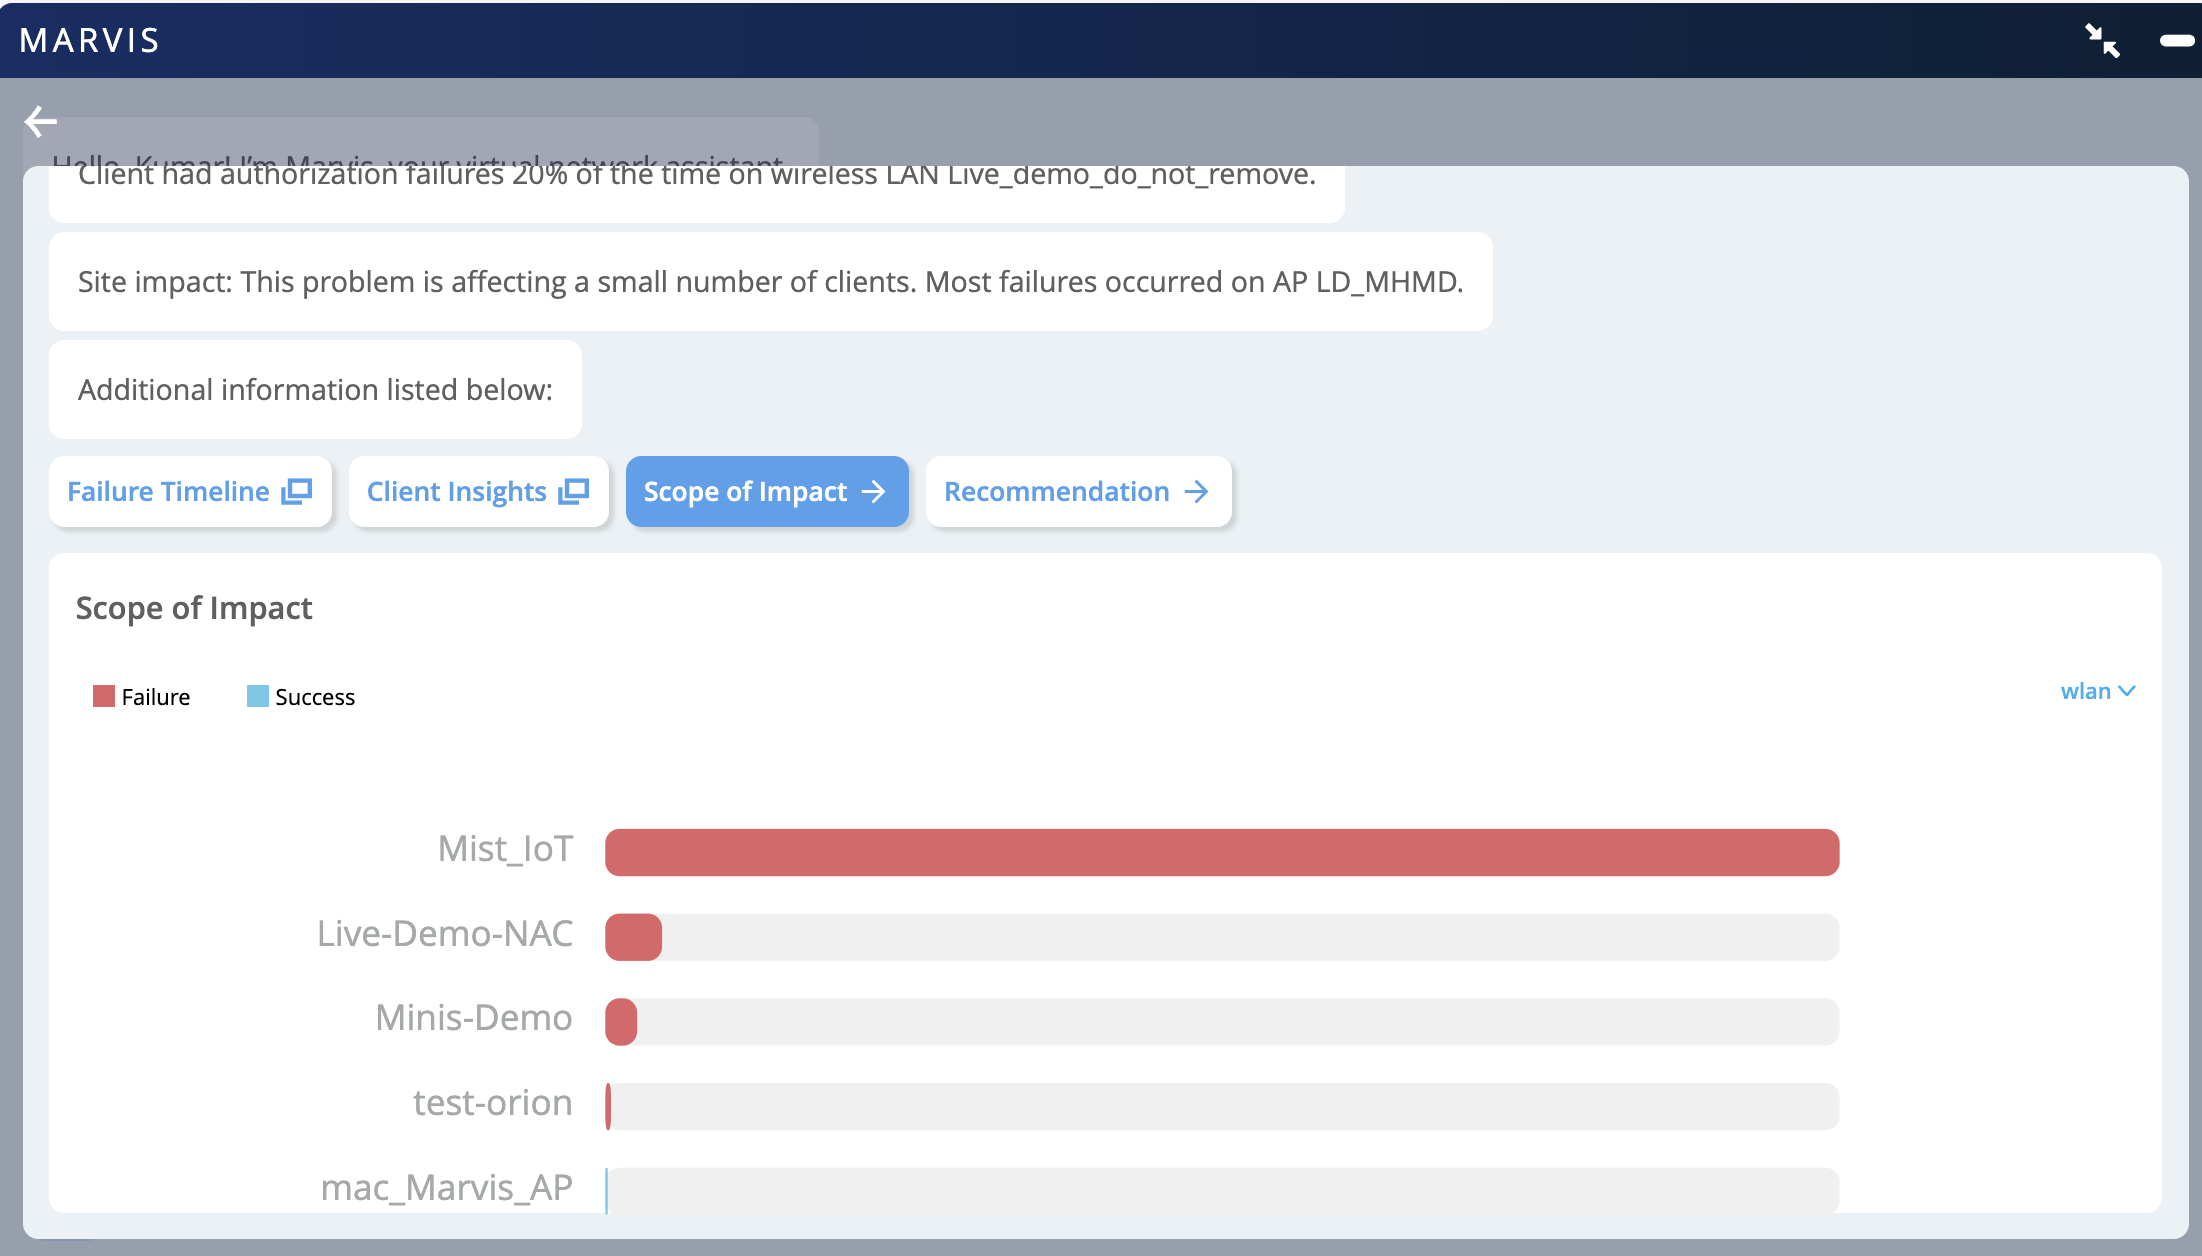
Screenshot of Marvis network analysis tool displaying Scope of Impact section with a bar graph showing WLAN failure and success rates, highlighting 20 percent client authorization failures on a specific WLAN.

客户端洞察

您可以单击 客户端洞察 以查看与客户端关联的所有事件。您可以单击授权失败事件查看失败原因,如以下示例所示。
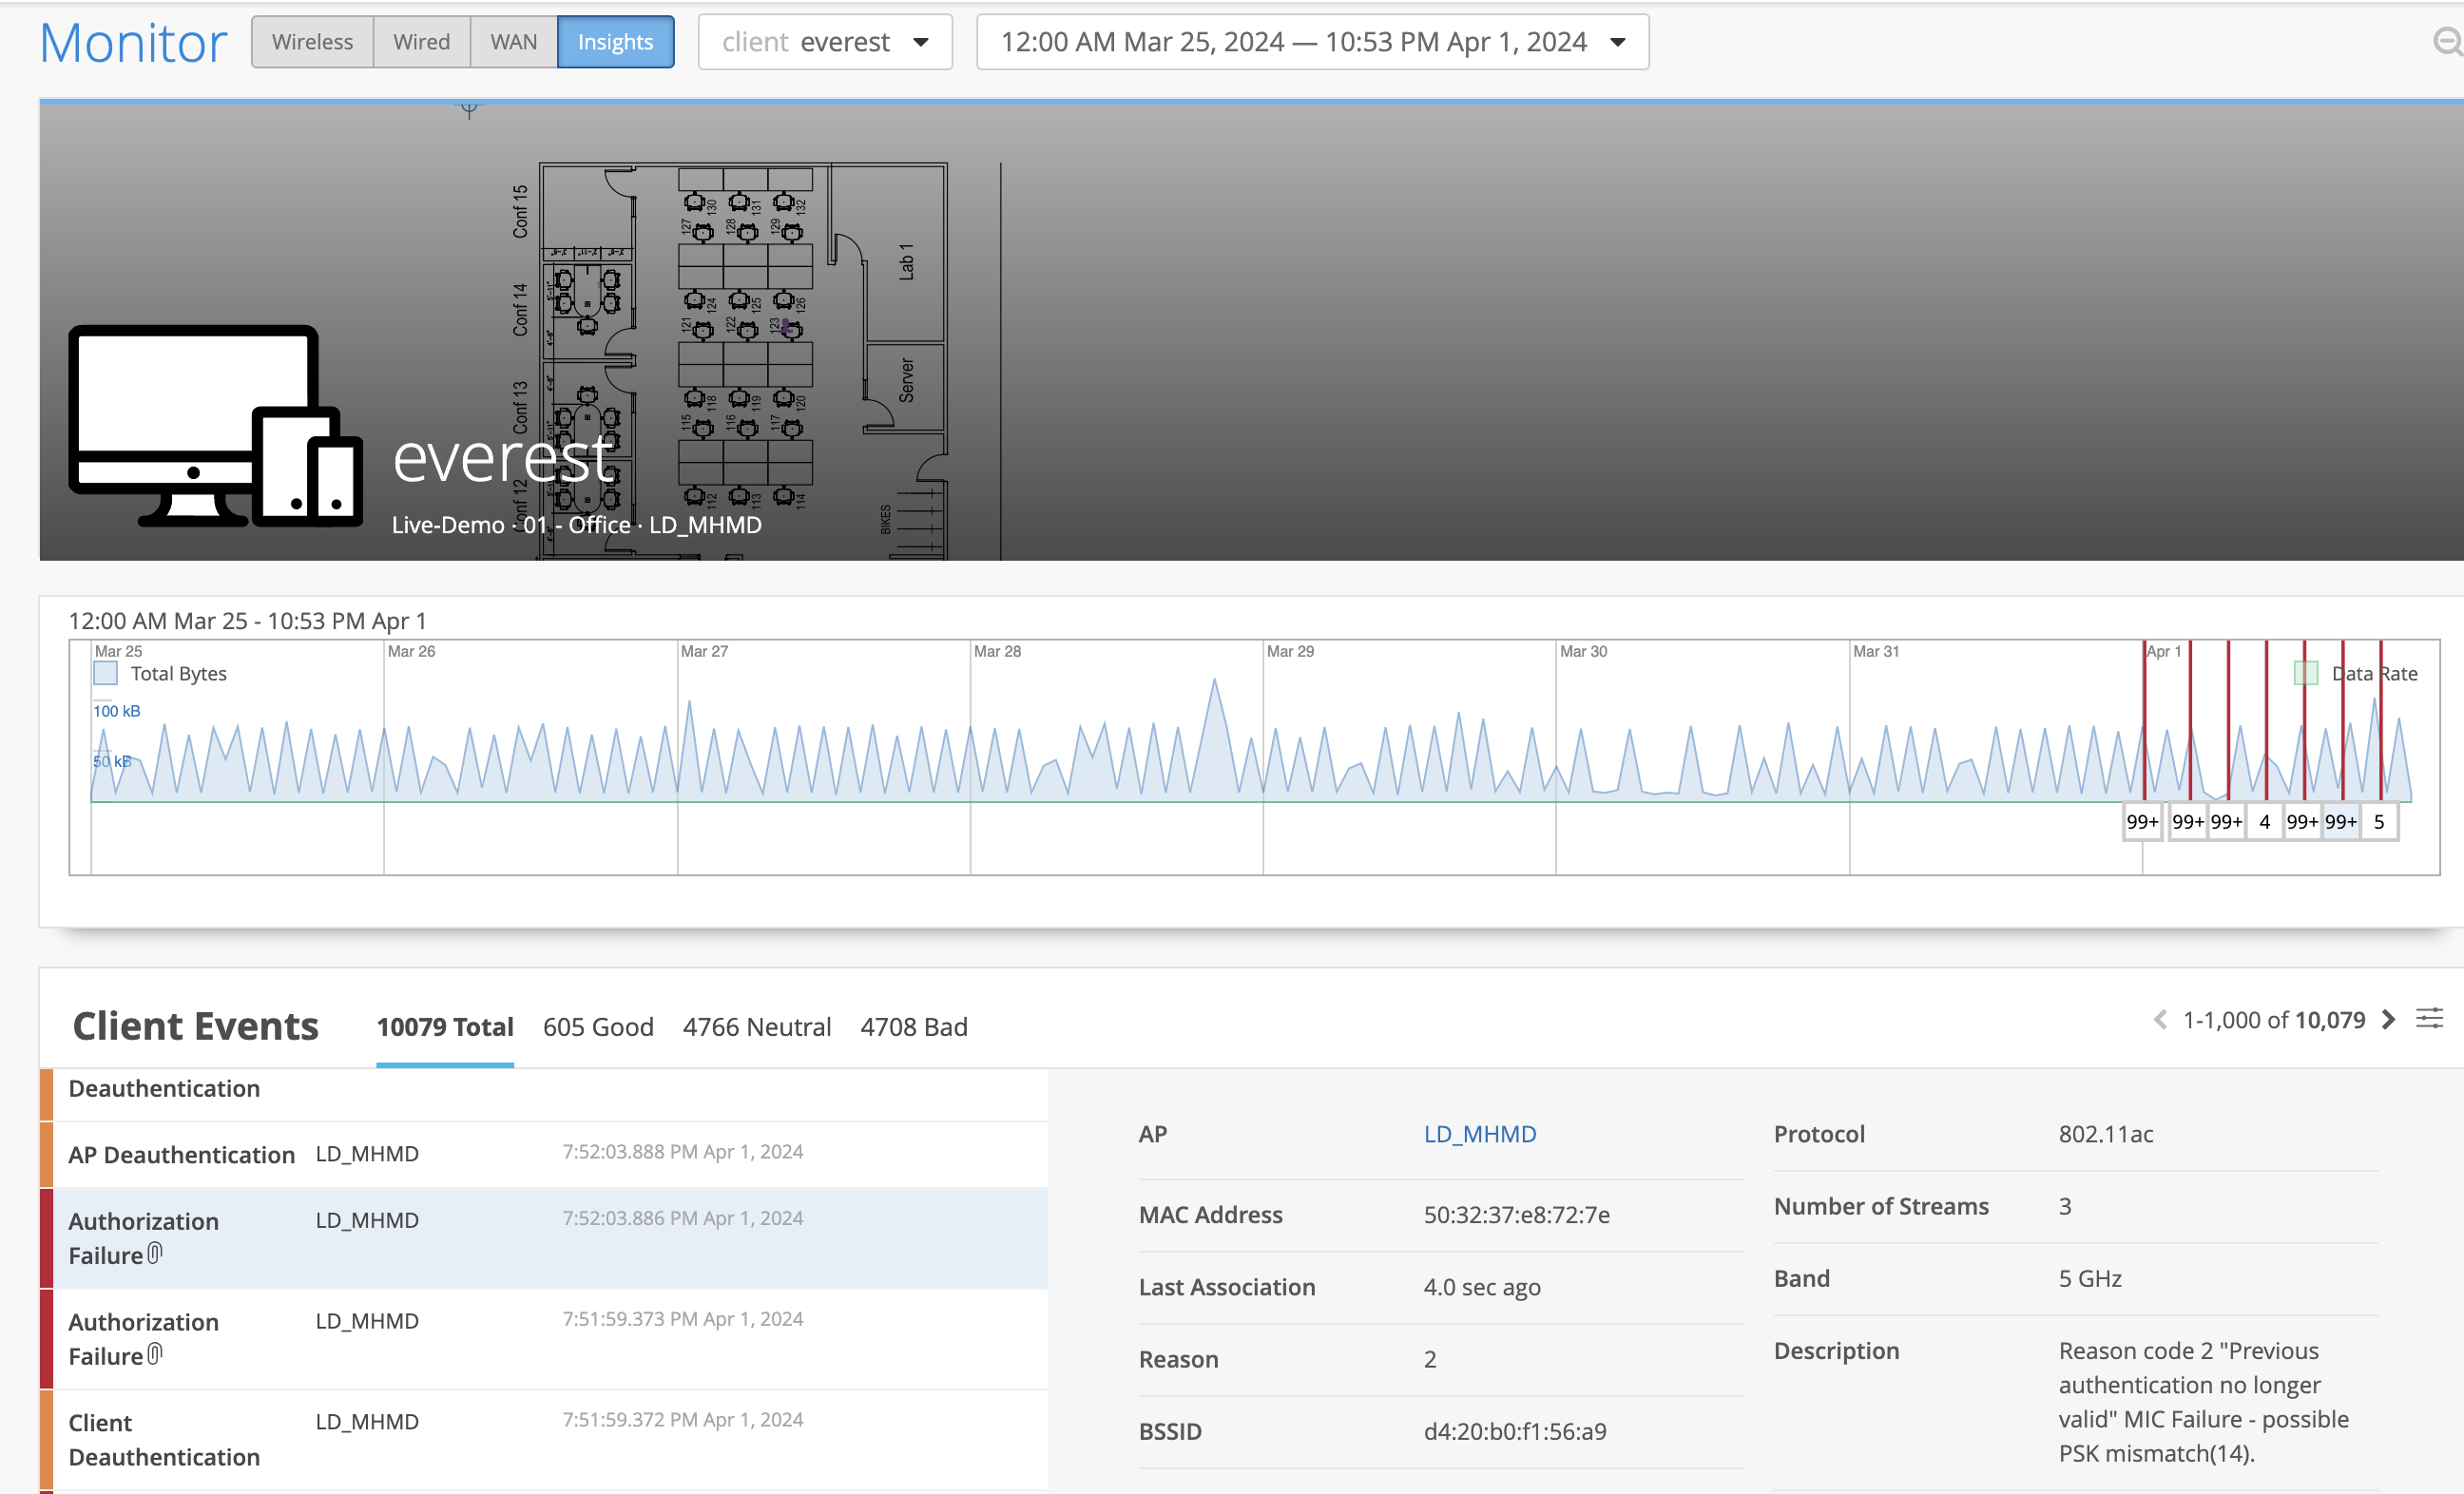
Network monitoring dashboard showing data for client everest from March 25 to April 1, 2024. Includes tabs, search bar, dropdown menus, a floor plan with labeled rooms, a line graph of total bytes over time with marked events, and a table listing 10079 client events categorized as good, neutral, or bad.

RADIUS 身份验证故障故障排除

当 RADIUS 服务器关闭或无法访问时,客户端可能会遇到 802.1x 身份验证失败。

要排除 RADIUS 身份验证故障,请执行以下操作:

  1. 在 Marvis 对话助手窗口中,输入 tshoot 客户端名称。在以下示例中,您将看到 Marvis 检测到网络中的 802.1x 身份验证失败。
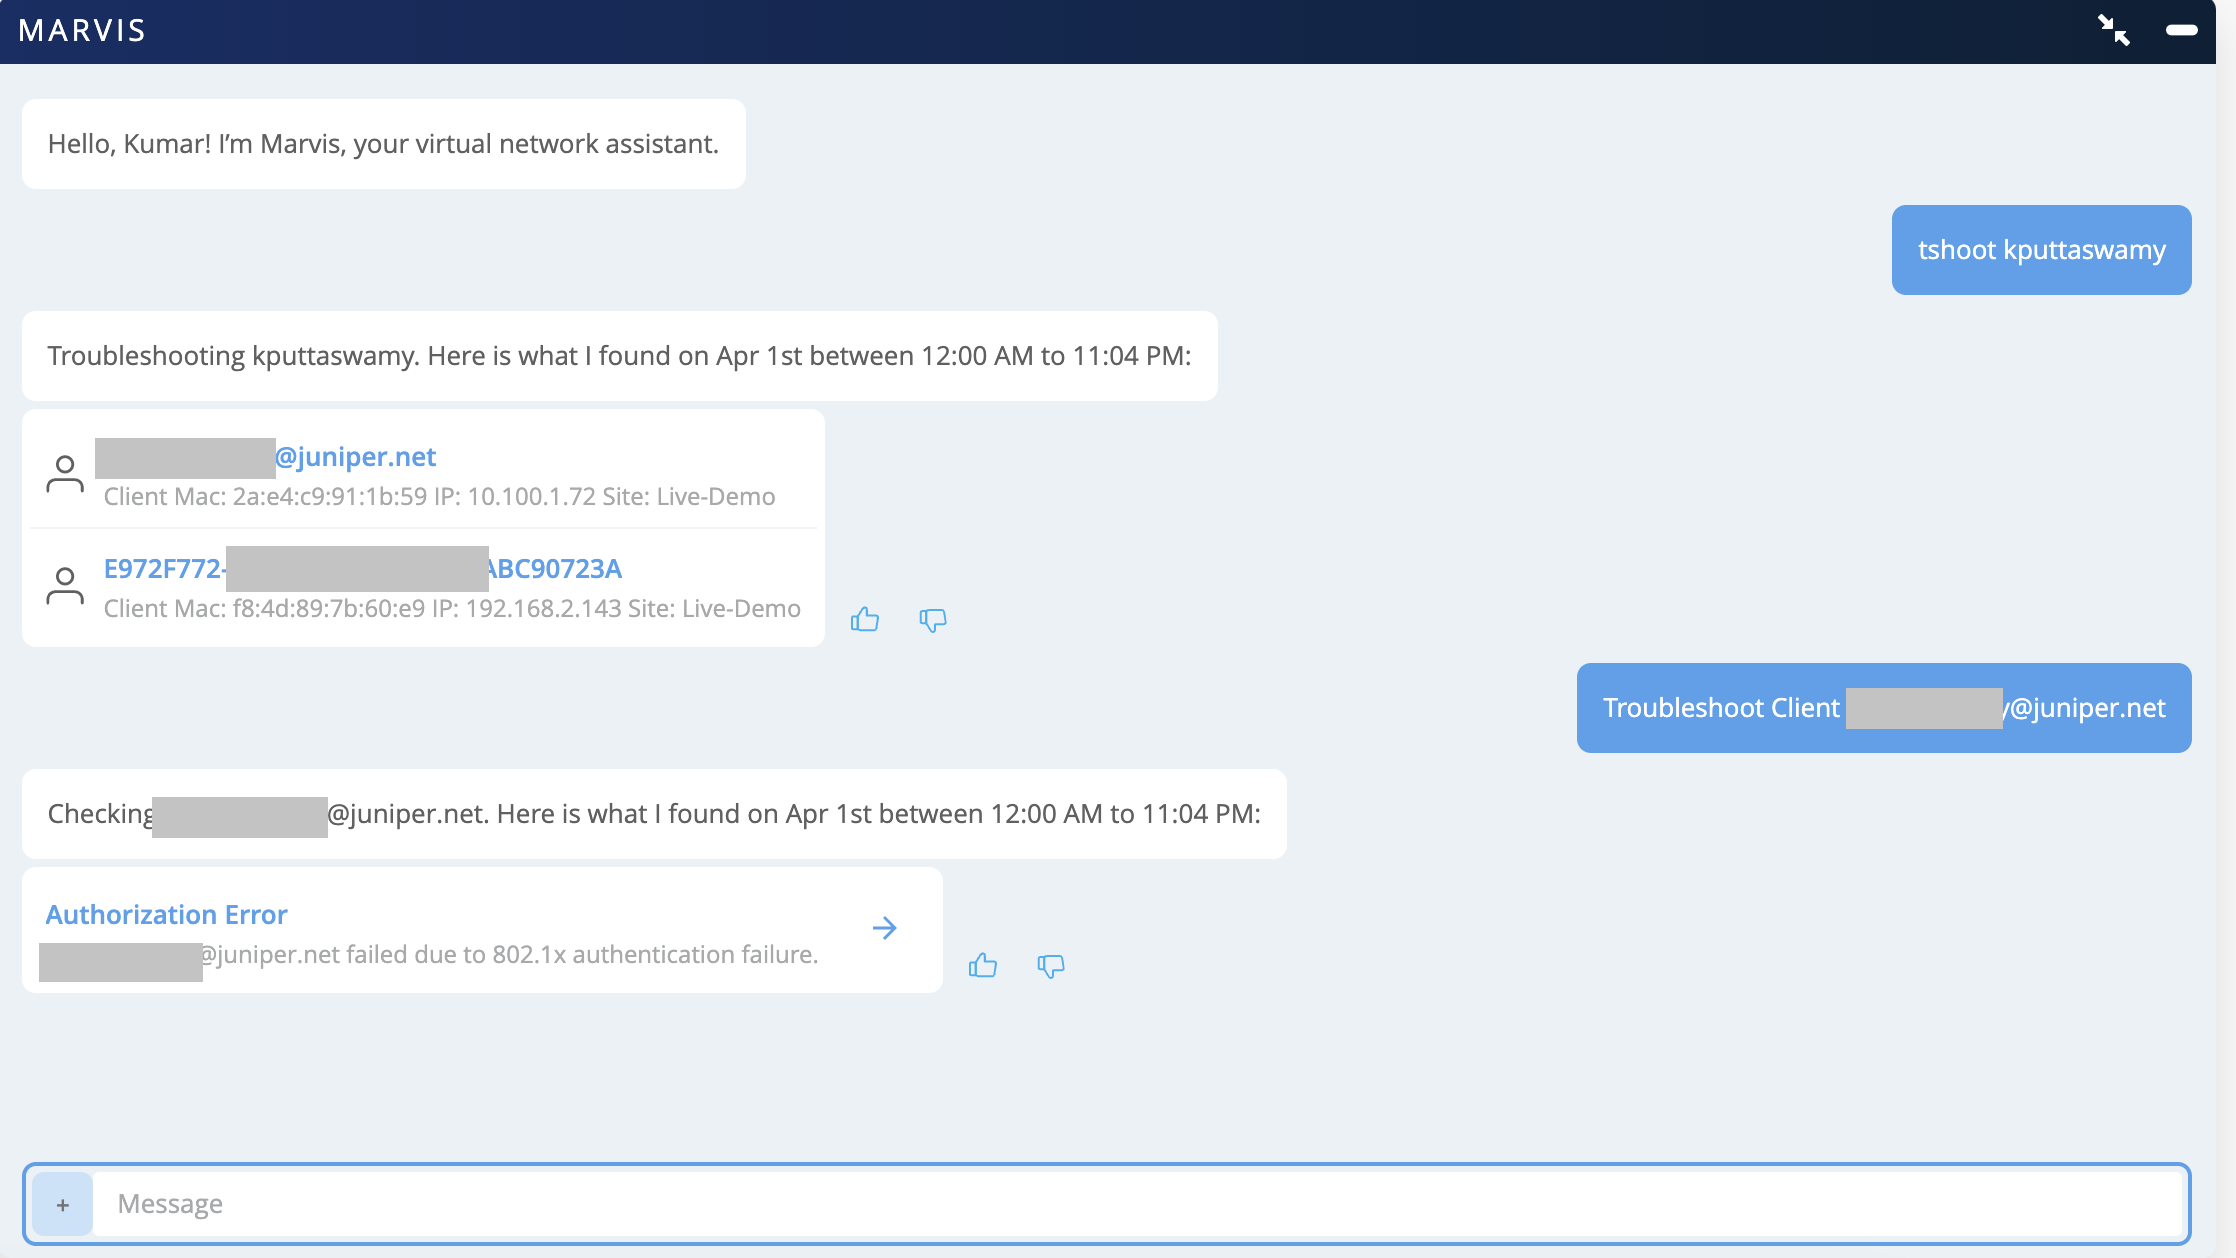
    Screenshot of a chat with Marvis troubleshooting a client device. Includes user input, client details like MAC and IP addresses, site info Live-Demo, and an error message for 802.1x authentication failure. Features user feedback options and a text input field.

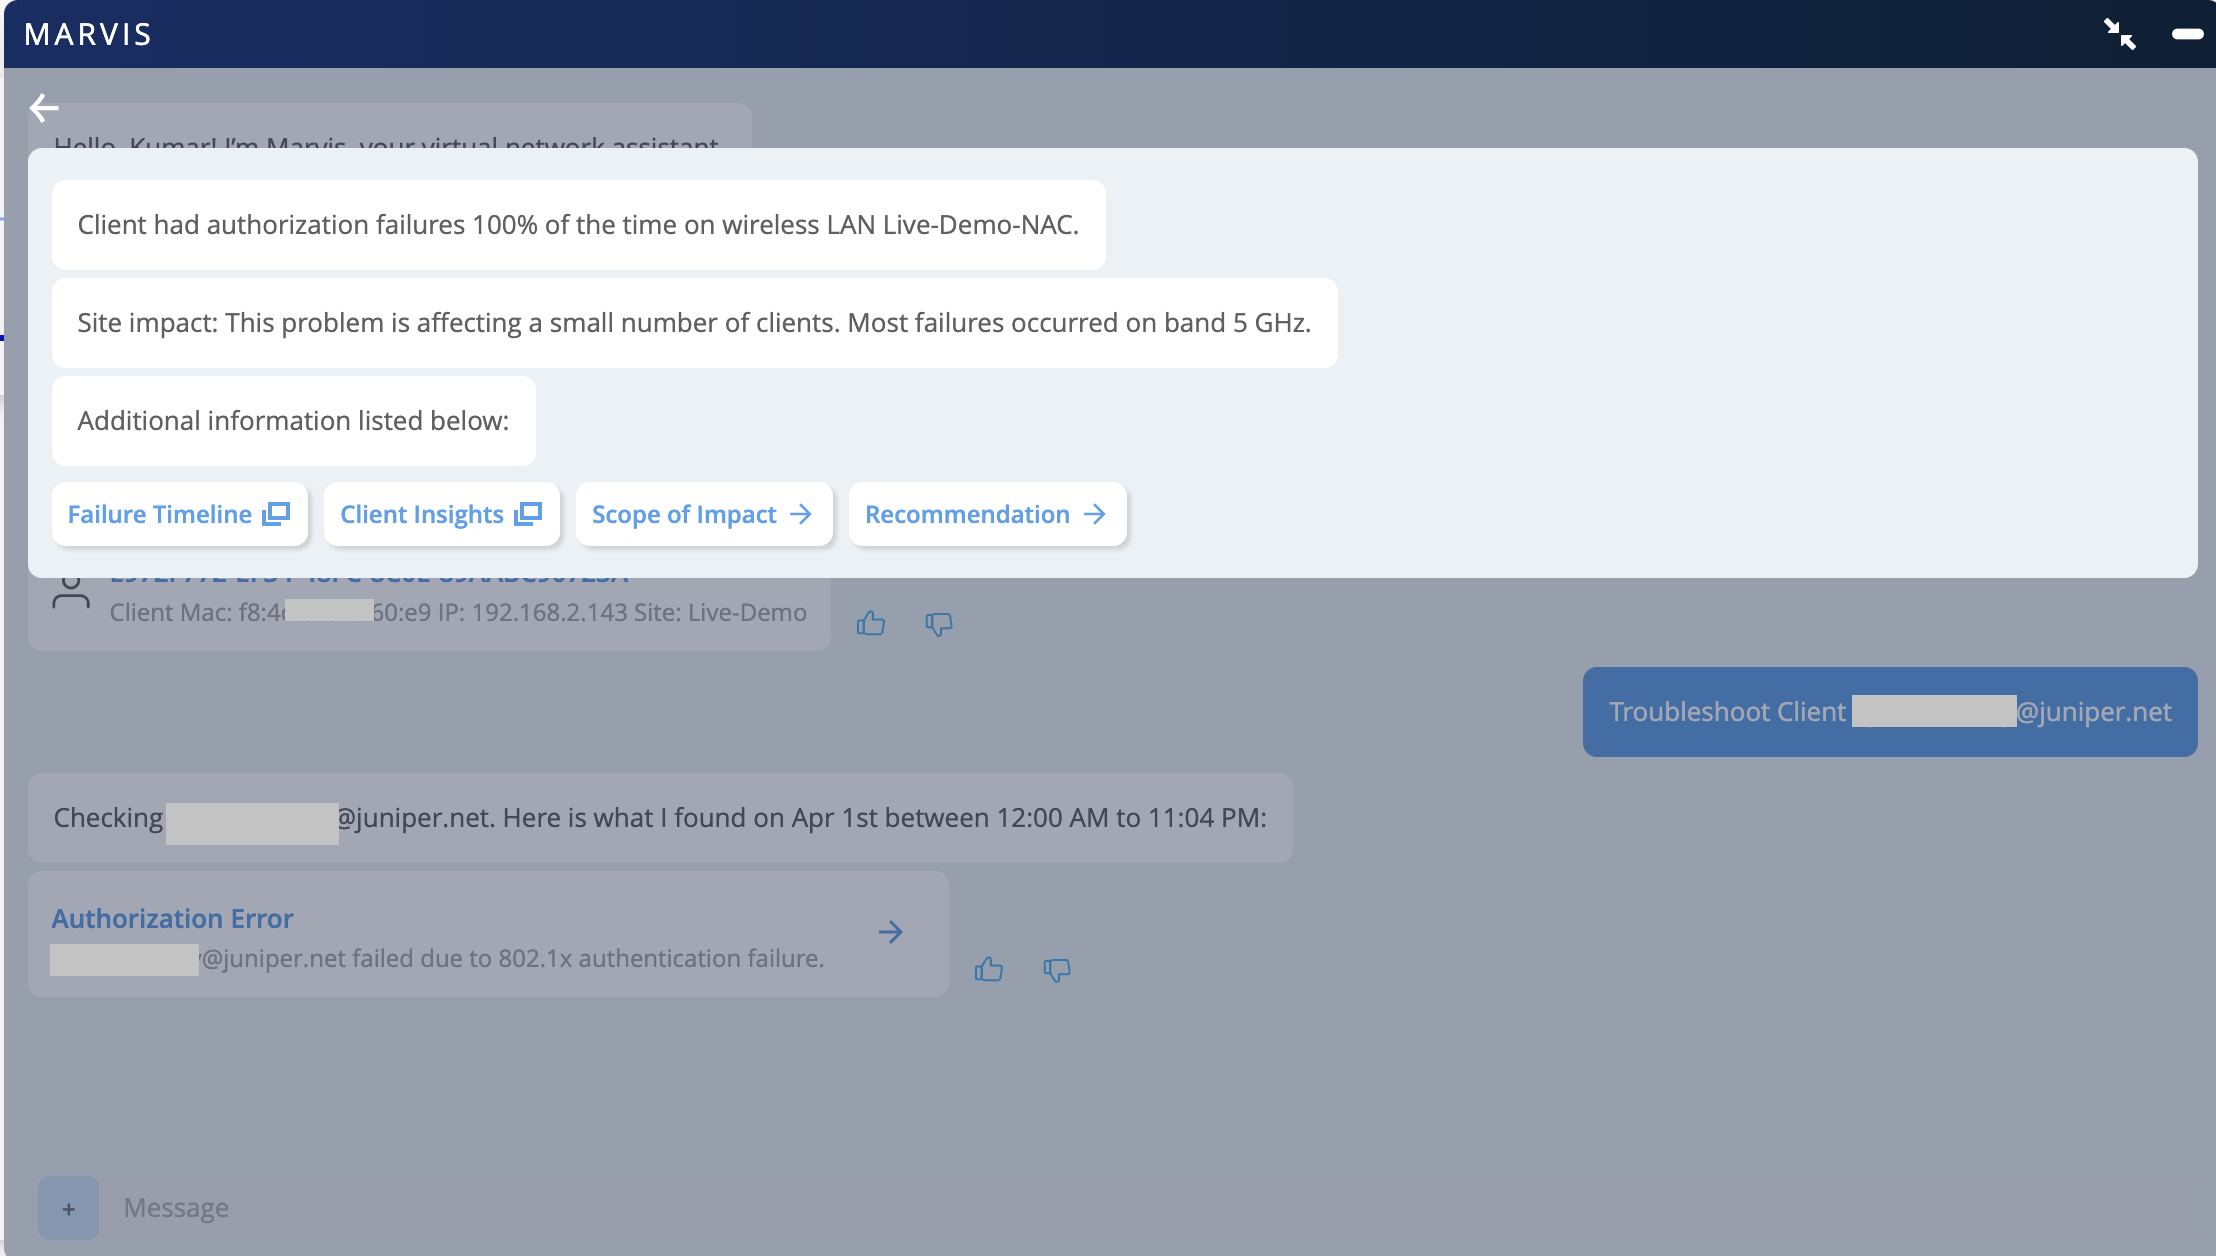
  2. 单击 “身份验证错误” 以查看详细信息。

    Network troubleshooting interface showing 100 percent authorization failures for a client on the wireless LAN Live-Demo-NAC with links to failure timeline, client insights, scope of impact, recommendation, and troubleshoot client button.

可以使用显示的选项进行进一步调查。

影响范围

可以先查看“影响范围”,其中列出了成功和失败的连接尝试。您可以检查客户端是否在一个或多个 WLAN 上出现故障。
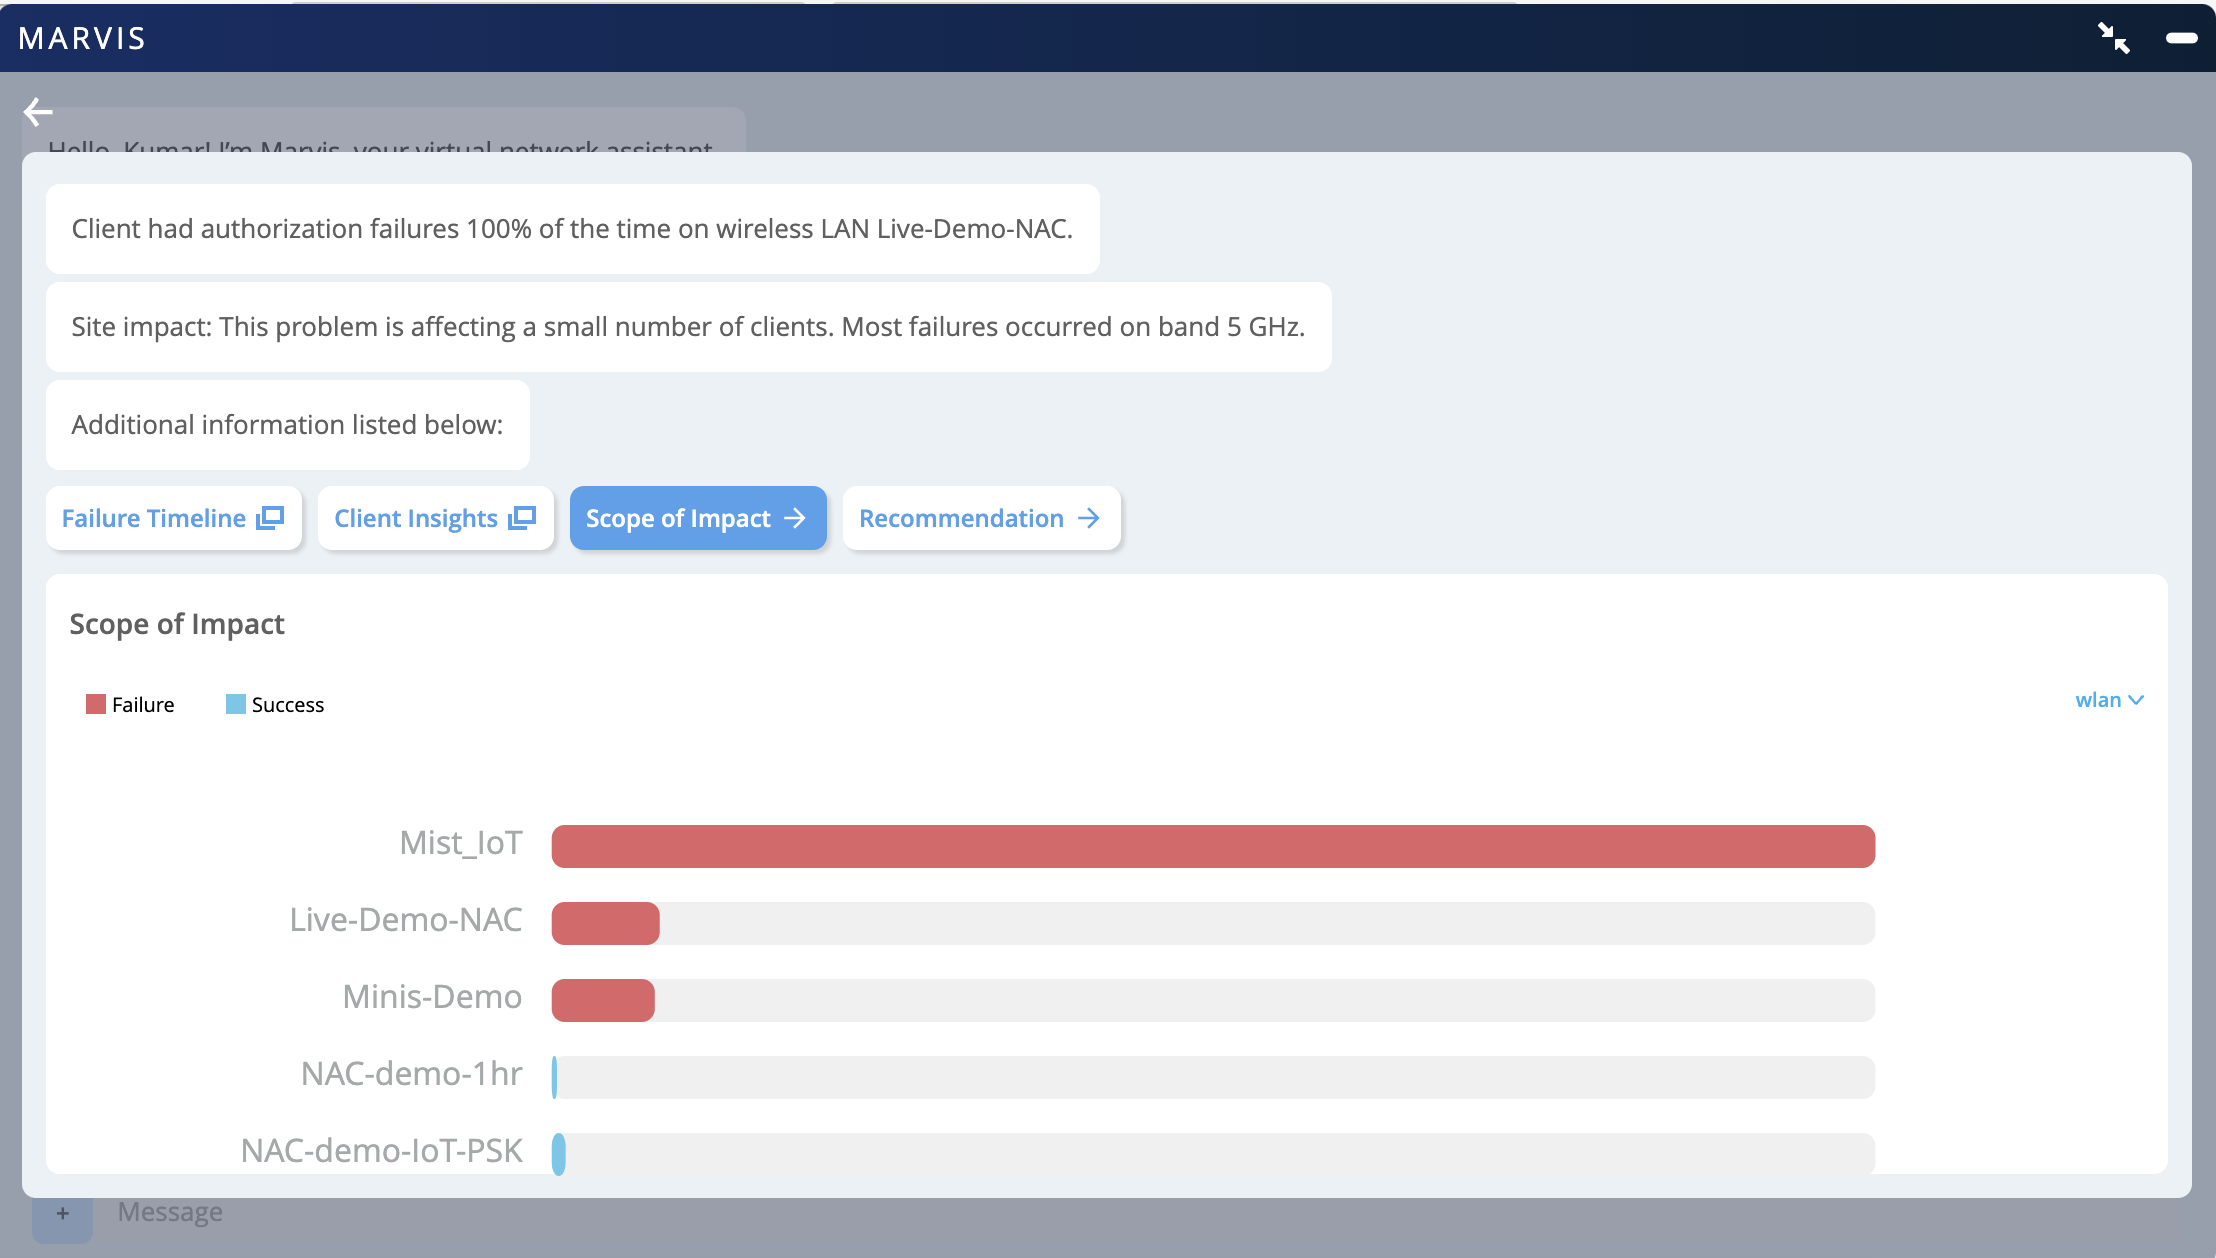
Network troubleshooting interface showing 100 percent authorization failures on wireless LAN Live-Demo-NAC, primarily on 5 GHz band. Scope of Impact tab displays a bar chart comparing success and failure rates across networks, with Mist_IoT and Live-Demo-NAC having highest failure rates.

客户端洞察

您可以单击 客户端洞察 以查看与客户端关联的所有事件。您可以单击授权失败事件查看失败原因,如以下示例所示。
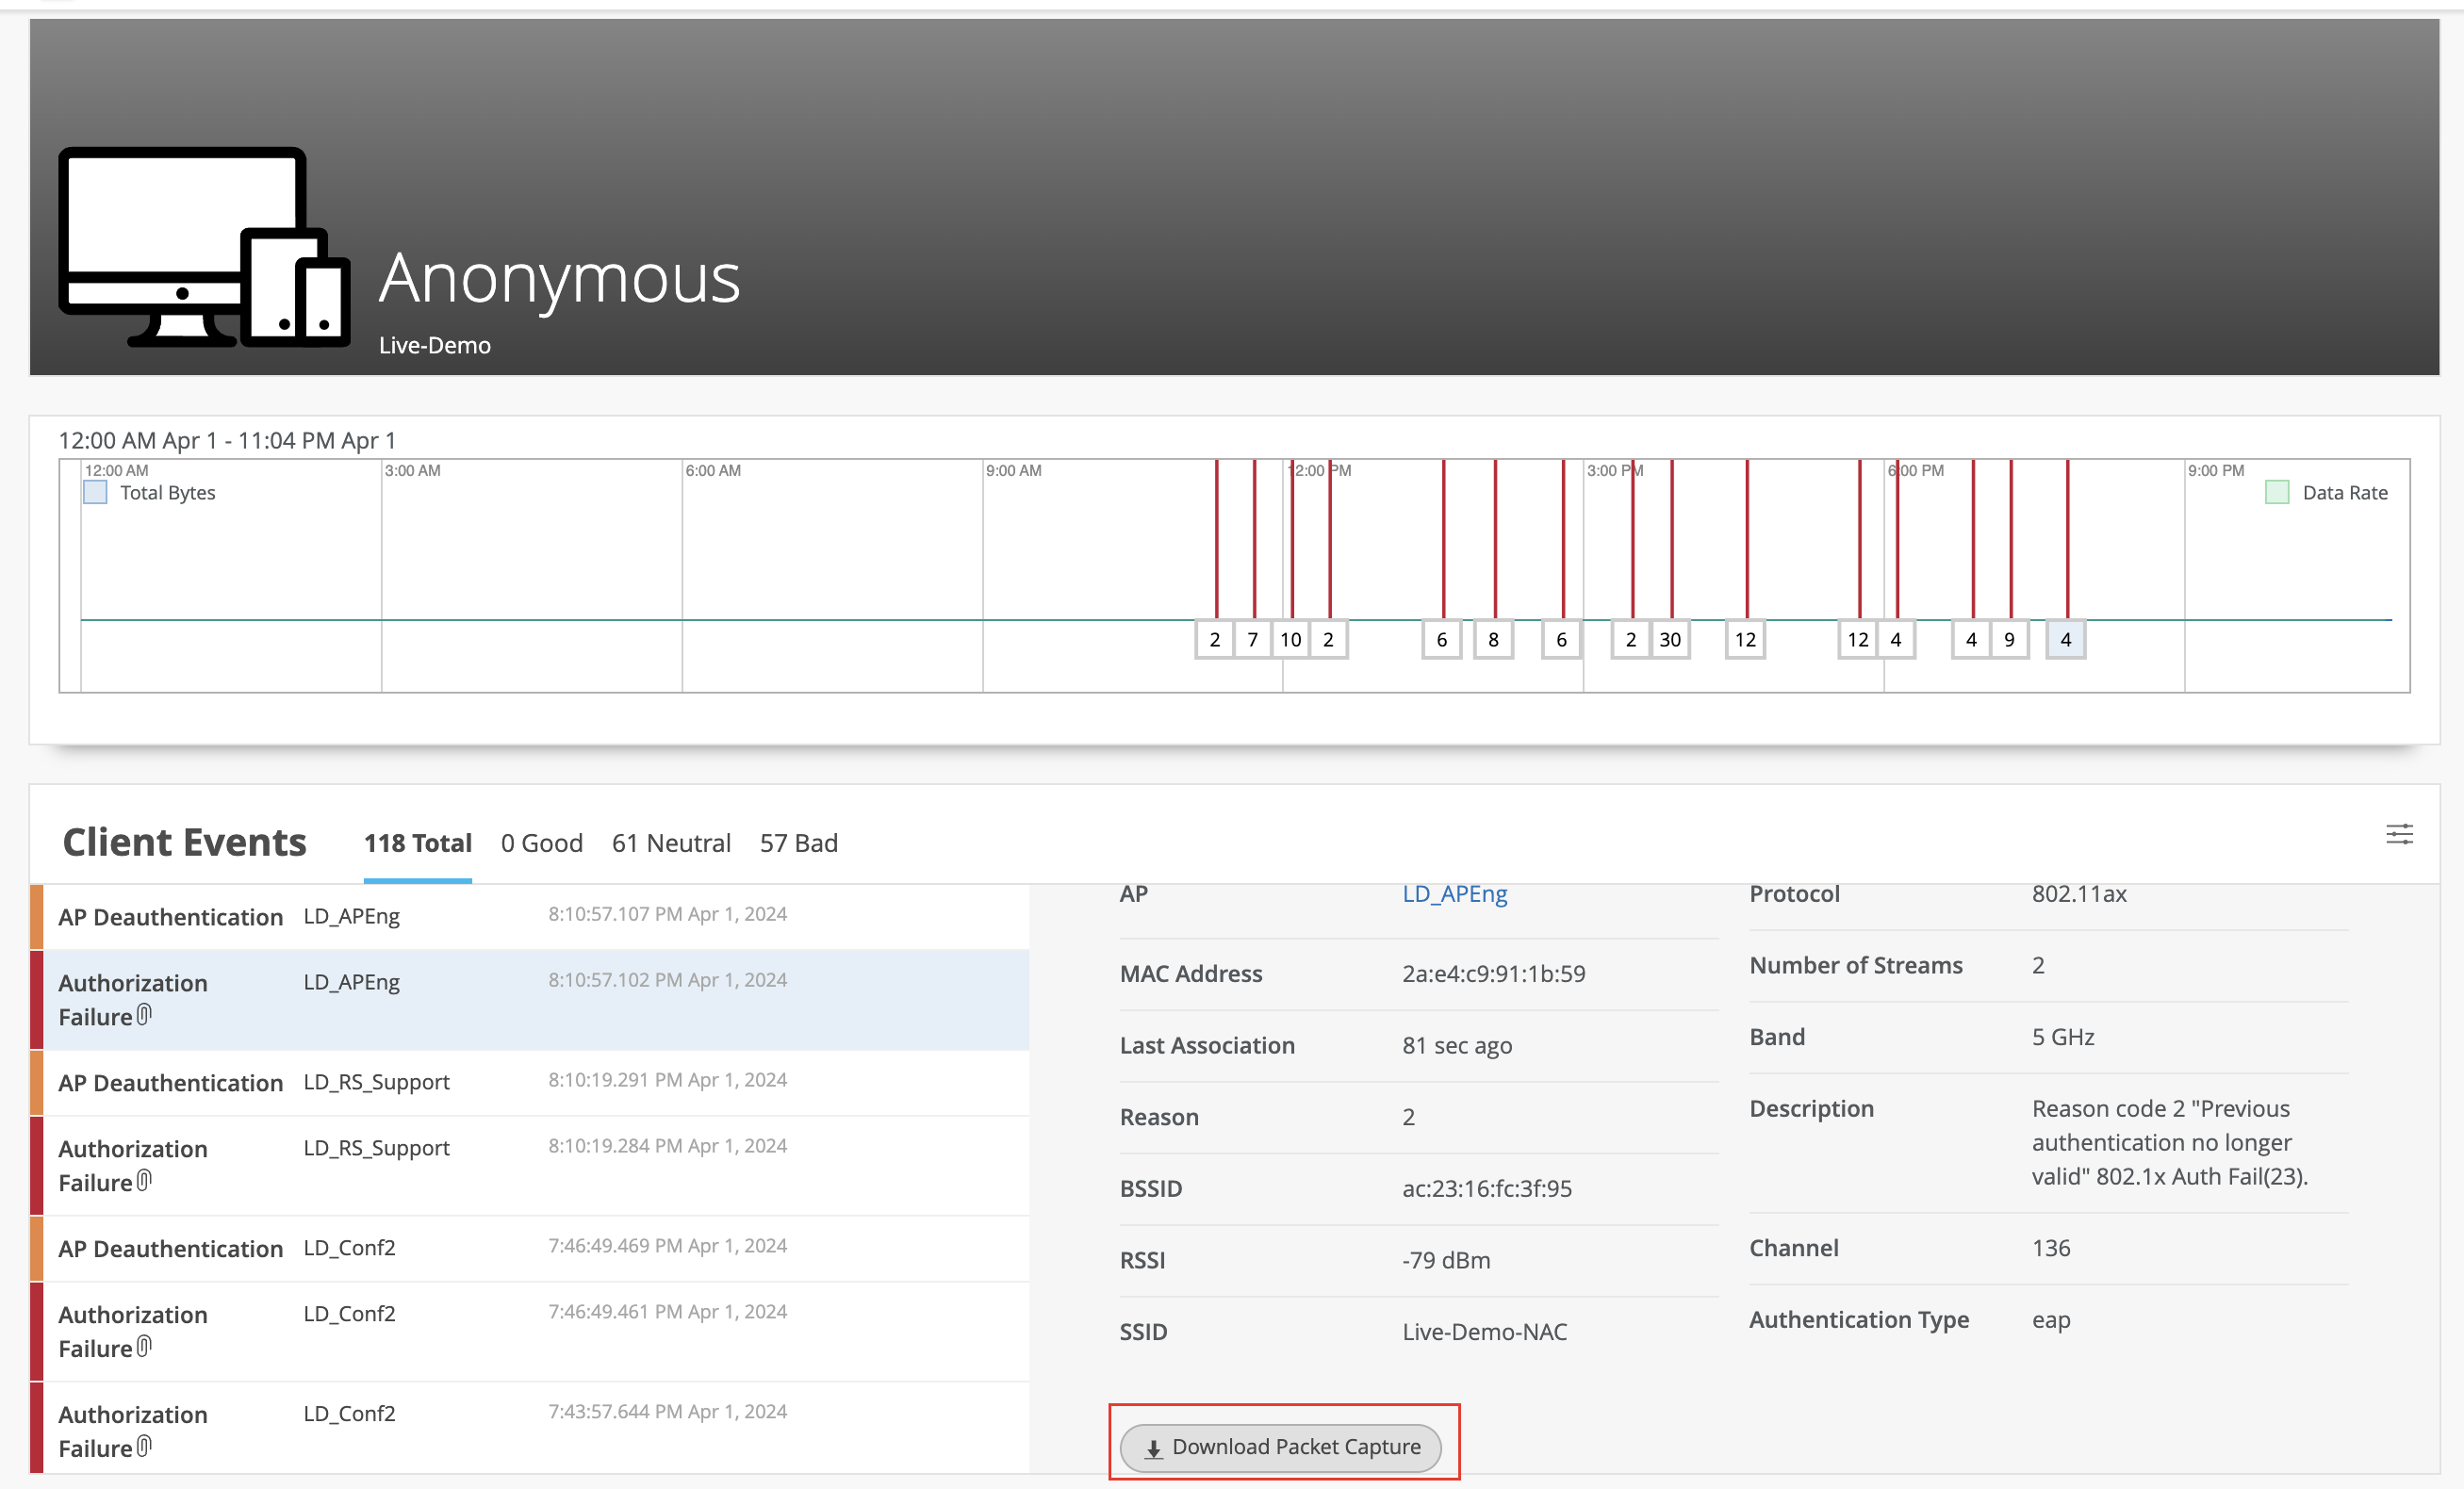
Network monitoring dashboard with header showing Anonymous and Live-Demo, timeline graph of network activity with red event markers, list of client events like AP Deauthentication and Authorization Failure, detailed event info including AP name, MAC address, protocol, RSSI, SSID, issue description, and Download Packet Capture button for troubleshooting.

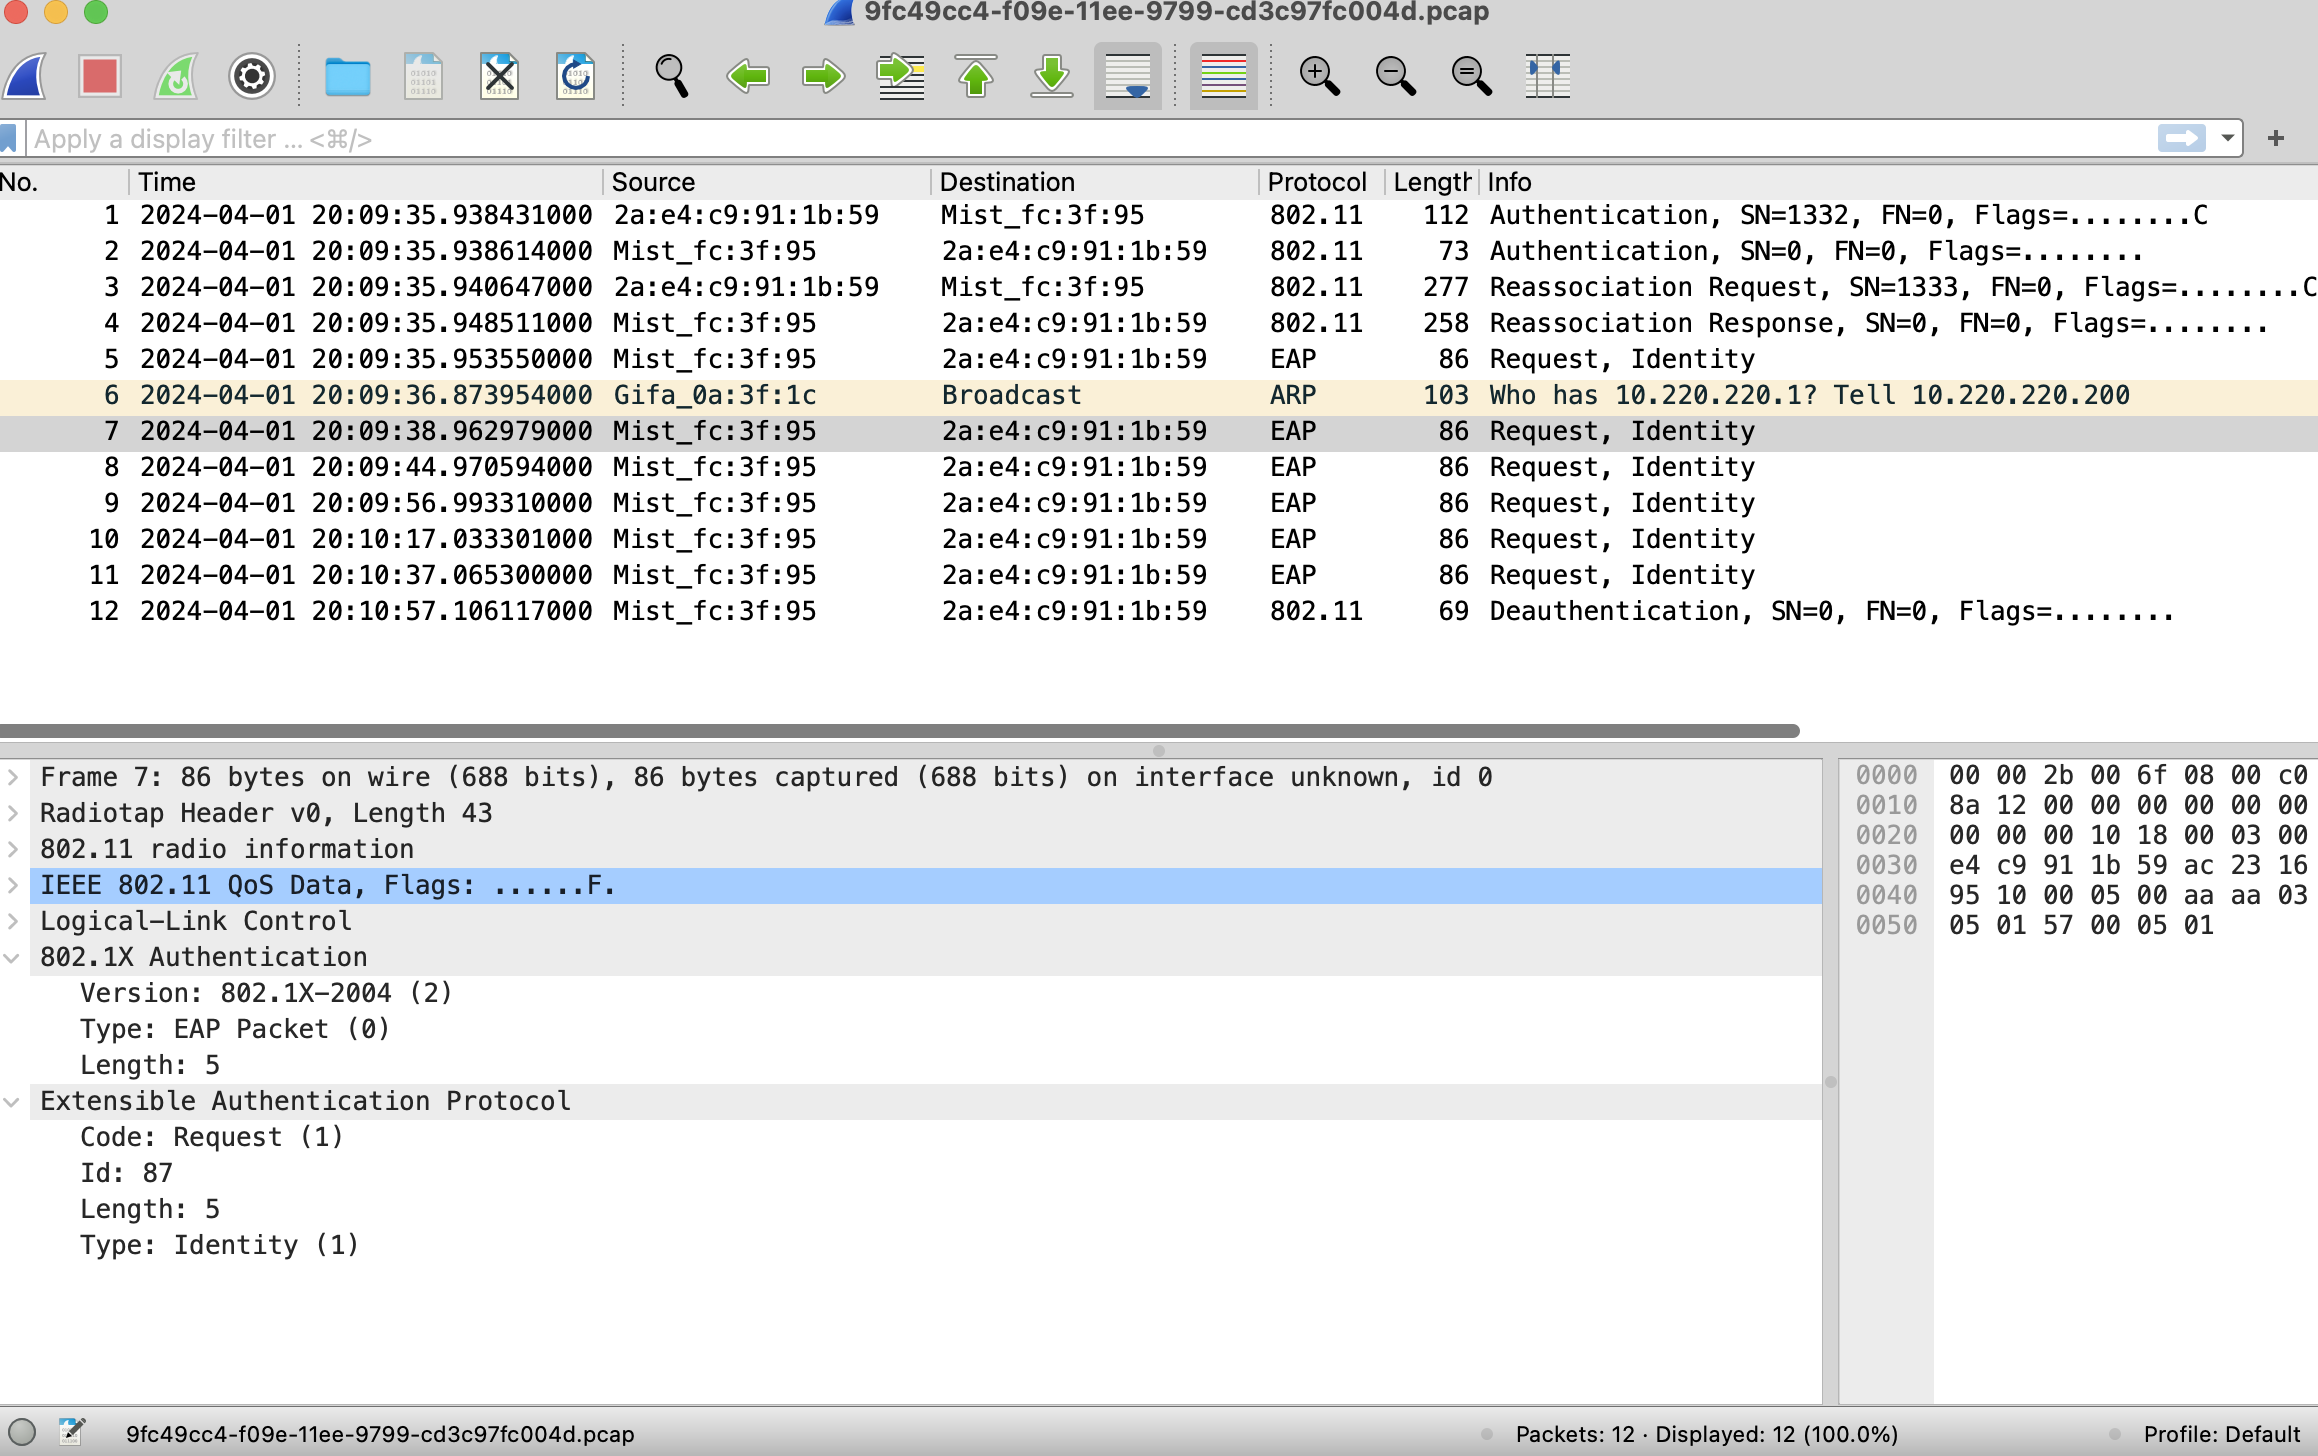
您可以下载特定事件的动态数据包捕获。下面是一个数据包捕获示例:

Screenshot of Wireshark showing captured network packets with columns for time, source, destination, protocol, length, and info. Highlighted packet is an EAP request with detailed protocol layers and hexadecimal data in the lower pane. Used for network troubleshooting and analysis.