使用 Marvis 查询语言进行故障排除
使用这些示例了解如何使用 Marvis 查询来监控网络并排除网络故障。
查看活动和设备详细信息
要排除故障并了解网络行为,您可能需要查看事件详细信息或设备详细信息。您可以使用 LIST 查询查看以下详细信息:
-
接入点 (AP)
-
客户端(包括有线客户端)
-
交换机
-
接入点事件
-
客户端事件
-
交换机事件
-
Mist Edge
-
Mist Edge 活动
表 1 和 表 2 提供了一些 LIST 查询,您可以将其用作参考,以根据您的要求构建查询。
| 如果您想查看 | 利用 |
|---|---|
| 特定时间间隔内接入点的客户端事件 | LIST ClientEvents WITH AccessPoint <AP name> DURING <time duration> |
| 一个接入点的所有事件 | LIST ApEvents WITH AccessPoint <AP name> |
| 接入点特定类型的事件 | LIST ApEvents WITH ApEventType <event-type> AND AccessPoint <ap-name> |
| 交换机的所有事件 | LIST SwitchEvents WITH Switch <switch name> |
| 交换机特定类型的事件 | LIST SwitchEvents WITH SwitchEventType <event-type> AND Switch <switch-name> |
| 特定站点上发生的所有 Mist Edge 活动 | LIST MistEdgeEvents WITH Site <site-name> |
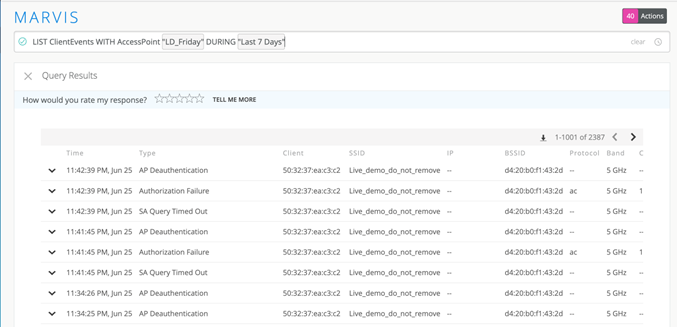
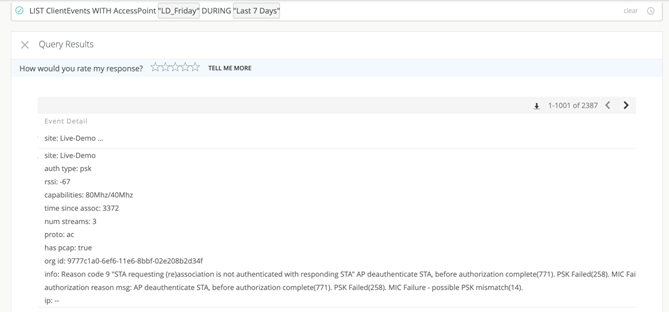
以下示例显示与特定接入点关联的所有客户端的事件。要查看有关事件的更多详细信息,可以单击表格第一列中的箭头。
此示例显示了特定事件类型的列表:
| 如果您想查看 | 利用 |
|---|---|
| 站点中特定型号的交换机 | LIST Switches WITH Model <model number> AND Site <site name> |
| 客户端连接到接入点 | LIST Clients WITH AccessPoint <AP name> |
| 站点中特定型号的接入点 | LIST APs WITH Model <model number> AND Site <site name> |
| 站点中的所有有线客户端 | LIST WiredClients WITH Site <site name> |
|
站点中的 Mist Edge |
LIST MistEdges WITH Site <site name> |
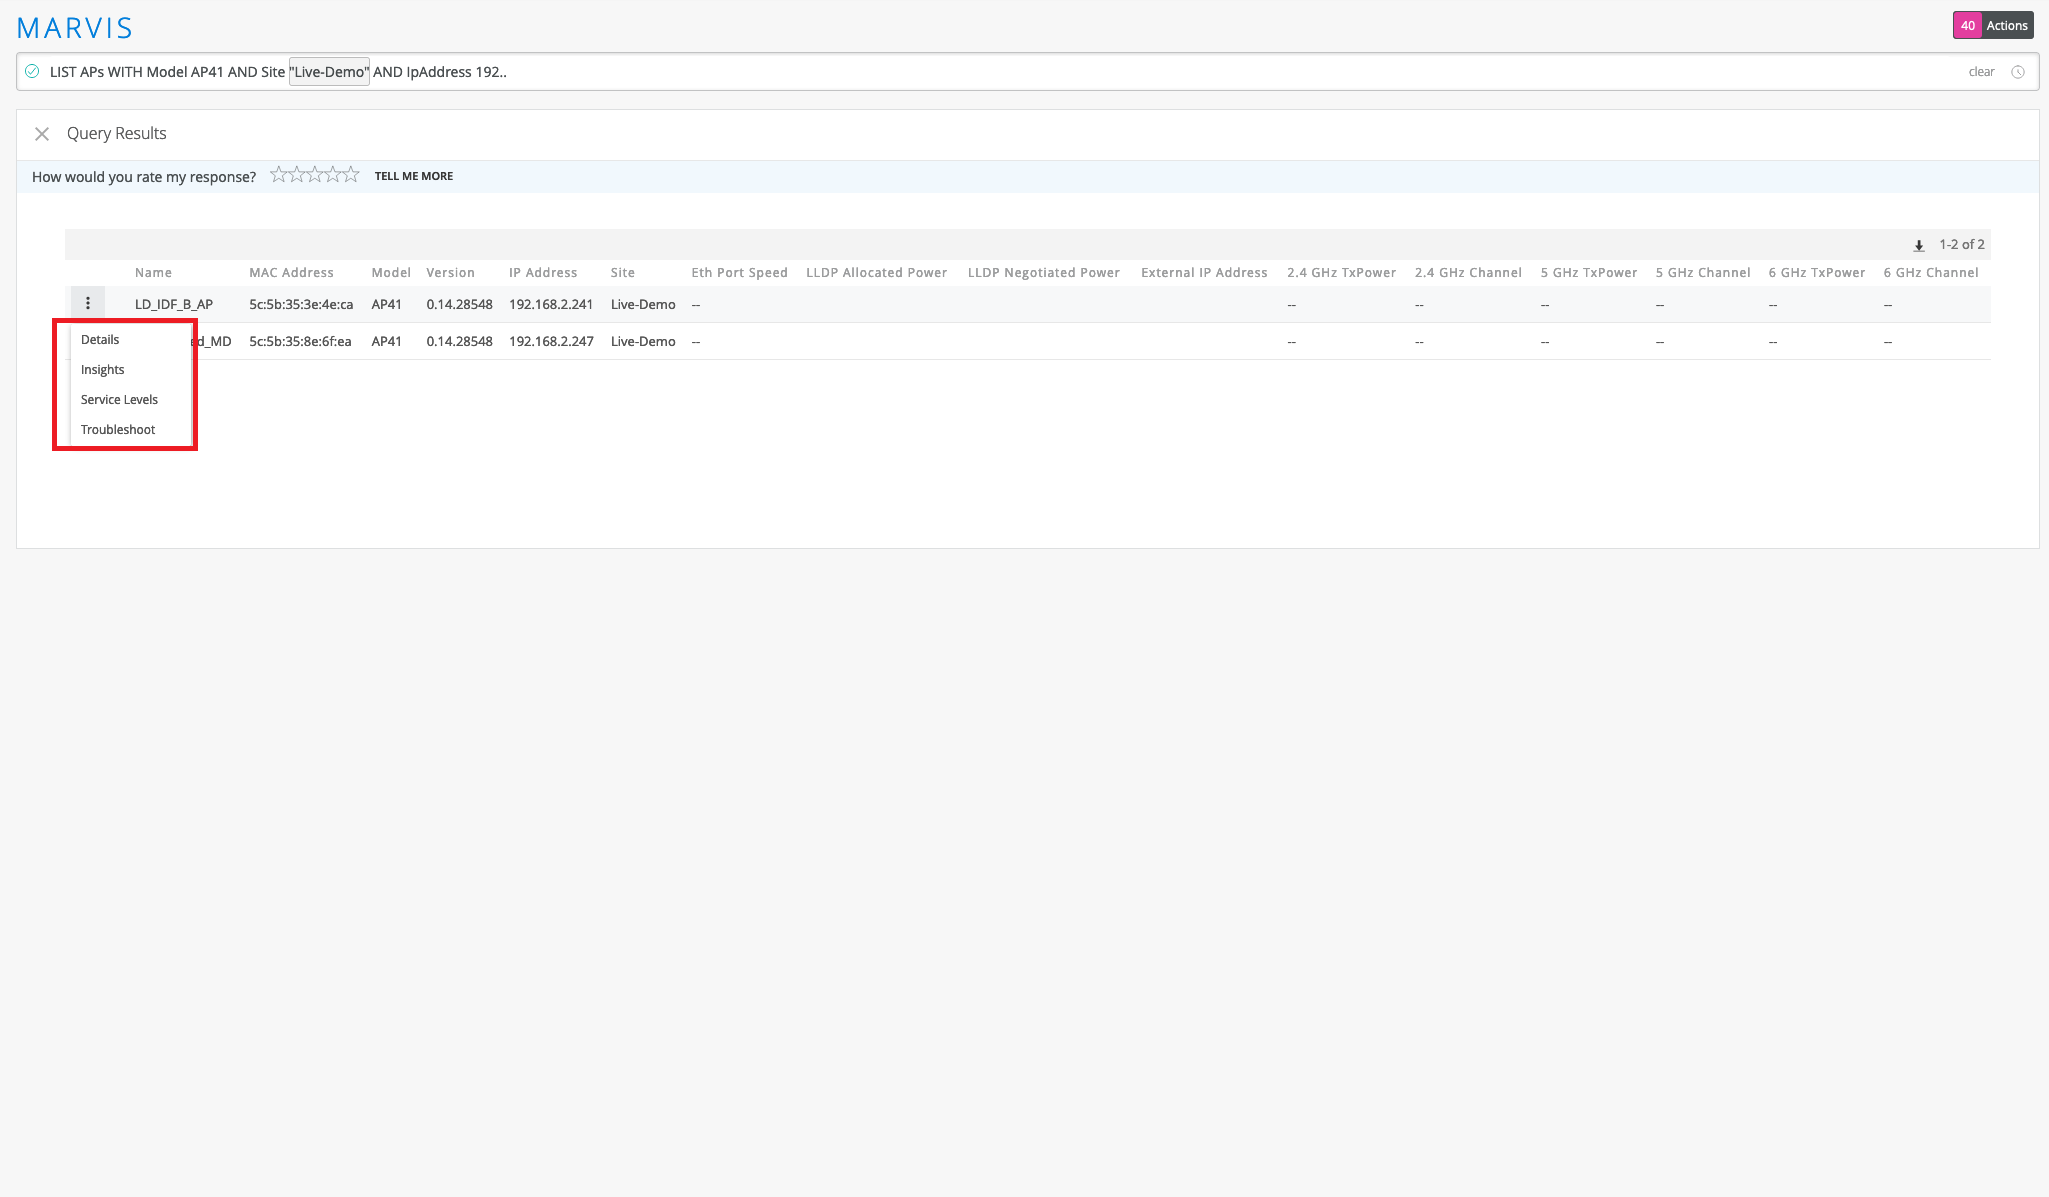
以下示例显示了 LIST 查询的输出。请注意,您可以输入部分 IP 地址来搜索特定子网中的设备。要执行其他操作,您可以单击表格左上角的“更多选项”图标。
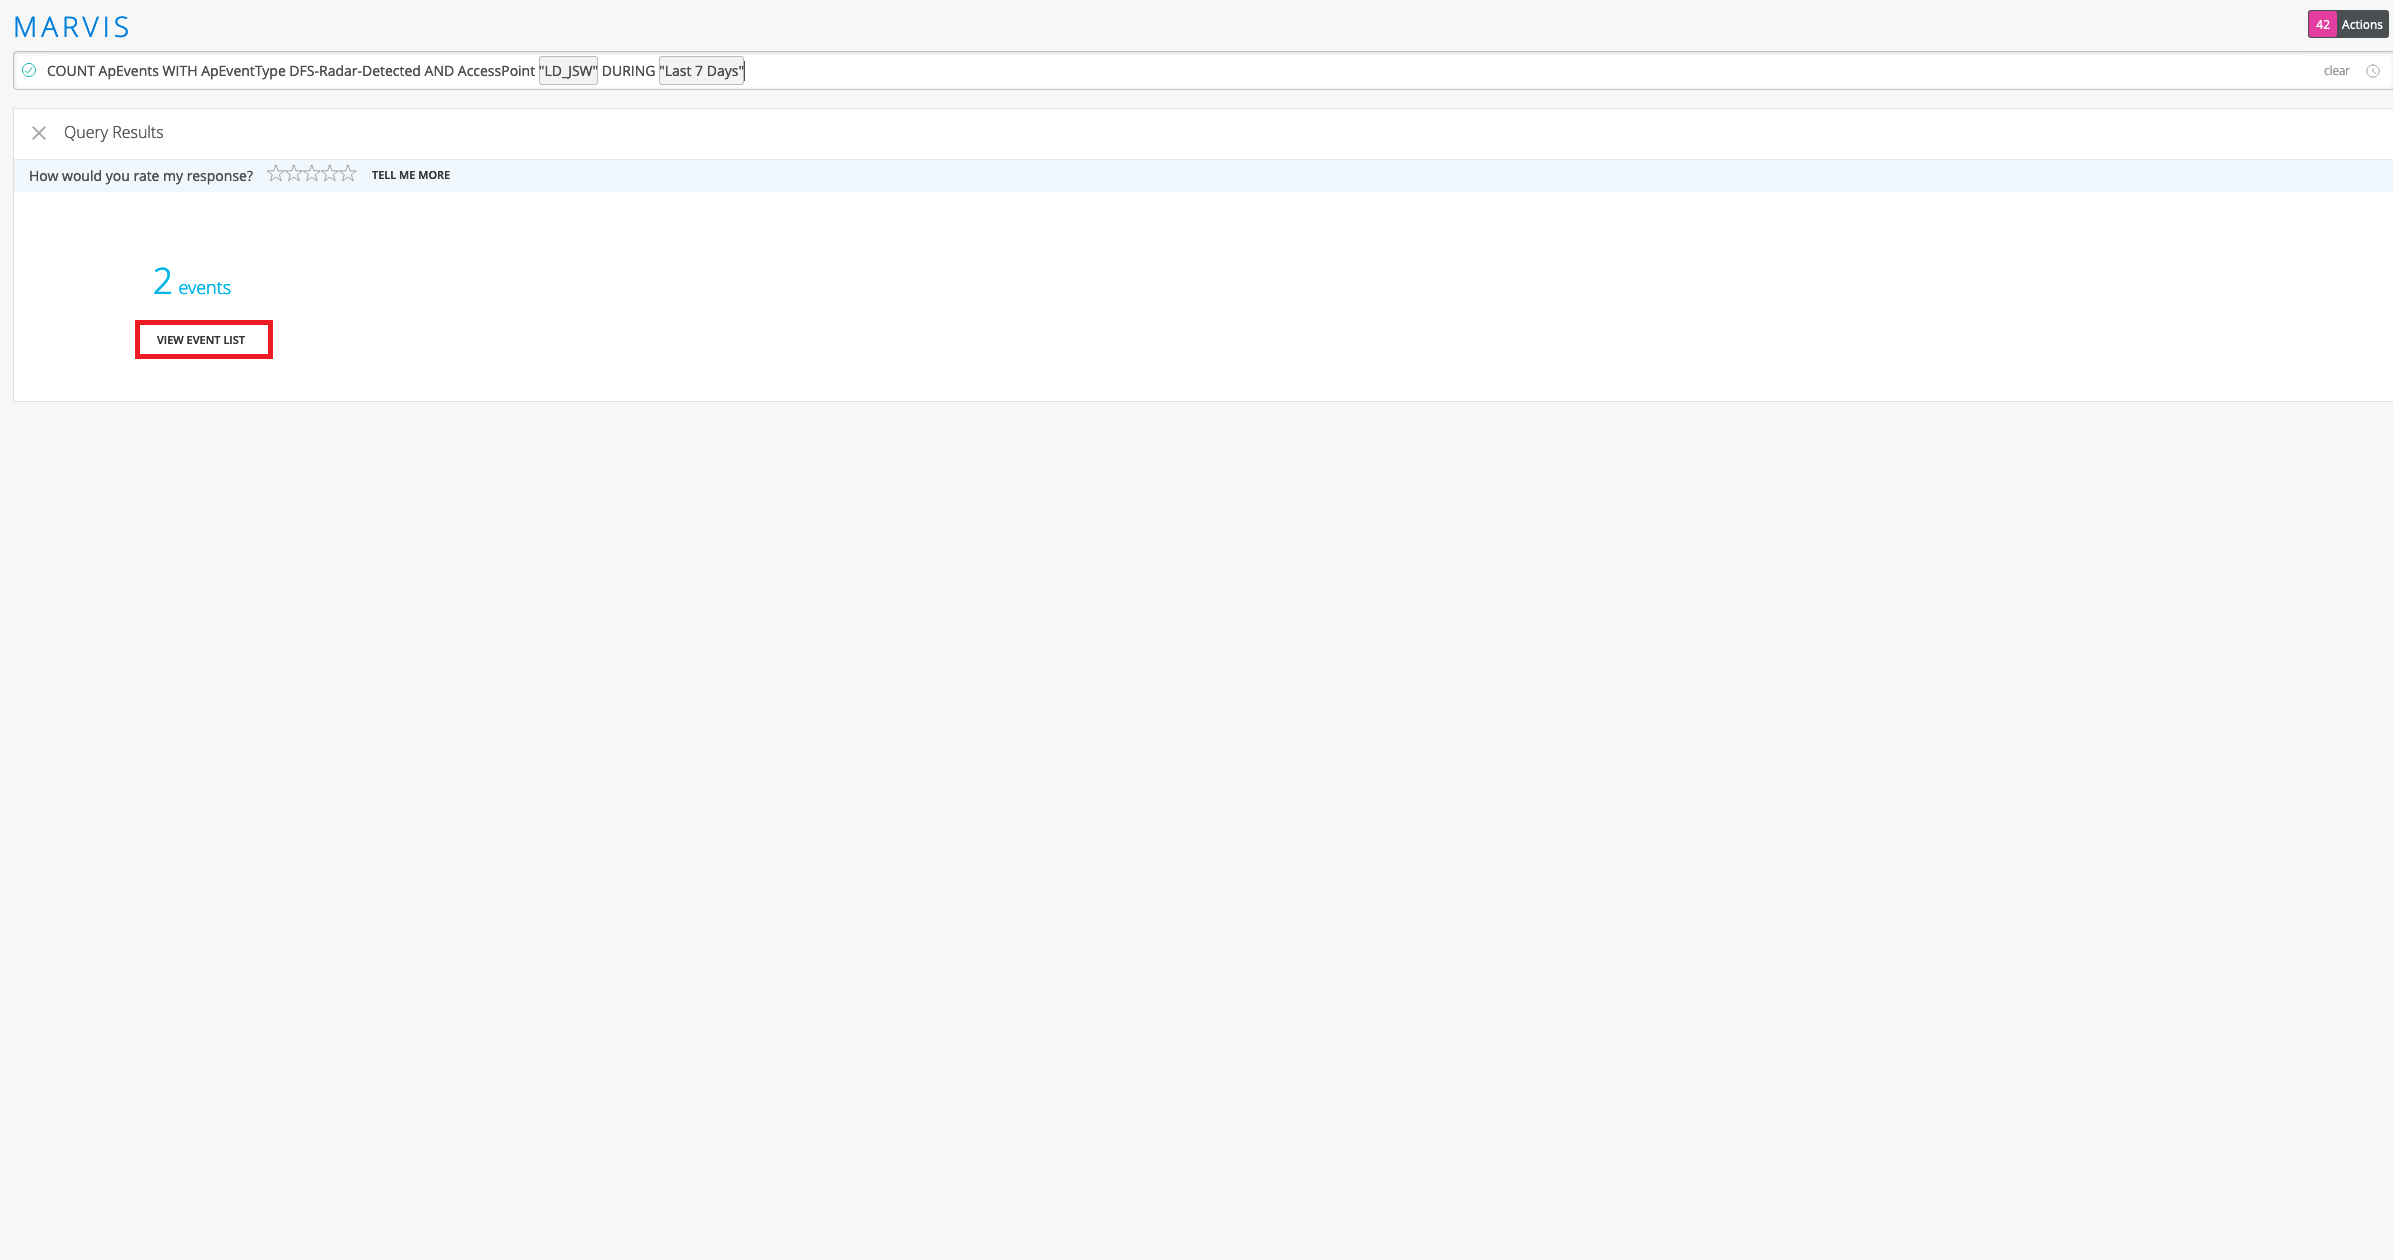
除了 LIST 查询之外,您还可以使用 COUNT 查询来获取与查询匹配的事件或设备的计数。COUNT 查询使用与 LIST 查询相同的结构。下面是显示 COUNT 查询的示例输出的屏幕截图。您可以单击 查看事件列表 以查看事件详细信息。
查看客户端的漫游详细信息
您可以使用 ROAMINGOF 查询查看在不同接入点之间漫游的客户端的图形视图。
ROAMINGOF <client name> DURING <time interval>
查看客户端的状态
STATUSOF 查询概述了在站点或无线 LAN (WLAN) 中面临连接问题的客户端。查询输出显示客户端的排名列表,从遇到问题最多的客户端开始。通过此查询,您可以快速识别站点中面临连接问题的客户端。可以在故障排除会话开始时使用此查询来识别受影响的客户端。然后,可以向下钻取到客户端详细信息以查找问题的根本原因。您可以单击客户端查看其服务级别或洞察,或者在 Marvis 上启动故障排除查询。
STATUSOF Clients WITH Site <site name>
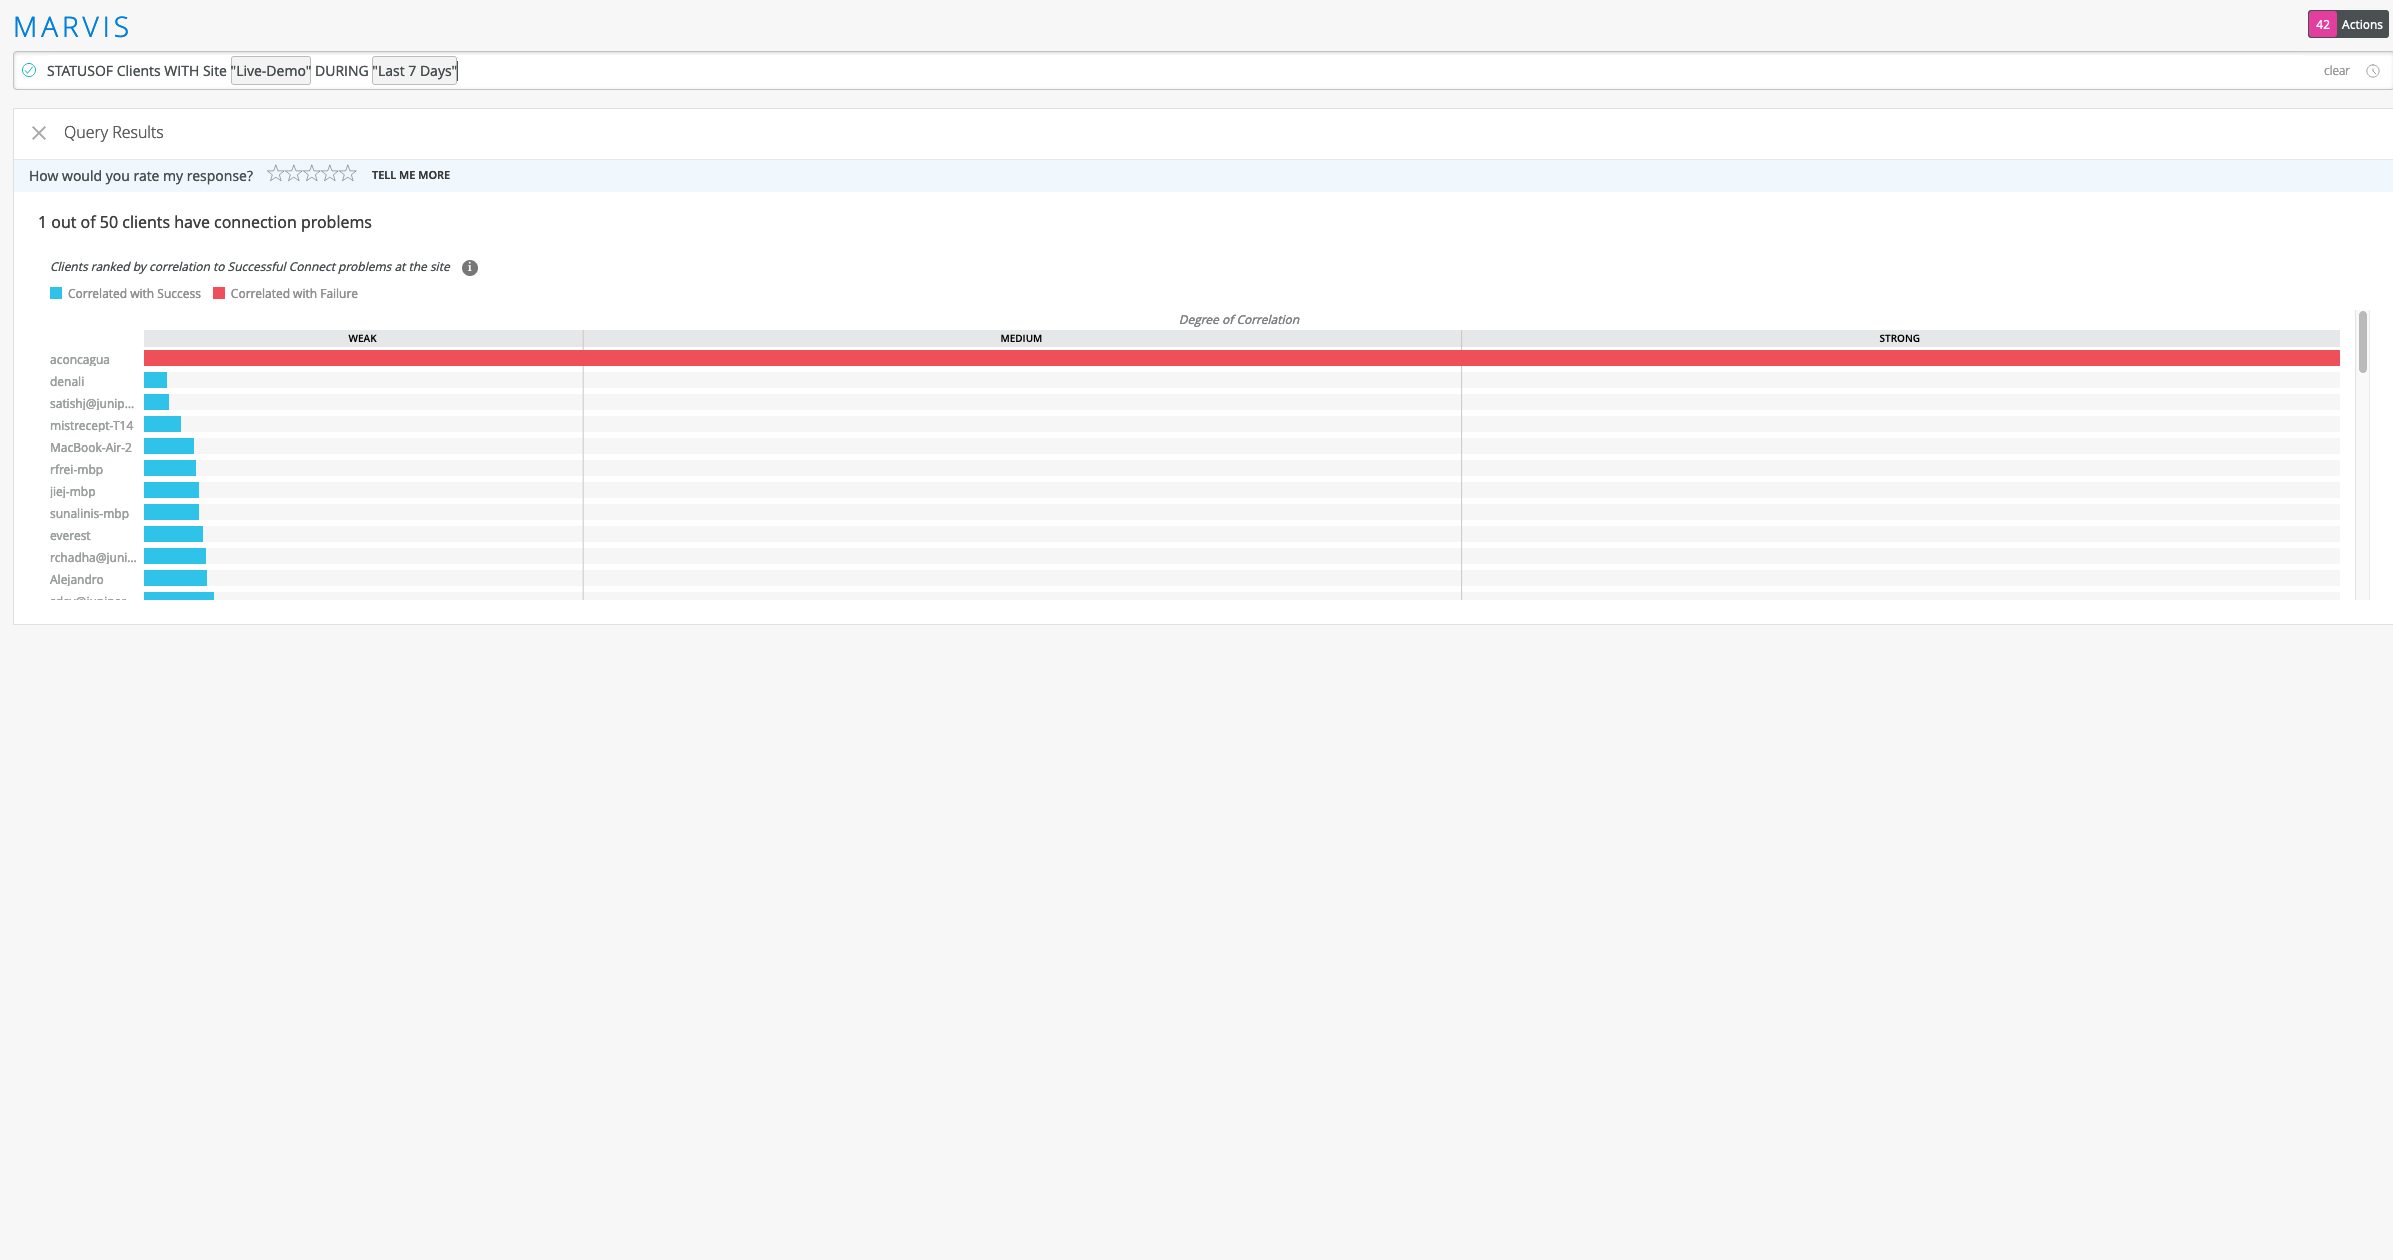
您还可以查看面临特定问题的客户端,例如覆盖范围问题、吞吐量问题、连接问题等。例如,查询 STATUSOF Clients WITH Problem Capacity 会列出组织中遇到容量问题的所有客户端。
对接入点、站点或客户端进行故障排除
表 3 列出了可用于对站点、客户端或接入点进行故障排除的几个 TROUBLEHOOT 查询。
| 如果您想进行故障排除 | 利用 |
|---|---|
| 客户端、接入点或站点 | TROUBLESHOOT <client/site/AP name> |
| 无线客户端、接入点或面临连接问题的站点 | TROUBLESHOOT <client/site/AP name> WITH Problem SlowToConnect
TROUBLESHOOT <client/site/AP name> WITH Problem UnableToConnect |
| 无线客户端、接入点或站点在特定时长内面临连接问题 | TROUBLESHOOT <client/site/AP name> WITH Problem UnableToConnect DURING <time duration> |
以下屏幕截图显示了查询的 TROUBLESHOOT <site name> WITH Problem UnableToConnect 输出。您会看到 Marvis 提供问题原因、频段和发生问题的 WLAN 等数据。

您可以通过单击每个类别向下钻取到更多详细信息。如果您单击 “服务级别” 类别,Marvis 会提供有关该问题的更多详细信息,如以下屏幕截图所示:
定位接入点、站点或客户端
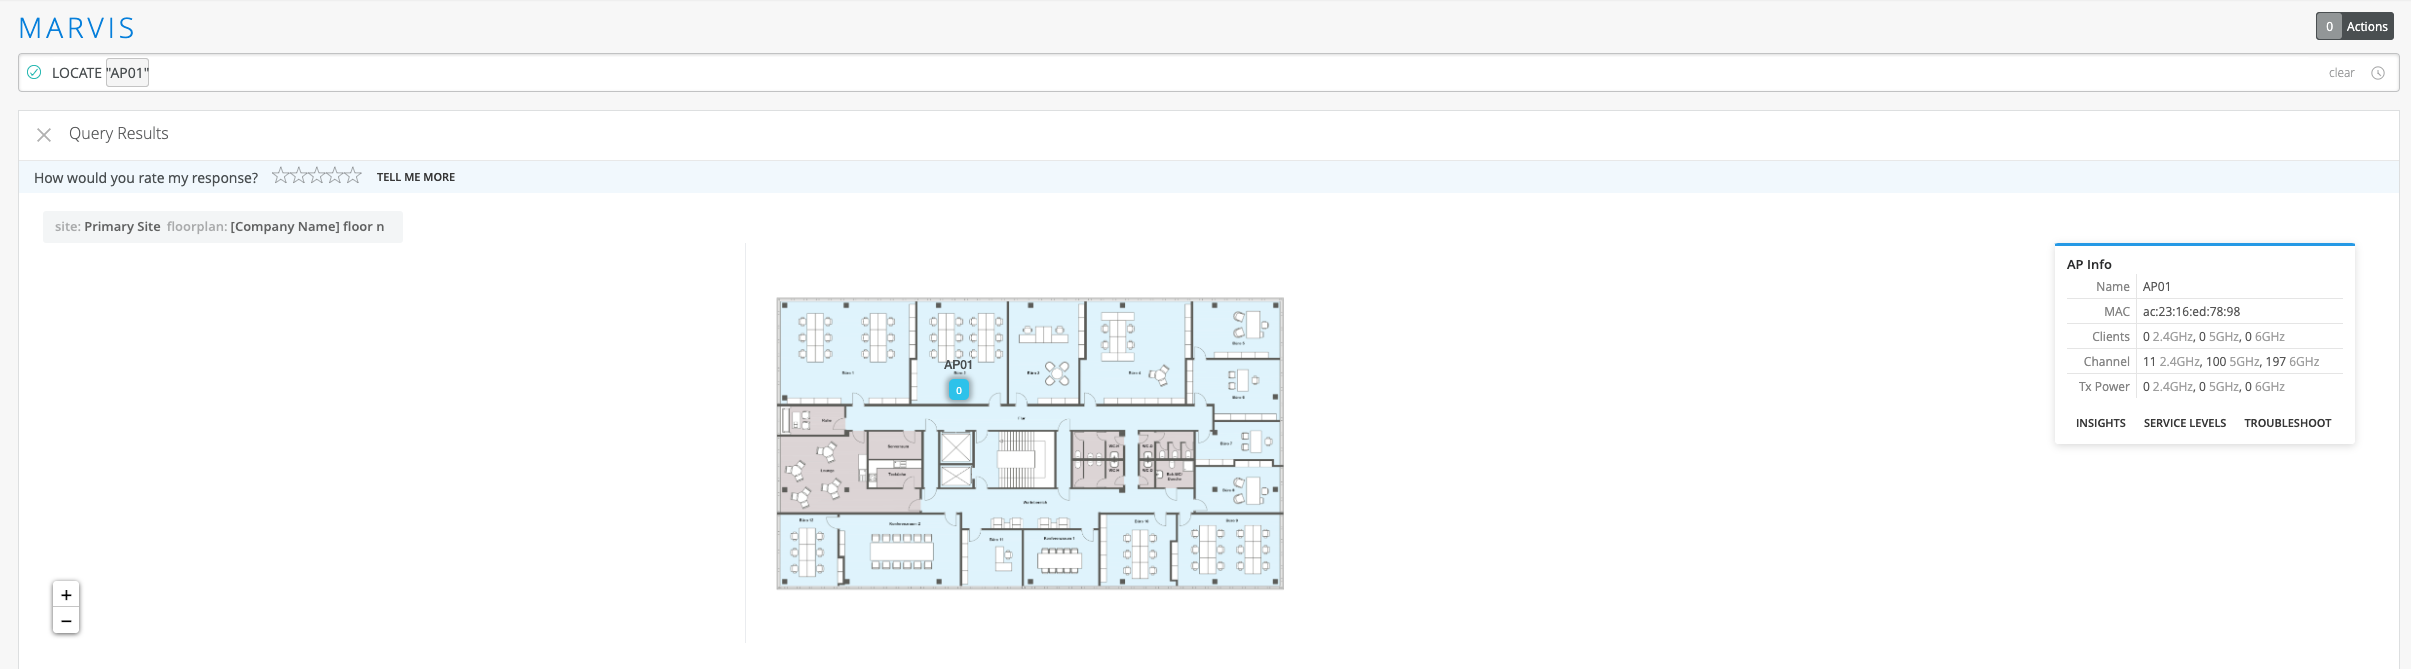
您可以使用 LOCATE 查询查找站点、接入点或客户端。查询输出显示您在 组织>站点配置中配置的站点位置的地图视图。对于接入点和客户端,Marvis 会在您的平面图上显示这些设备的位置。Marvis 还显示附加信息,并提供指向“洞察”、“服务级别”和“故障排除”页面的链接。
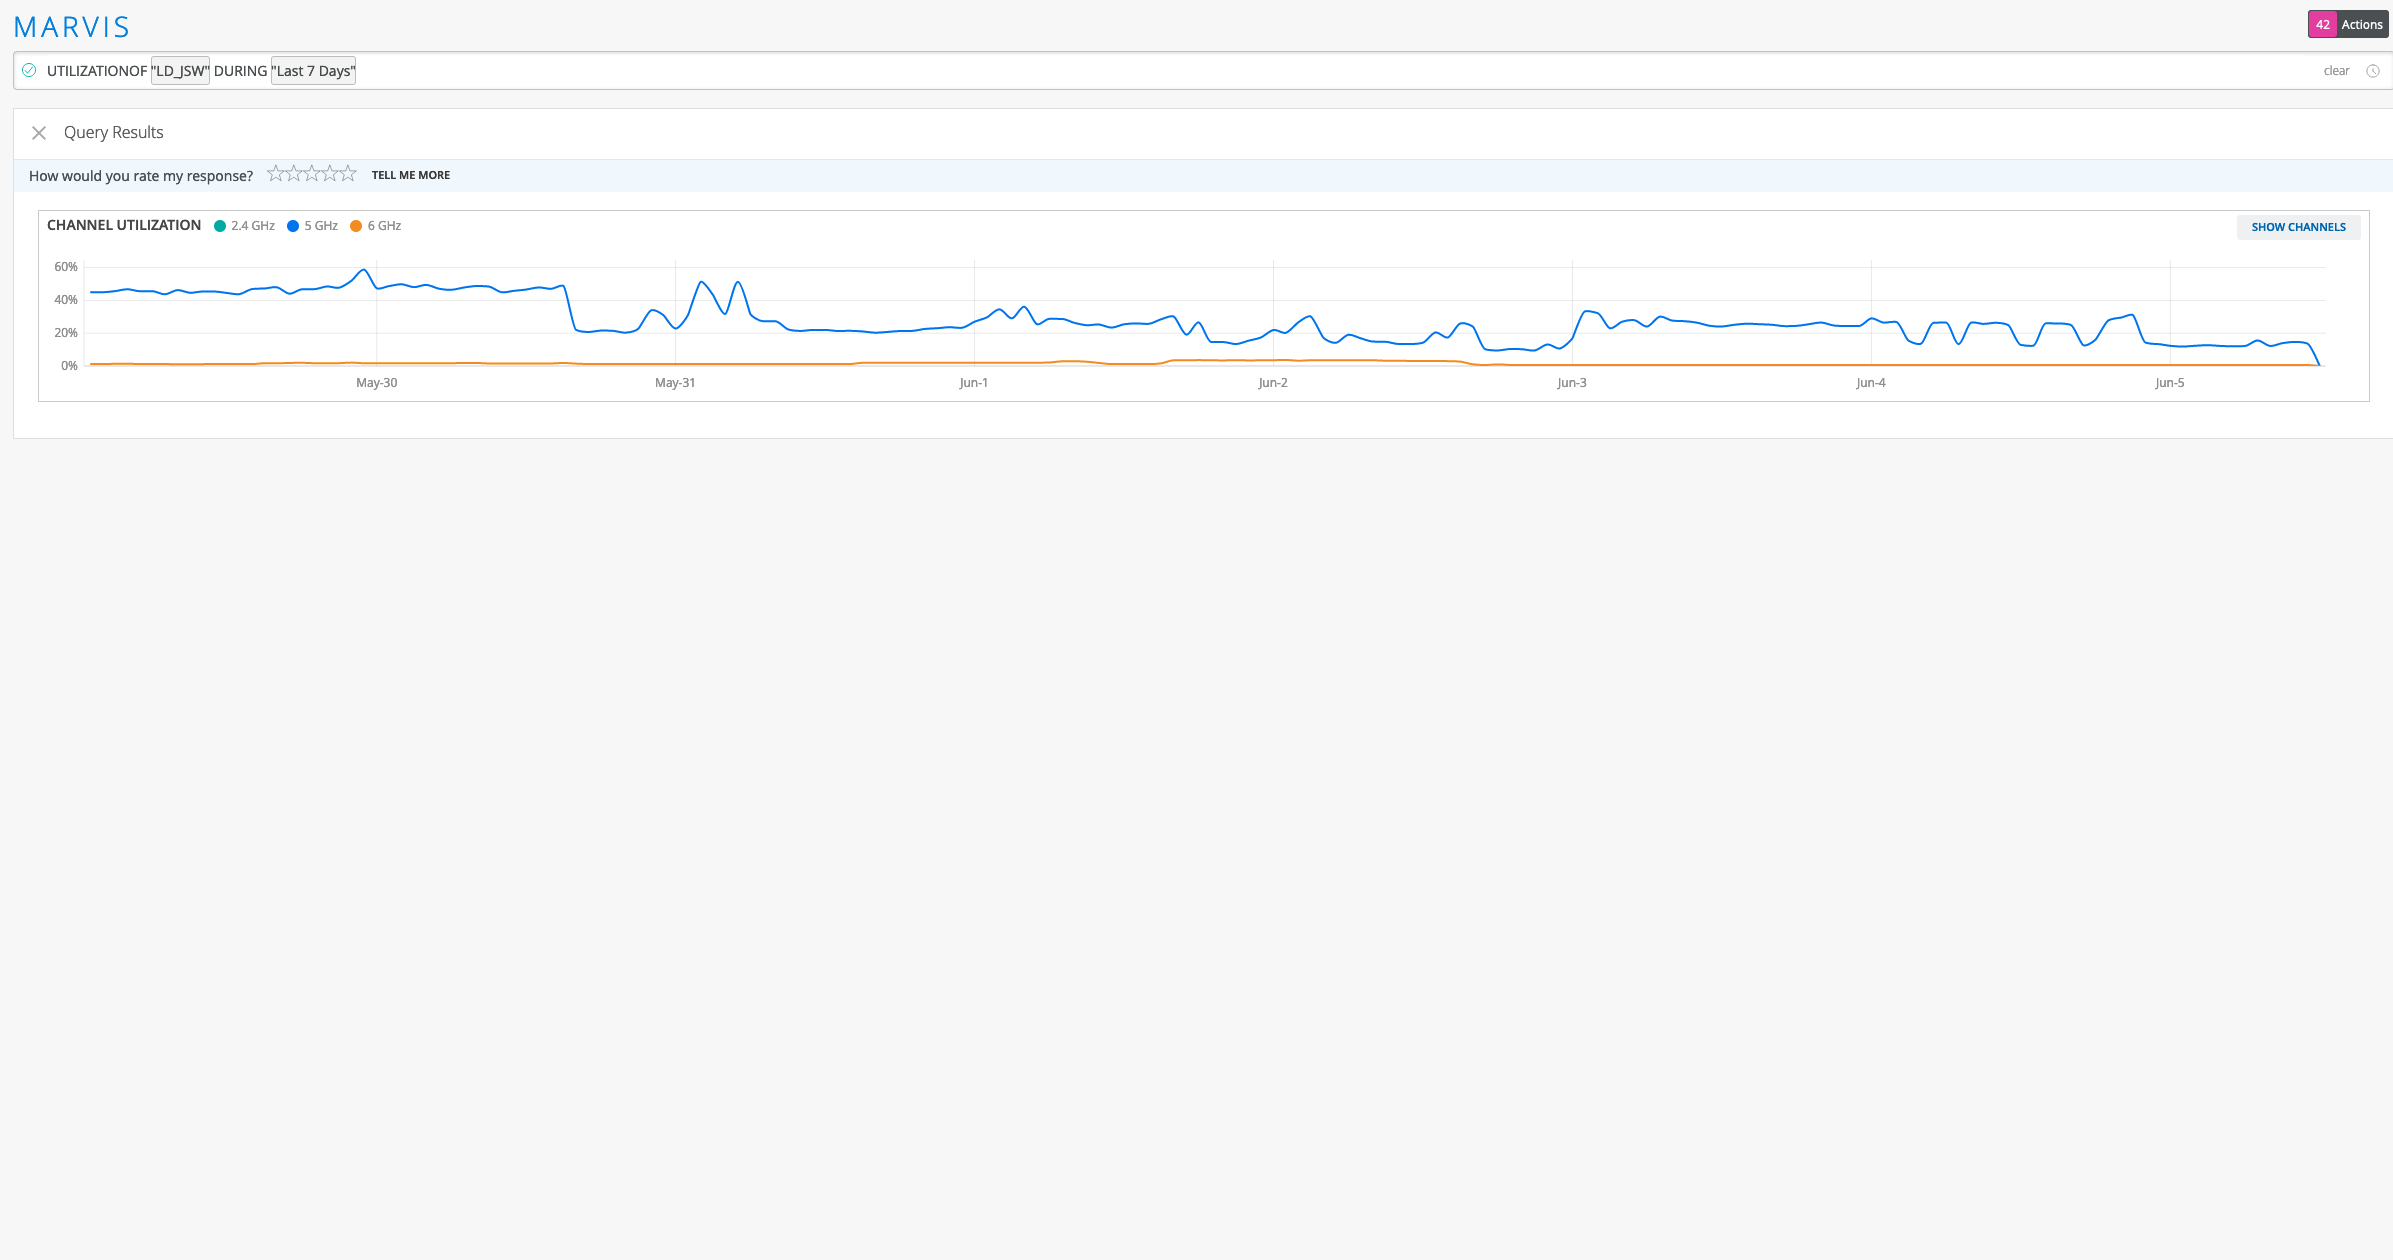
查看接入点的通道利用率
您可以使用 UTILIZATIONOF 查询查看接入点正在广播的信道以及 2.4 GHz、5 GHz 和 6 GHz 频段之间的使用水平。您可以单击显示 通道 以查看接入点使用的所有特定通道的明细。