Marvis 对话助手(使用代理式 AI 的增强版)

开始使用 Marvis 对话助手获取网络信息,识别并排除问题,

AI 驱动型 Marvis 对话助手可作为智能故障排除辅助工具,通过问题识别、网络遥测分析和有针对性的纠正措施建议提供一级协助。这些功能简化了诊断工作流程,提高了运维效率,并显著缩短了问题解决时间。通过利用多个工作流程代理、数据源、工具和先进的自然语言处理,Marvis 能够解读用户的提示,并将其转化为有意义的诊断操作

Marvis 从收集的遥测数据中提供尽可能多的洞察,以便您获得直接、可操作的信息进行查询。对话助手提供了一个综合和统一的视图,涵盖了您快速有效分析所需的一切。从问题描述和影响分析到可能的根本原因、建议和趋势,对话助手提供一整套信息。因此,您无需花费大量时间浏览多个页面并将信息拼凑在一起。

寻找对话助手

单击瞻博网络Mist门户左上角或右下角的Marvis图标。您还可以按 Ctrl + K 打开对话助手。
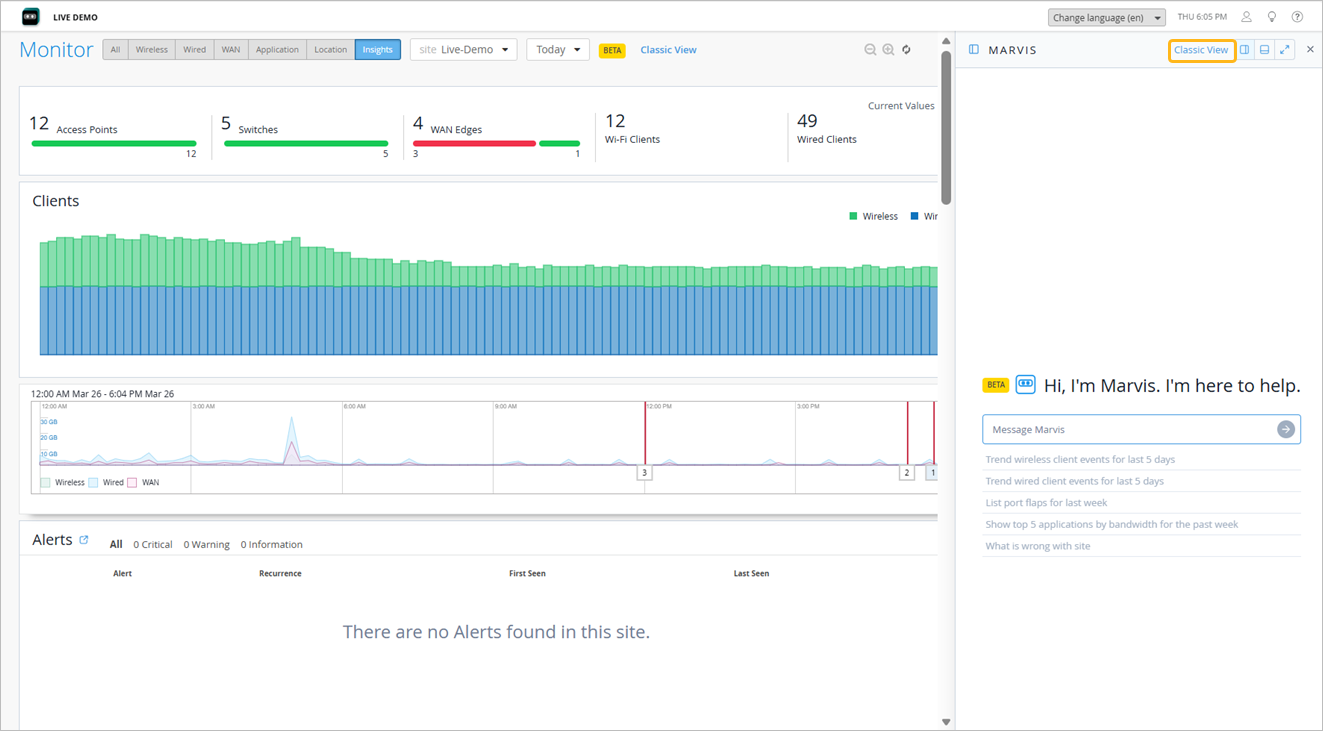
Network monitoring dashboard showing live demo site statistics: 12 access points, 5 switches, 4 WAN edges, 12 Wi-Fi clients, and 49 wired clients. Includes graphs for client counts and traffic trends, alerts section showing no issues, and Marvis assistant suggesting network queries.

您还可以使用页面右上角的链接切换到早期视图(经典视图)。如果您需要再次切换到增强视图,只需最小化 Marvis 对话界面并再次单击 Marvis 图标即可。

您可以将对话助手窗口停靠在屏幕的底部或右侧,以使其始终可见。这样,您就可以在 Mist 门户网站上的各个页面中导航,同时保持对话助手窗口处于可见状态。某些调试答案包括在新选项卡中打开的嵌入式链接,可确保原始 Marvis 对话界面在其当前选项卡中保持打开状态。使用右上角的图标停靠窗口。停靠窗口后,Mist 会自动保存停靠位置。您还可以通过拖动窗口的边框来调整窗口的大小。

User interface with MARVIS text, Classic View option, highlighted grid and list view icons, maximize arrow icon, and close button X for layout toggling.

当您注销 Mist 门户并再次登录时,窗口将保留其最后大小和停靠位置(底部或右侧),

Marvis 对话界面提示编写指南

我们建议您遵循这些准则,使 AI 助手能够提供准确的见解、执行有效的故障排除并提供可操作的建议。

准则 示例
清晰简洁地描述您想知道或解决的问题有助于 Marvis 更好地解读您的请求。条理清晰的查询有助于 Marvis 确定您是在寻找信息、网络可见性或问题诊断支持。
  • 显示以太网速度较低的设备

  • 调查无线性能不佳的情况

  • 站点站点名称有什么问题

  • 如何使用 802.1x 配置 WLAN

有关受影响范围的详细信息(例如站点名称、客户端信息或设备信息),使 Marvis 能够缩小范围并集中分析范围。默认情况下,Marvis 会考虑 24 小时;包括相关的时间范围可以进一步细化响应。
  • 现场接入点问题 Store-001 在过去 24 小时内

  • Core-Switch-01 怎么了

  • 向我显示过去 7 天内所有现场不良无线客户端事件 Store-001

您可以使用自然语言,而无需特定命令。为清楚起见,我们建议您一次询问一个主要问题,并使用后续问题来优化查询。
  • WLAN SSID001是否存在任何身份验证失败

  • 显示 WLAN SSID01 上的授权失败事件

  • 为什么客户端在过去 24 小时内对 SSID Corp-WiFi 上的 DHCP 失败?

症状在有效的故障排除中起着重要作用。对症状或问题的清晰详细描述使 Marvis 能够提供更加集中和准确的响应。
  • 我的客户端没有在网站上收到 IP 地址 Store-001

  • 现场接入点频繁断开连接 Store-001

  • 现场高峰时段车速缓慢 Store-001

Marvis 对话界面提示示例

以下是针对不同提示生成的一些示例响应。这些示例将帮助您了解如何构建和使用提示来获取所需的信息。

  • 跟踪一段时间内不良客户端事件的趋势和进展。

    提示:过去 7 天内的不良客户端事件趋势
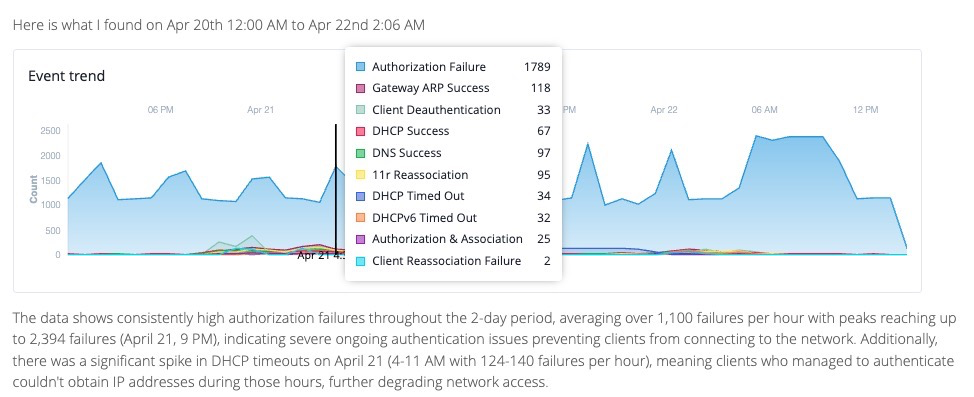
    Event trend graph showing network events over April 20-22. Authorization failures peaked at 2394 on April 21 at 9 PM, indicating persistent authentication issues. DHCP timeouts spiked on April 21 from 4-11 AM, impacting network access.

    您可以使用后续查询来筛选结果。例如,以下是排除授权失败的输出:

    Data analysis report on wireless client events over two days, highlighting DHCP timeouts spiking to 140 events per hour on April 21st, causing severe network disruptions.
  • 识别遇到 VPN 路径关闭问题的设备。

    提示:哪些设备会受到 VPN 路径关闭问题的影响
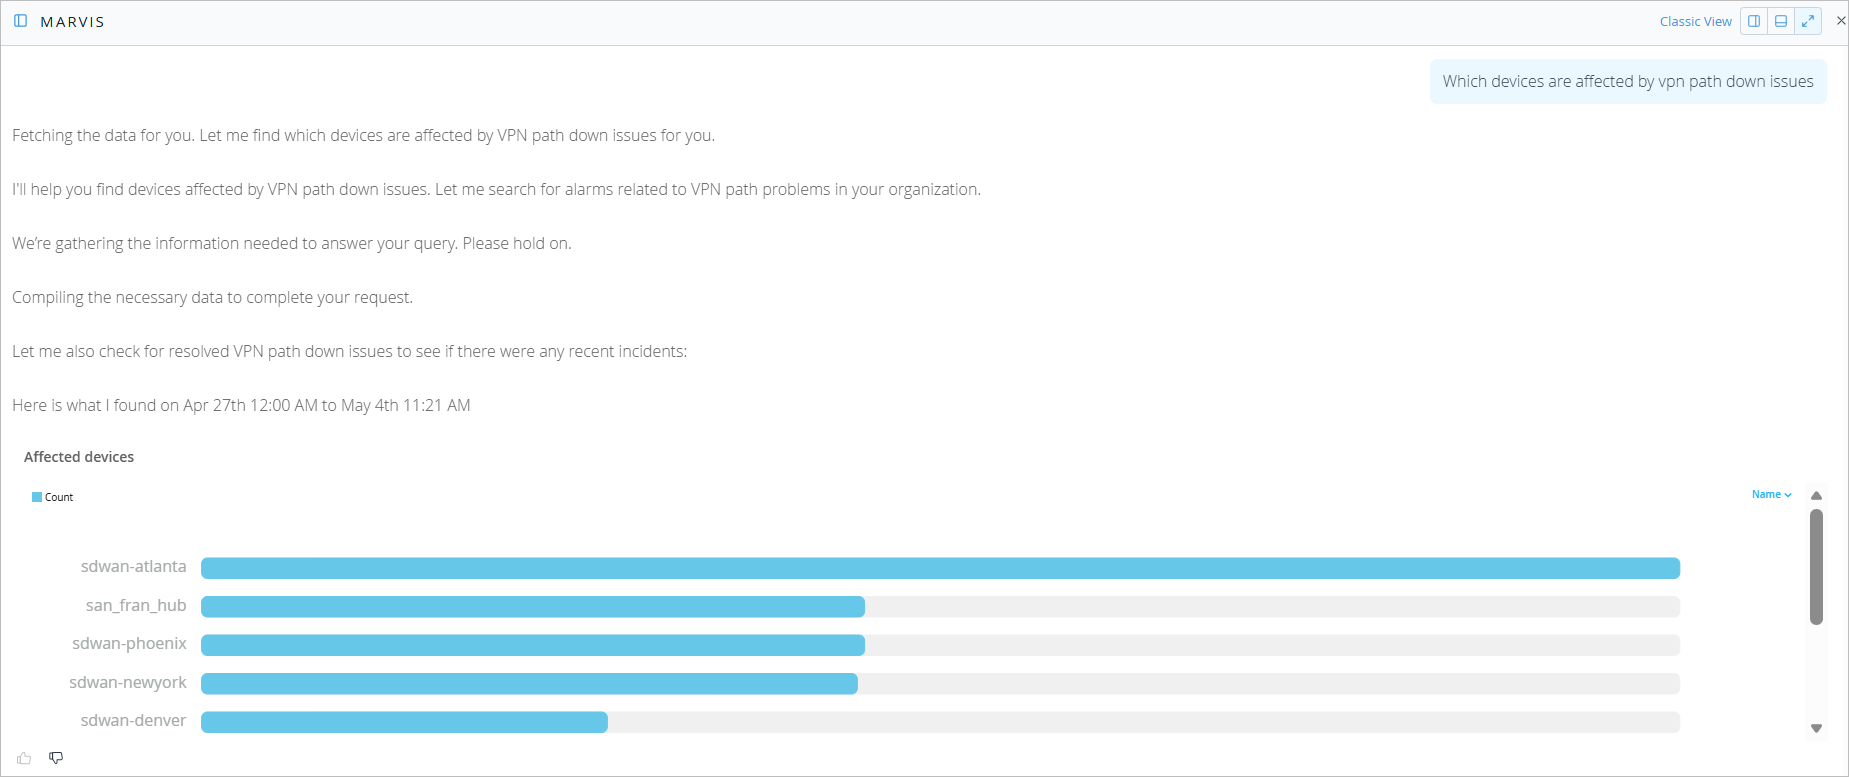
    Dashboard showing VPN path down issues analyzed by Marvis from April 27th, 12:00 AM to May 4th, 11:21 AM. Lists affected devices with issue counts: sdwan-atlanta, san_fran_hub, sdwan-phoenix, sdwan-newyork, sdwan-denver.

  • 确定导致特定站点身份验证问题的原因。

    提示:为什么我在客户端 everest-4 上看到身份验证问题
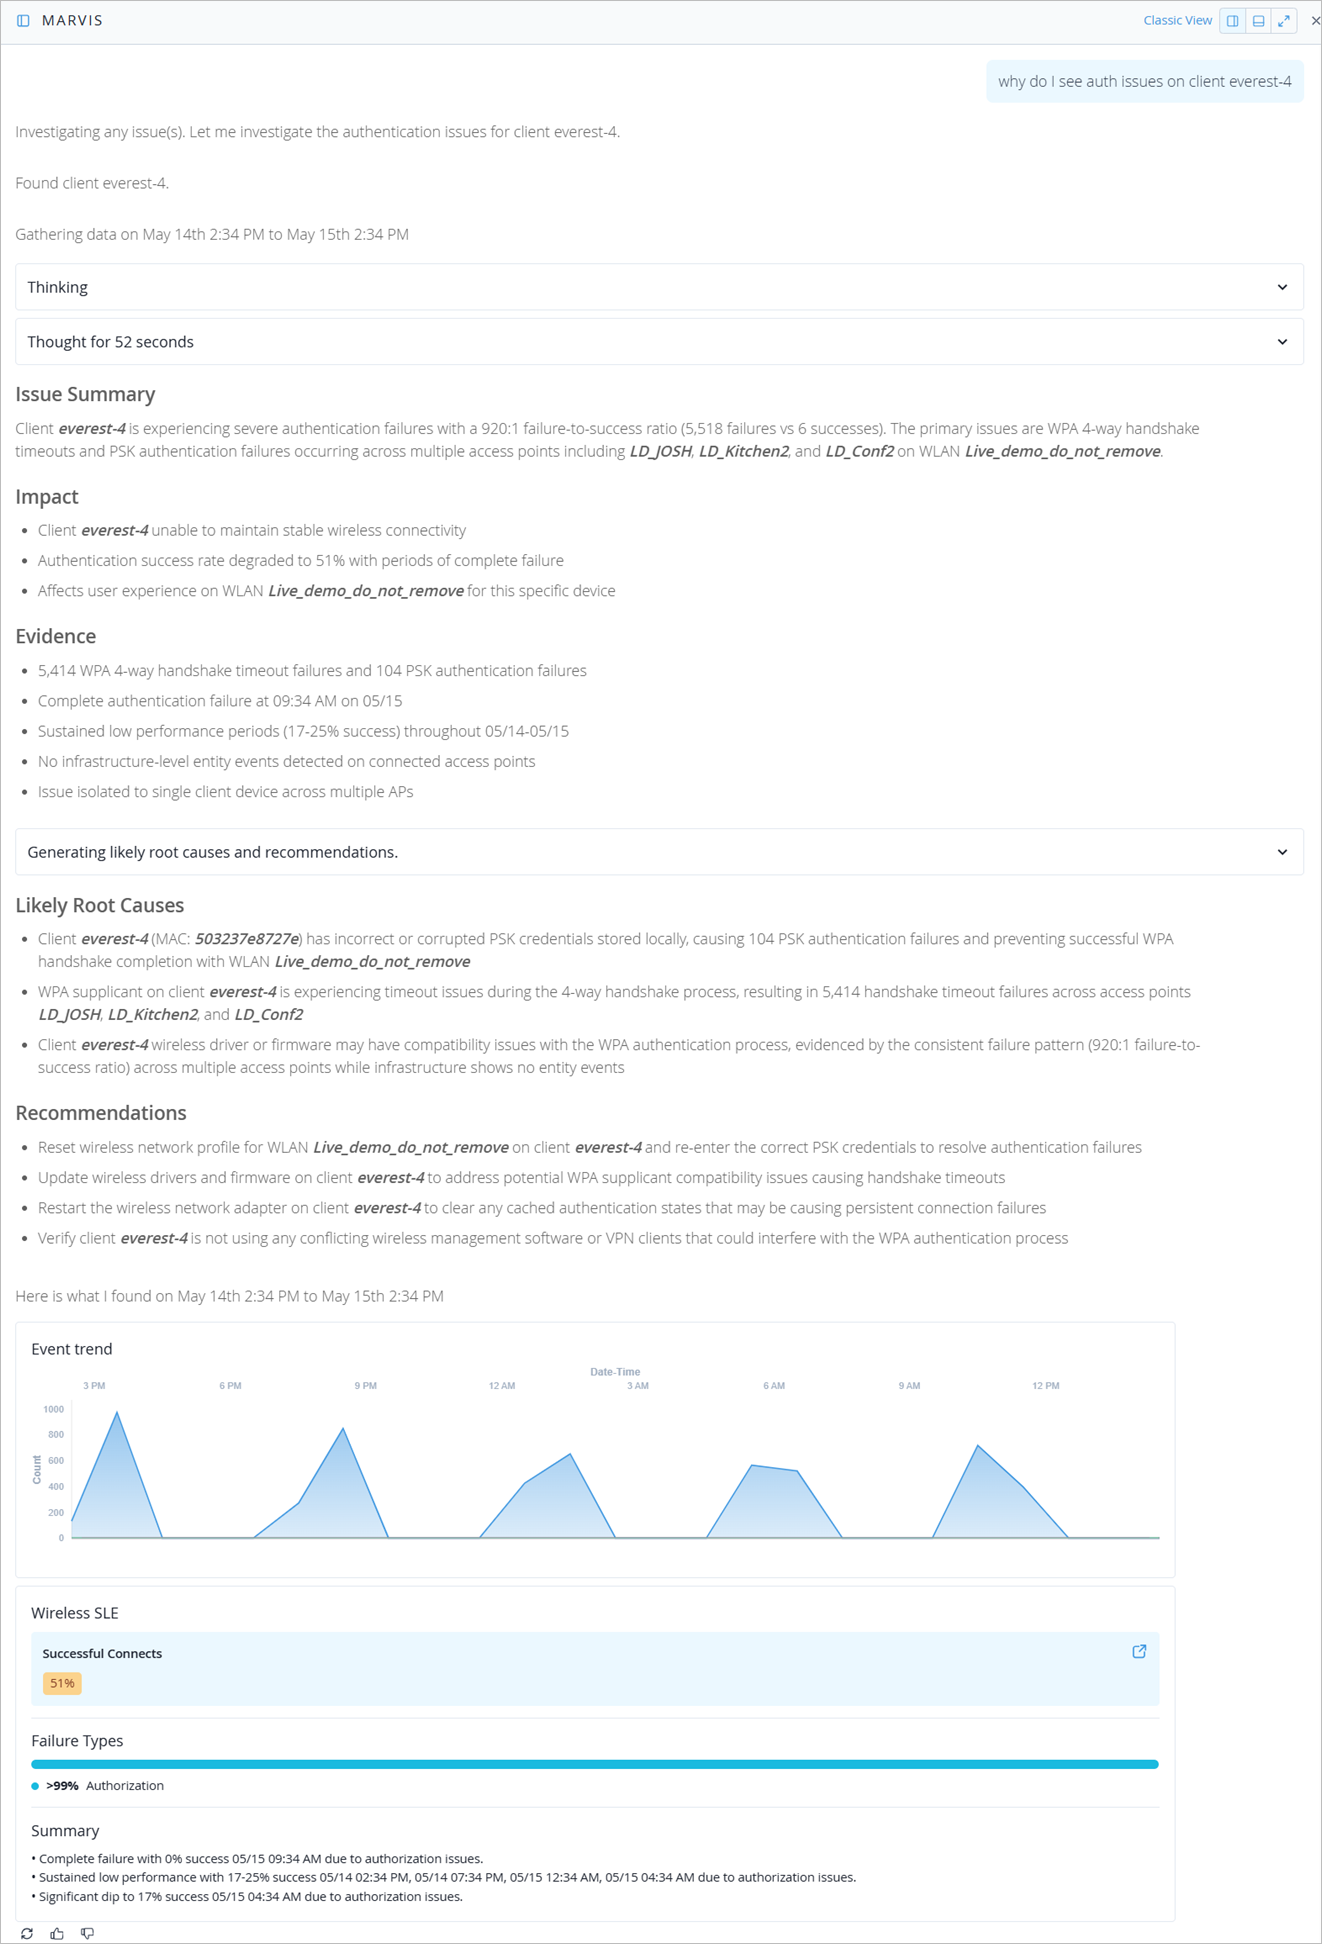
    Diagnostic report analyzing authentication issues for client device everest-4. Key findings: 920 to 1 failure-to-success ratio, major WPA handshake timeouts, PSK failures, and degraded connectivity. Recommendations include resetting PSK credentials, updating drivers, and clearing cache.

  • 清楚地了解特定站点上发生的问题。

    提示:过去 60 分钟内网站直播演示出了什么问题
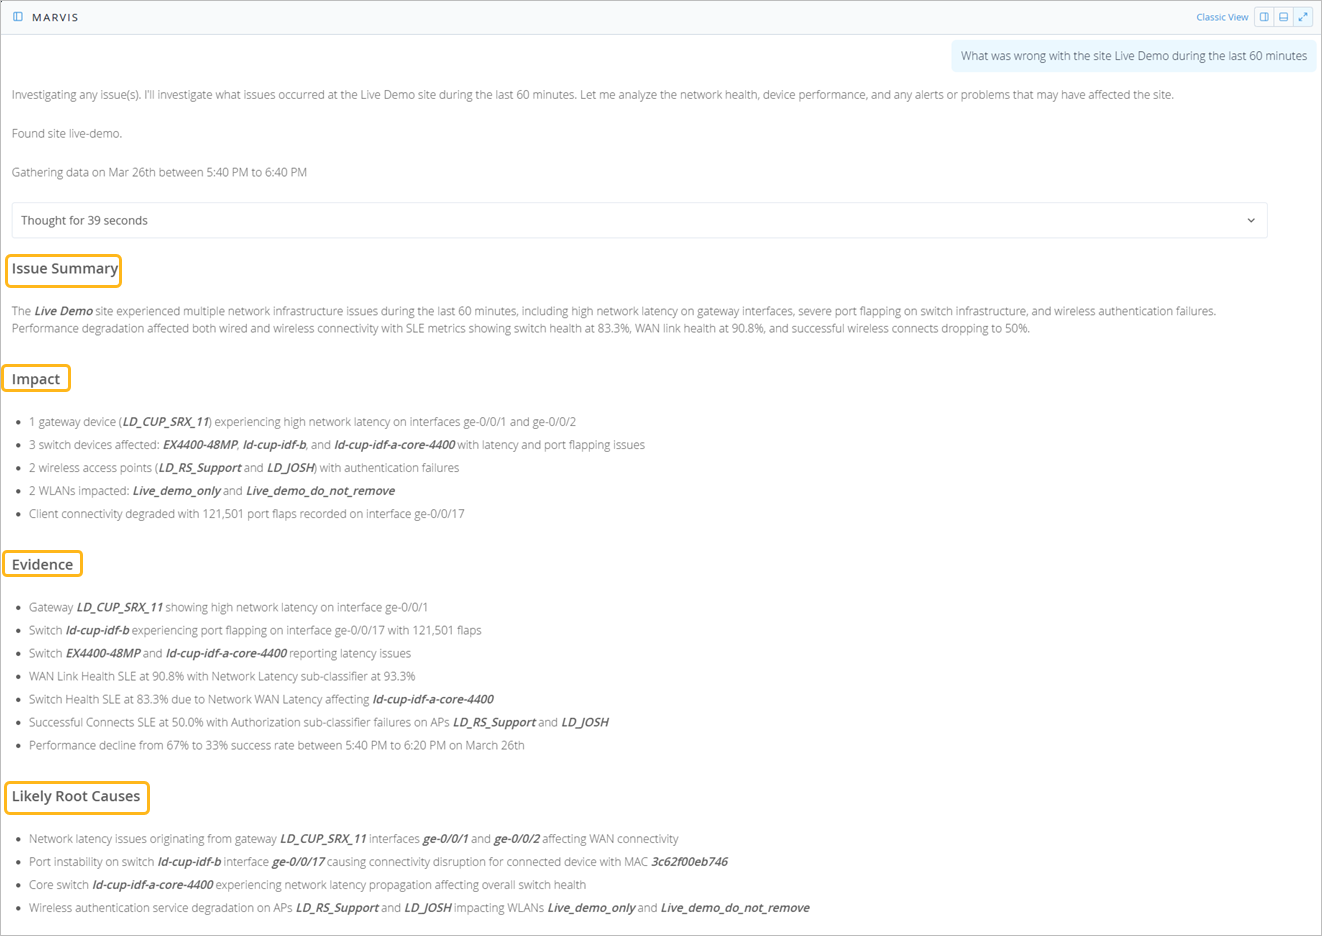
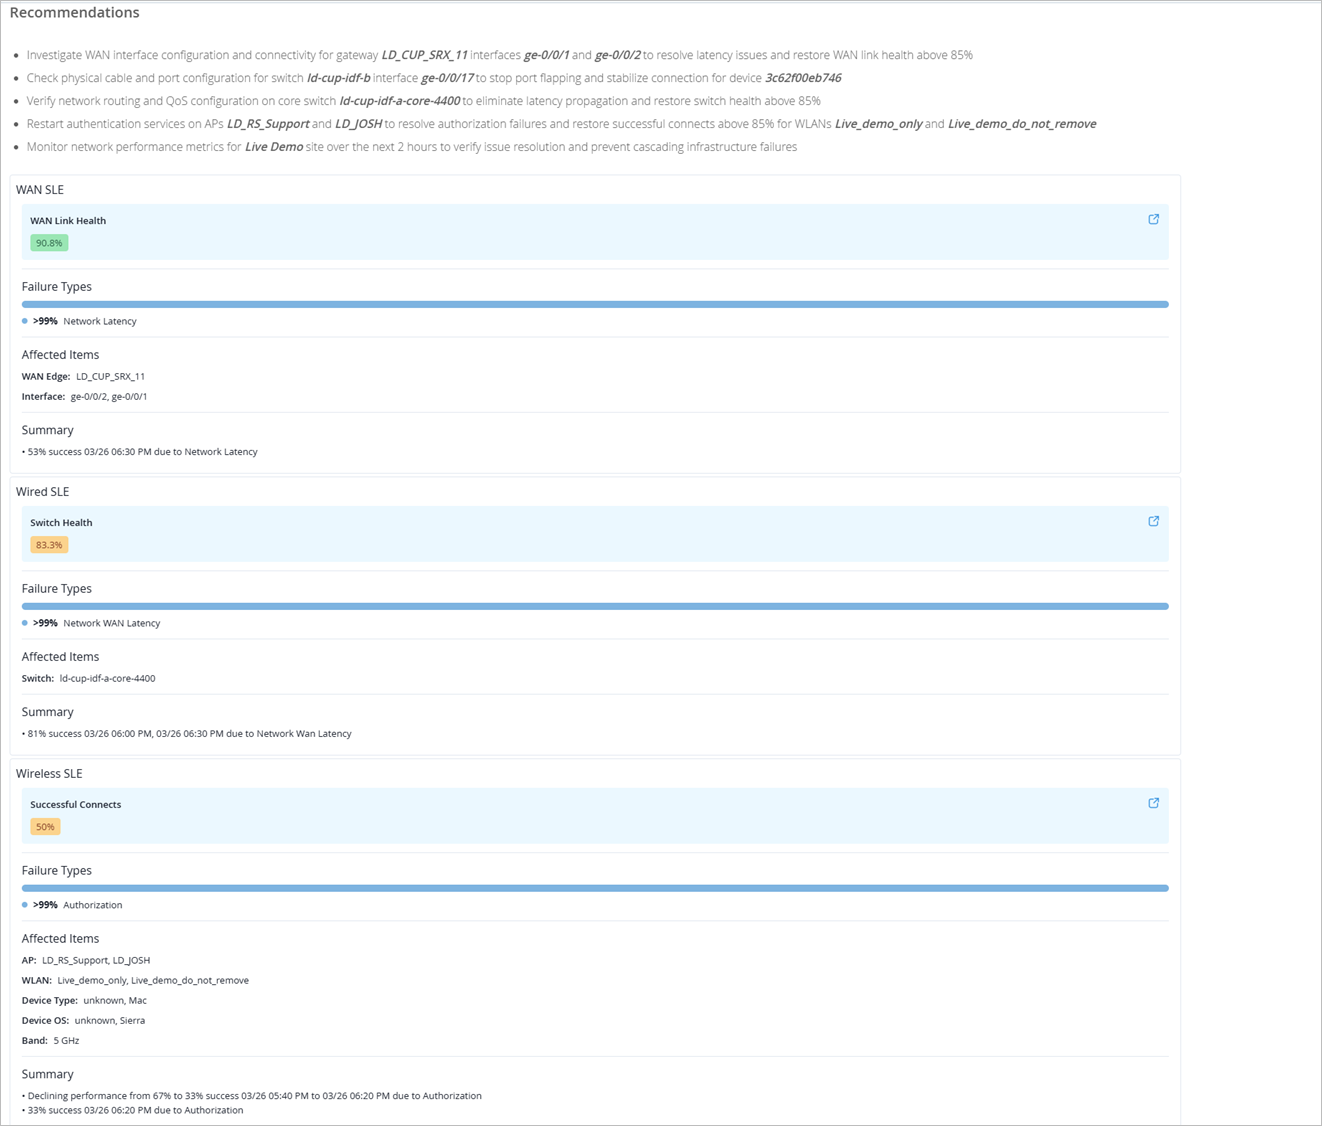
    Diagnostic report detailing network issues for Live Demo site, including high latency on gateway, port flapping on switches, wireless authentication failures, and performance degradation impacting wired and wireless connectivity. Lists affected devices, evidence of issues, and likely root causes such as gateway latency, switch instability, and wireless service degradation.

    Network performance report summarizing WAN, wired, and wireless metrics. Includes recommendations for latency resolution, WAN health at 90.9 percent, wired switch health at 83.3 percent, and wireless connection success at 50 percent. Highlights affected items and failure causes like latency and authorization issues.

  • 查看客户端的漫游历史记录。

    提示:显示客户端 ZS-user106 最近 7 天的漫游

    Marvis interface showing 7-day roaming history of client ZS-user106 with a graph of AP associations, signal strength, roaming events marked by arrows and timestamps, and detailed event data including RSSI and channel.

  • 查看特定站点的交换机上配置的端口配置文件列表。

    提示:在现场列出所有端口配置文件 live-demo
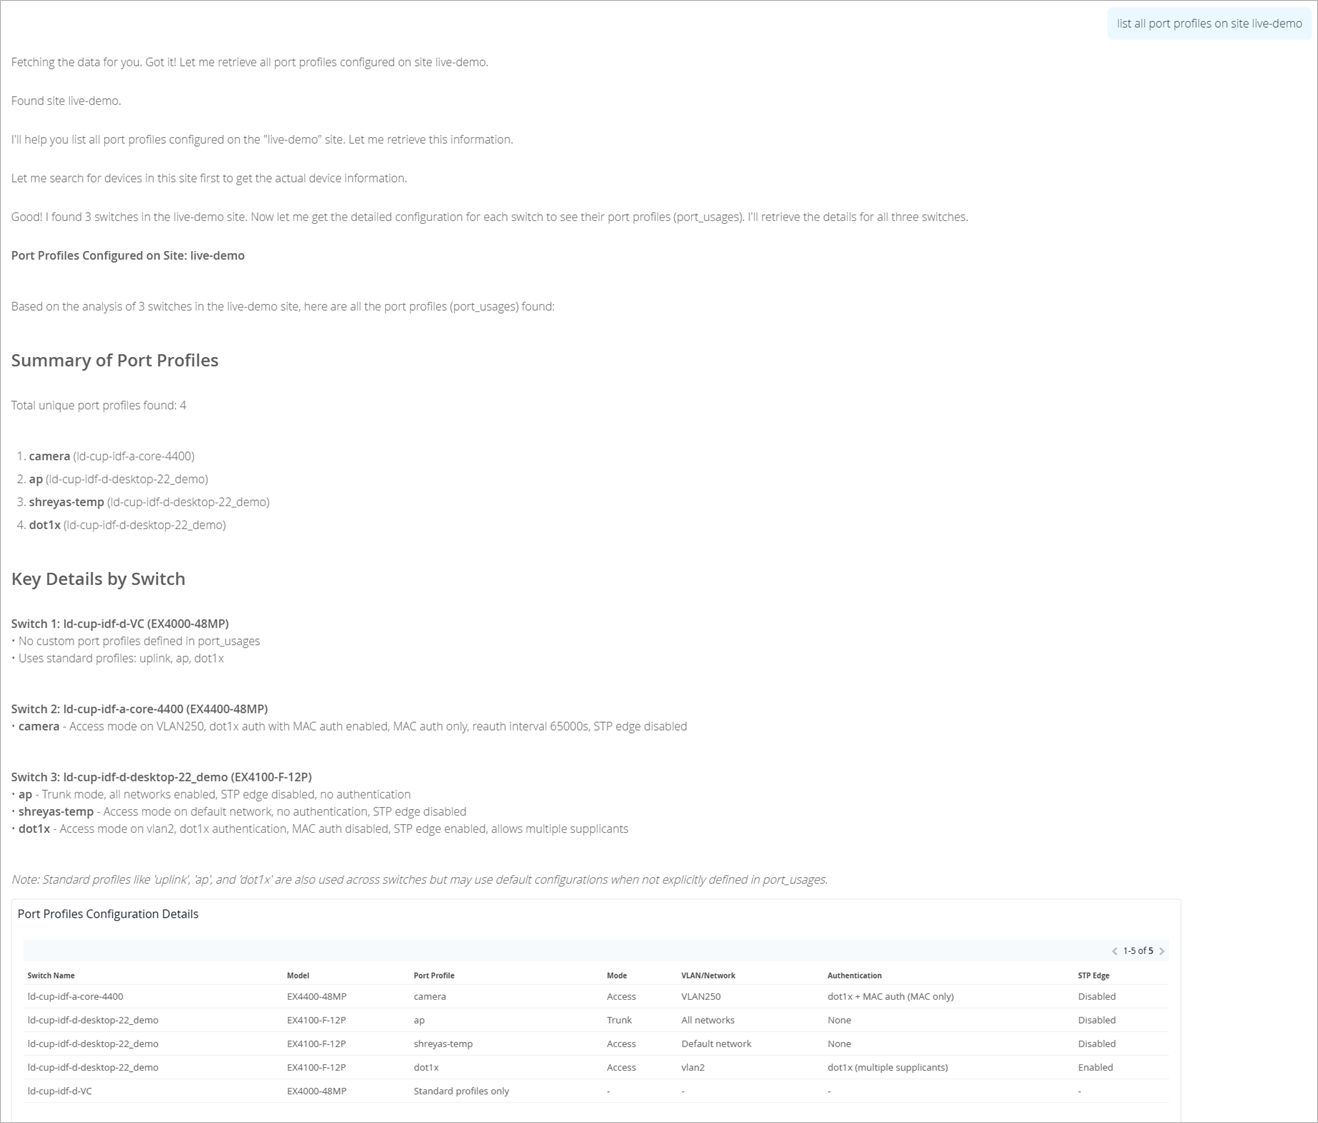
    Screenshot of a network management report showing port profiles at the live-demo site. Lists 4 unique profiles: camera, ap, shresys-temp, and dot1x. Details configurations for 3 switches, including VLAN and authentication settings. Used for network configuration and troubleshooting.

  • 按带宽使用情况查看排名前五的应用。

    提示:显示过去 7 天内按带宽排名前 5 的应用程序
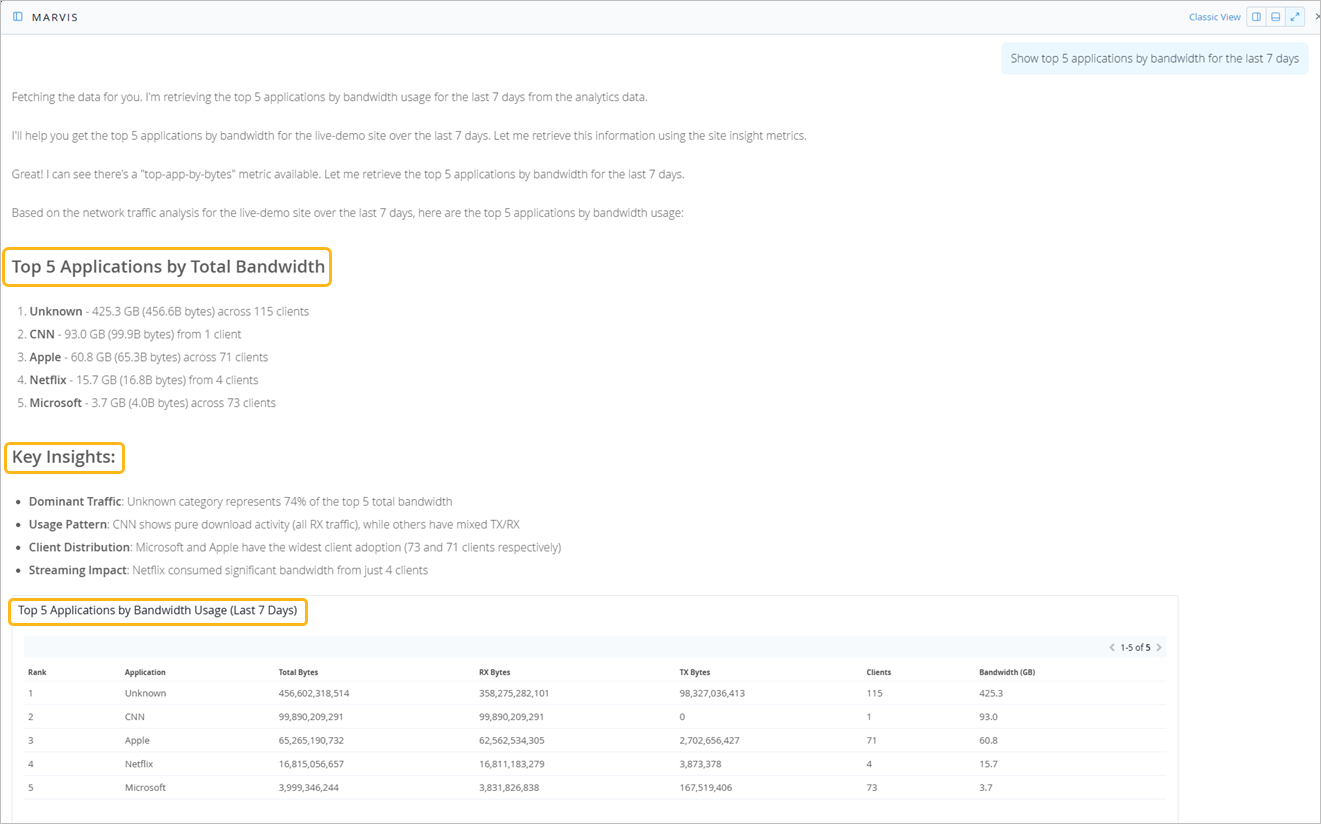
    Dashboard showing analytics of top 5 applications by bandwidth usage over 7 days: Unknown leads with 425.3 GB across 115 clients, followed by CNN, Apple, Netflix, and Microsoft. Key insights include dominant traffic from Unknown at 74 percent, CNN as pure download, and wide client adoption for Microsoft and Apple. Netflix has high bandwidth from 4 clients.

  • 查看报告雷达问题的接入点

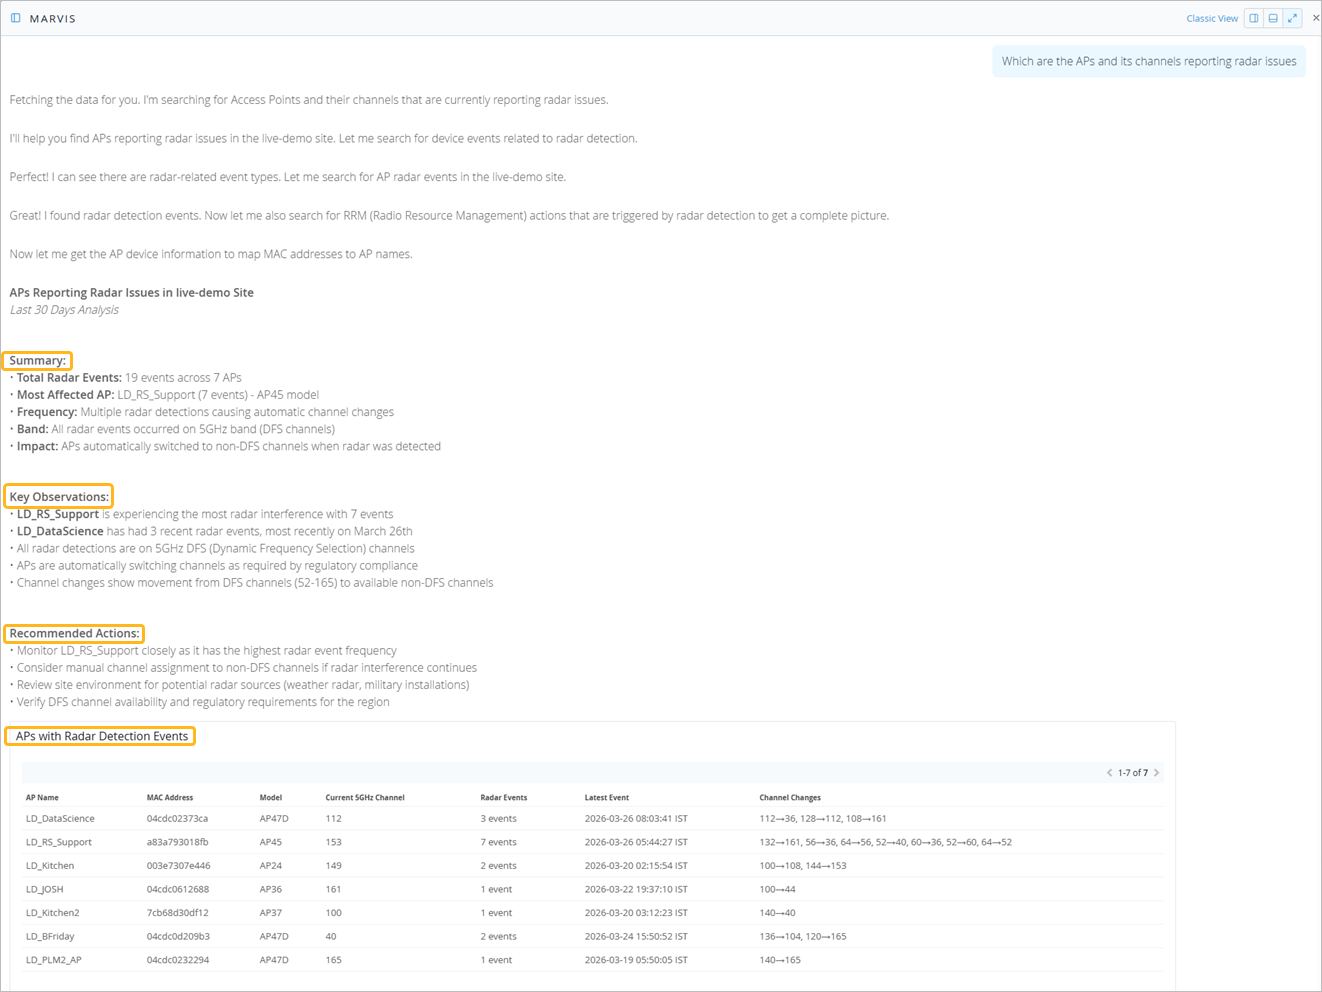
    提示:哪些是报告雷达问题的接入点及其信道

    Radar detection report for Access Points in a live-demo site, showing 19 radar events on 5GHz DFS channels, most affecting LD_RS_Support AP with 7 events. Includes summaries, key observations, and recommended actions for optimizing wireless network performance.

  • 验证 NAC 规则配置是否正确

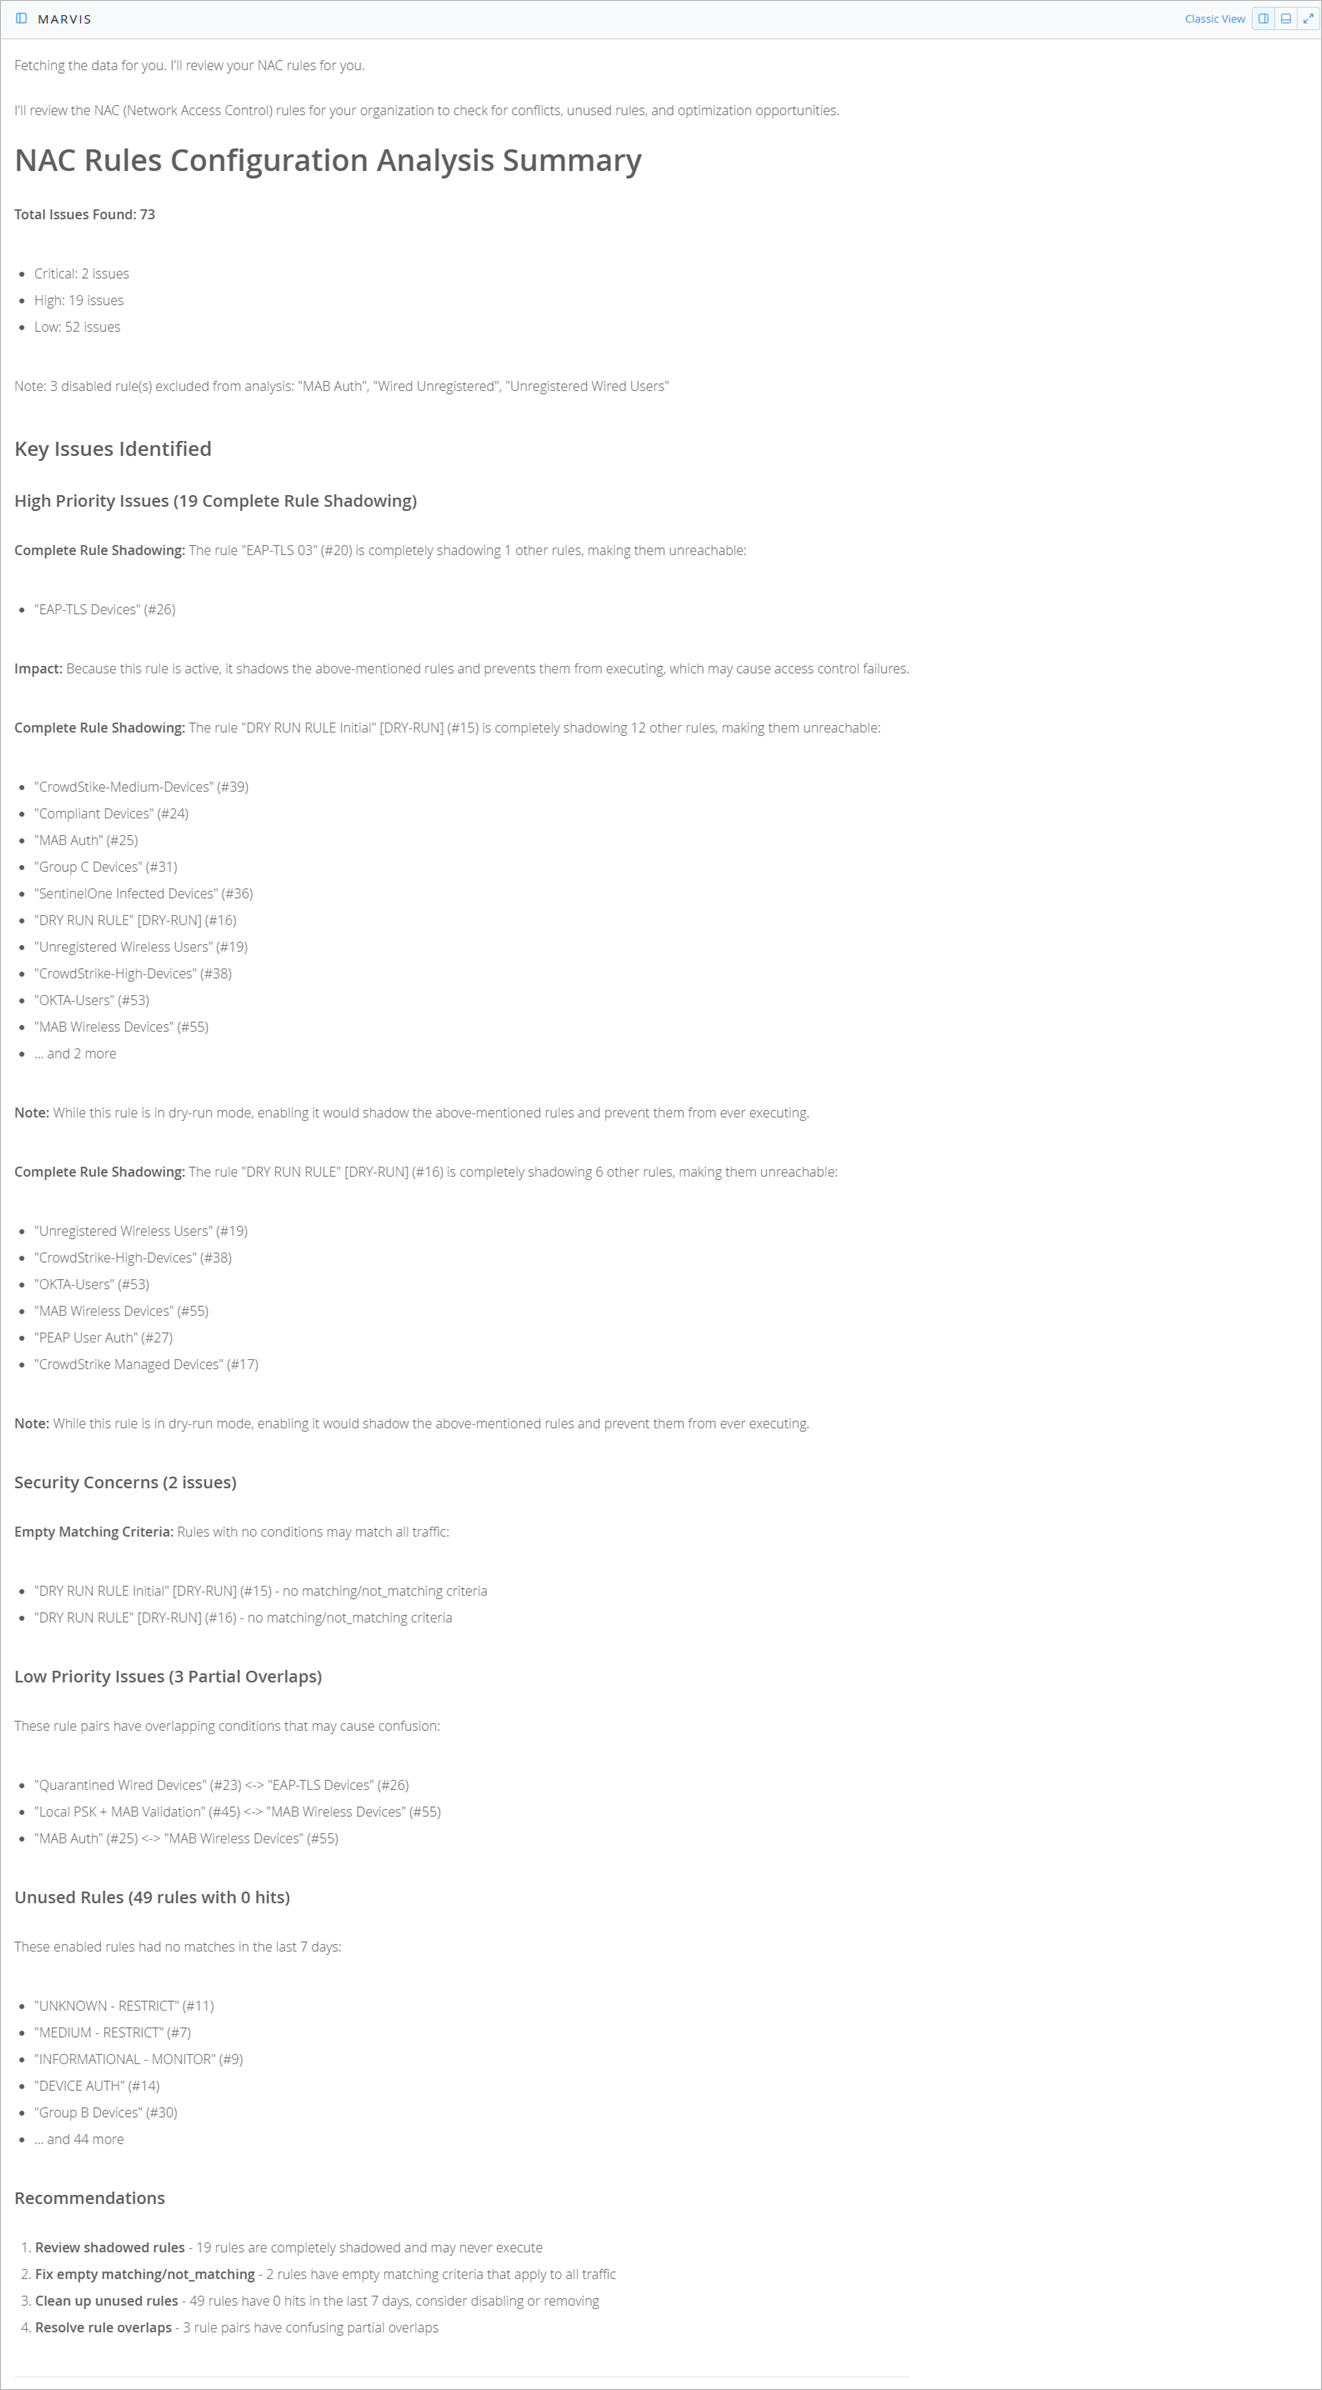
    提示:查看 NAC 规则

    NAC Rules Configuration Analysis Summary: 73 issues found with 2 critical, 19 high, and 52 low priority. Shadowing issues, security concerns, and unused rules identified. Recommendations include reviewing shadowed rules, fixing empty criteria, and cleaning up unused rules.

  • 排查影响特定用户的 Teams 问题。

    提示:5 月 28 日对客户端 a0:xx:xx:ad:xx:e4 的应用程序团队进行故障排除
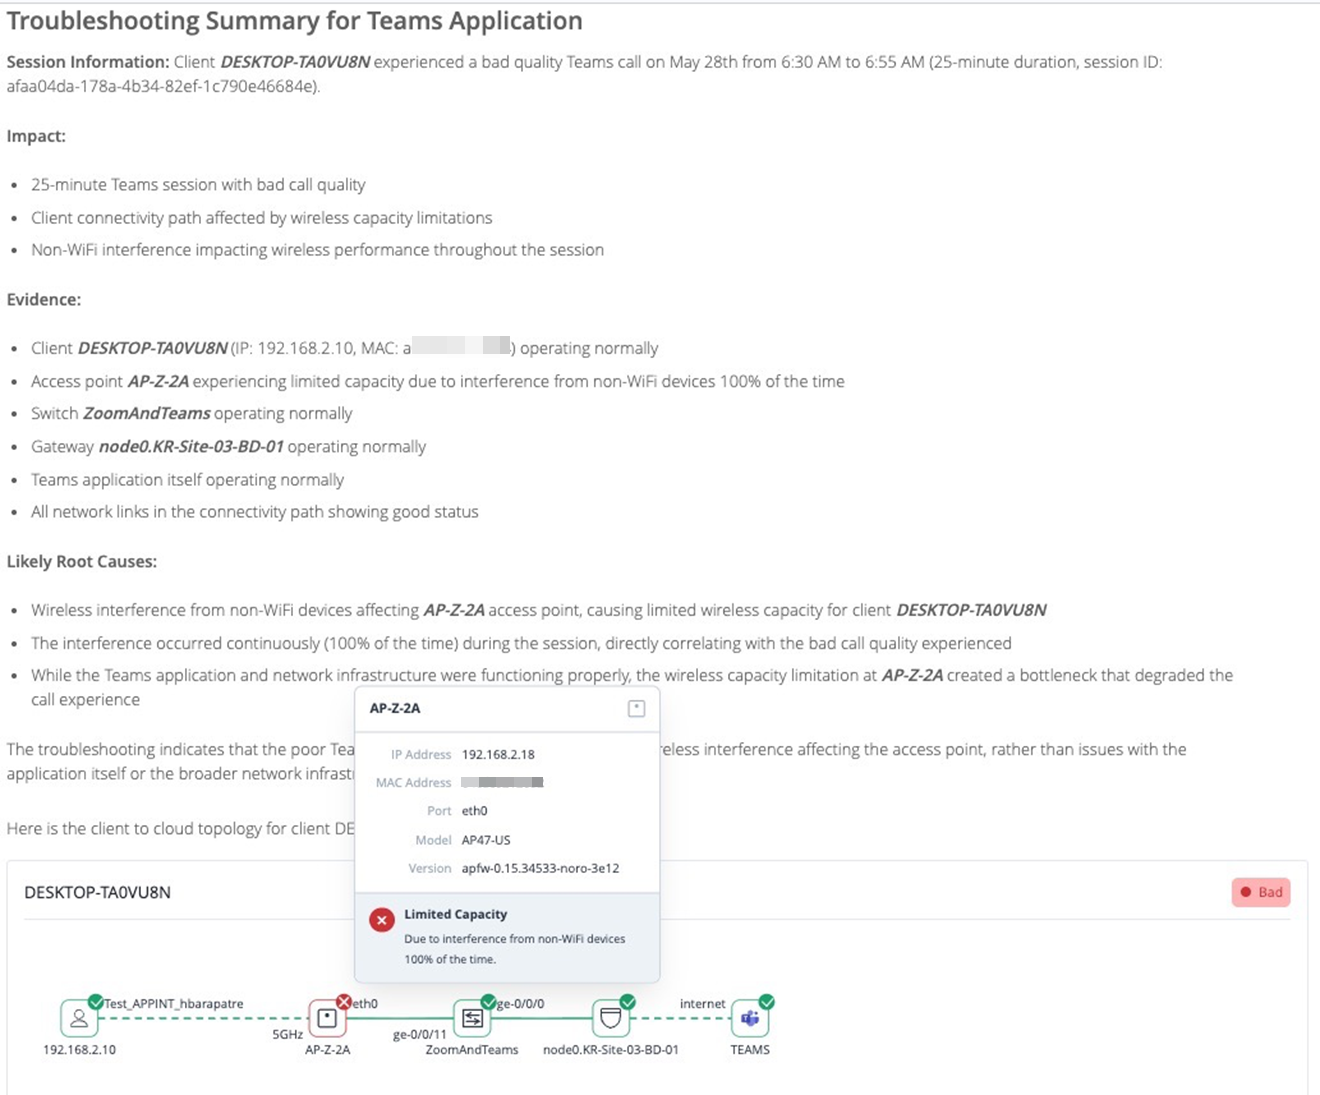
    Troubleshooting summary report for a bad-quality Microsoft Teams call session. Highlights session details, wireless interference, access point capacity limitations, evidence of network links and Teams app functioning normally, and a client topology diagram identifying access point AP-Z-2A as the bottleneck.