Marvis-Zebra 集成

探索将 Marvis Android 客户端与 Zebra Wireless Insights 集成的优势。

概述

Marvis 客户端与 Zebra Wireless Insights 协同工作,可提供增强的网络和连接可见性。Zebra Wireless Insights 是 Zebra Android 设备内置的一项服务,可深入了解 Zebra 设备的数据、语音和漫游事件。Zebra 设备可以直接捕获最终用户端的客户端事件,无需运行任何其他测试。这些客户端事件报告结合 Mist 接入点 (AP) 和 Marvis 客户端捕获的现有事件报告,提供网络和客户端活动的整体视图。

您可以使用 Zebra 设备客户端洞察仪表板的“客户端事件”部分下的“客户端报告”选项卡查看客户端报告的事件。您可以使用选项卡在接入点报告的事件和客户端报告的事件之间切换。如果您的 Zebra 设备没有要报告的客户端事件,则该选项卡将被隐藏。

注意:

要从 Zebra 设备查看客户端事件,设备必须具有有效的 Wireless Insights 许可证并安装 Marvis Android 客户端(V33.x 或更高版本)。

连接事件

Mist 接入点提供对用户连接前和连接后状态的可见性。Marvis 客户端利用 Zebra 无线洞察获取有关连接状态的更多信息,包括对连接事件及其原因的详细可见性。您可以查看有关客户端连接和断开连接事件的详细信息。例如,您可以破译设备尝试连接、漫游或断开连接时会发生什么情况。

下面是一个示例事件和触发该事件的条件:

已触发断开抑制: 设备管理路径在接入点时仍处于活动状态。但是,数据路径将被阻塞——设备既不向接入点发送数据,也不接收数据。在此期间,数据会尝试漫游到新接入点或重新连接到同一接入点。漫游成功或重新连接到接入点后,数据路径或连接将恢复(由“断开连接抑制已完成”事件指示)。
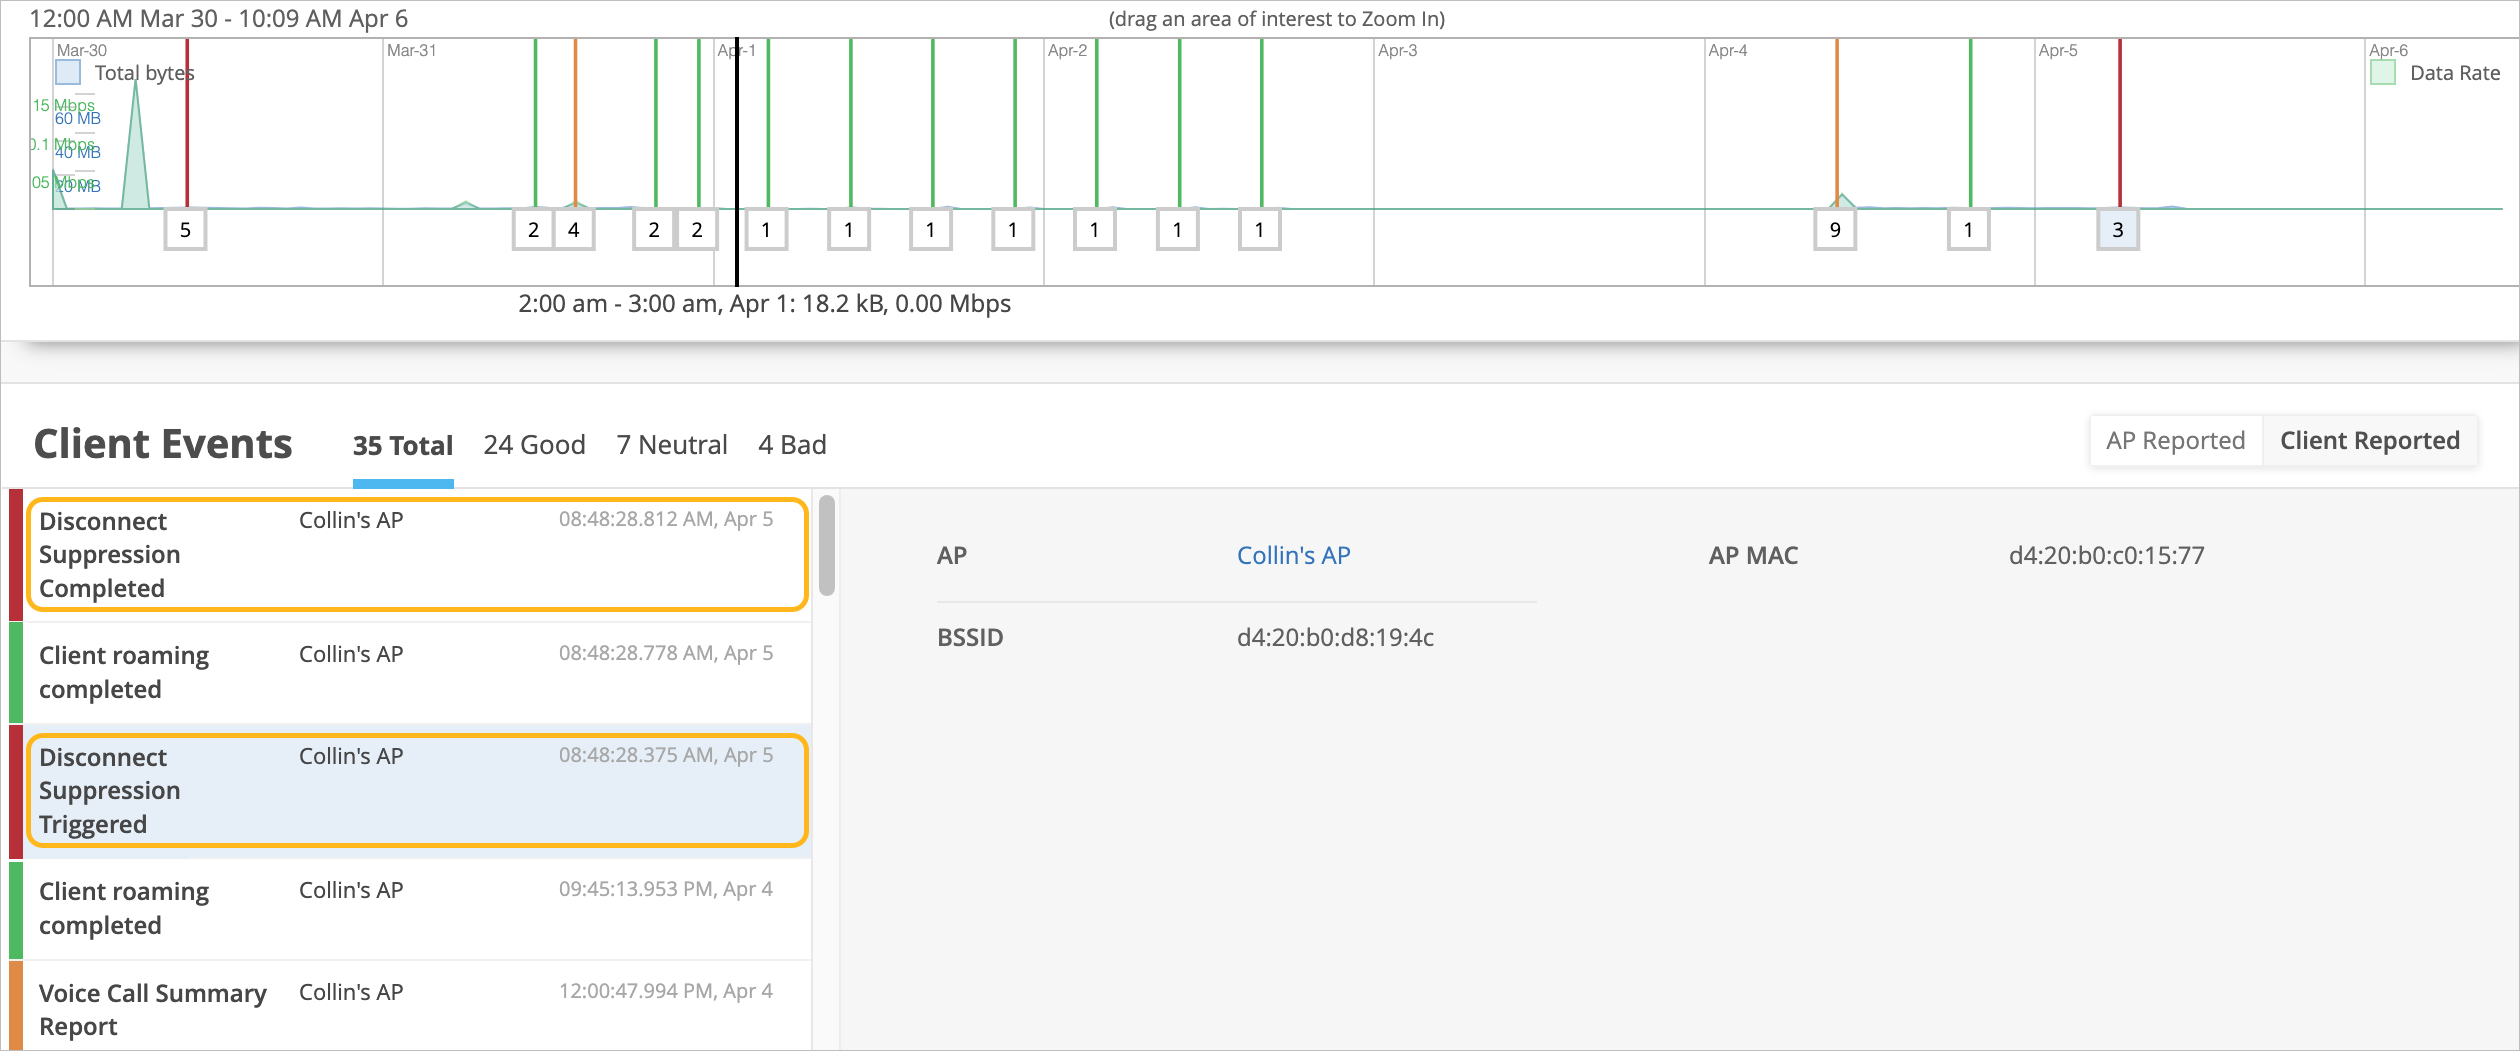
Network monitoring dashboard showing data usage timeline graph with spikes from March 30 to April 6, client events categorized as Good, Neutral, Bad, and access point details including AP name, BSSID, and MAC address.

漫游活动

Marvis 客户端通过 RoamingOf 查询提供每台设备的漫游旅程。借助 Zebra Wireless Insights,您可以深入了解触发漫游的原因,例如覆盖区域较小。
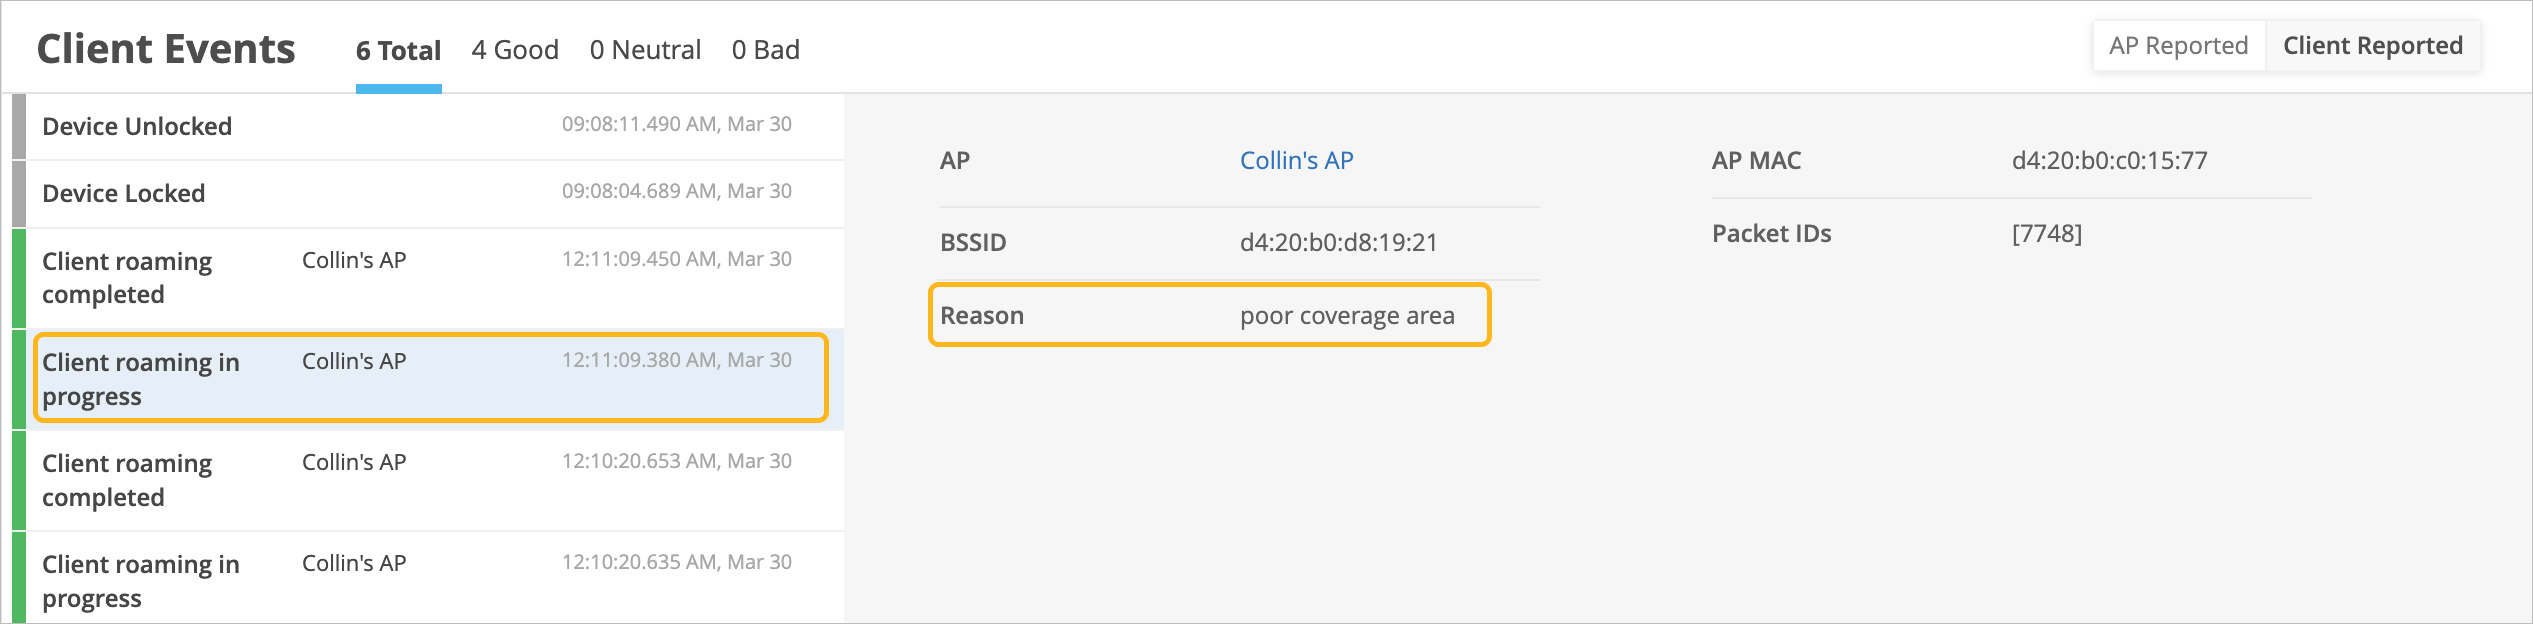
Client Events log showing device connection activity to Collin's AP, including Device Unlocked, Device Locked, Client roaming completed, and Client roaming in progress, with timestamps, BSSID, and roaming reason noted as poor coverage area.

语音活动

您可以查看和分析有关使用 Zebra 设备进行的语音呼叫的信息。Marvis 客户端可提供有关通话开始和结束时间的详细信息,以及通话表现。您可以在通话期间和通话结束后查看语音事件摘要。
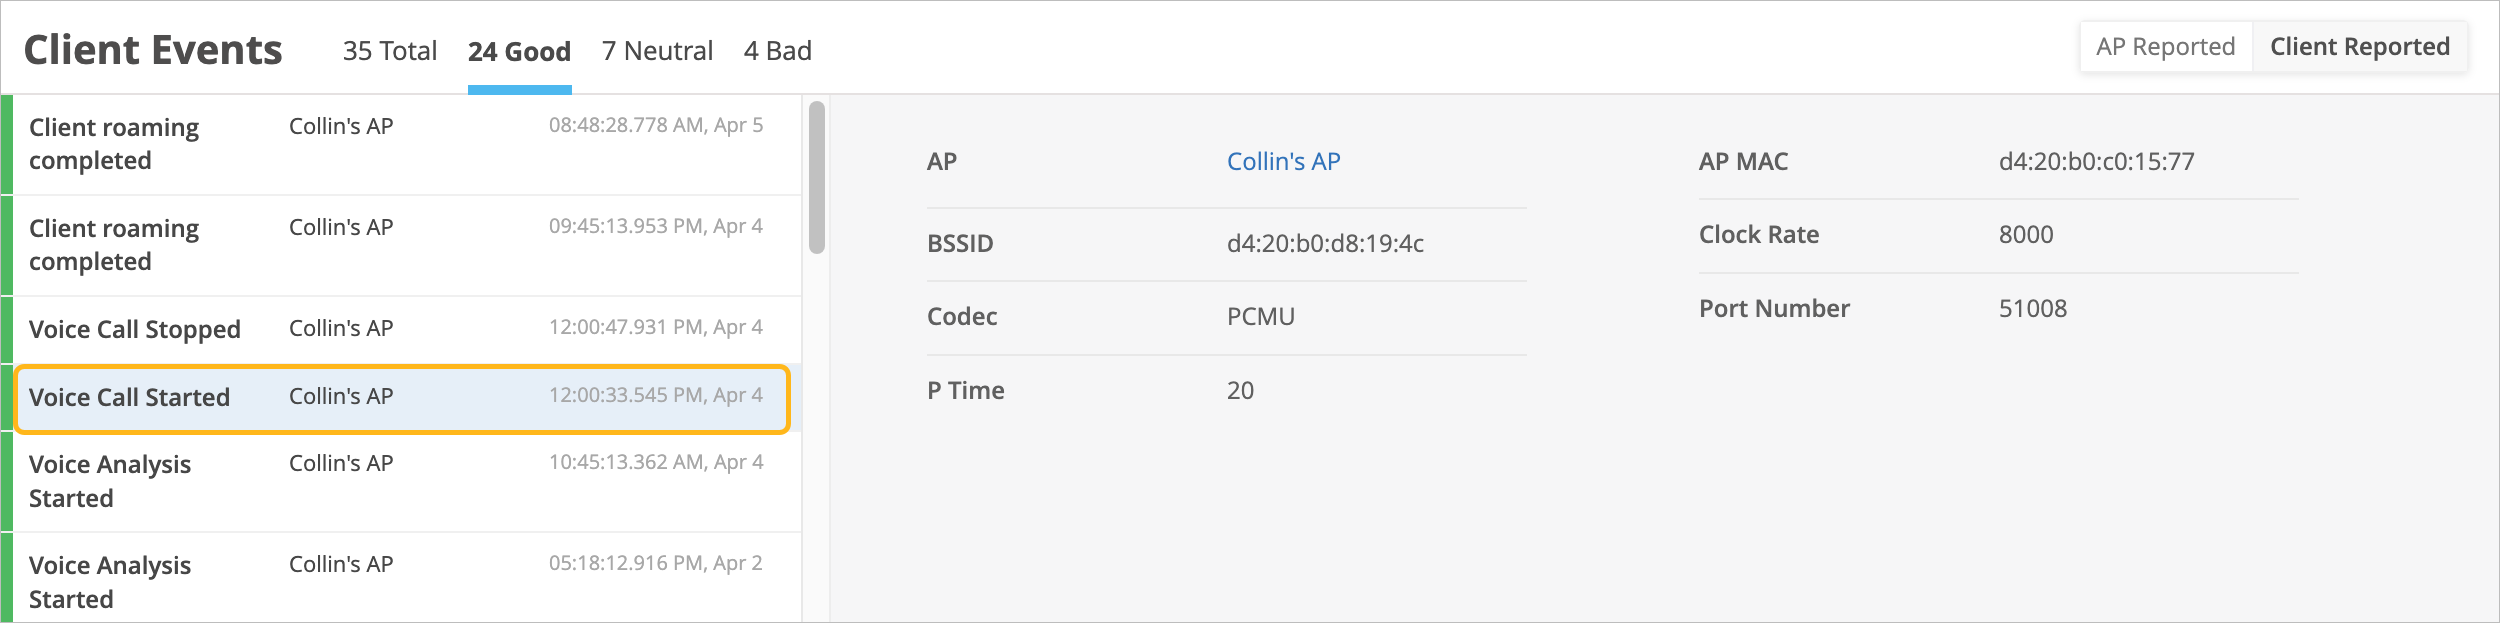
Client Events log interface showing network activity details, including timestamps, event types like Client roaming completed and Voice Call Started, access point names, and specifics like codec, packetization time, and port number for monitoring and troubleshooting.

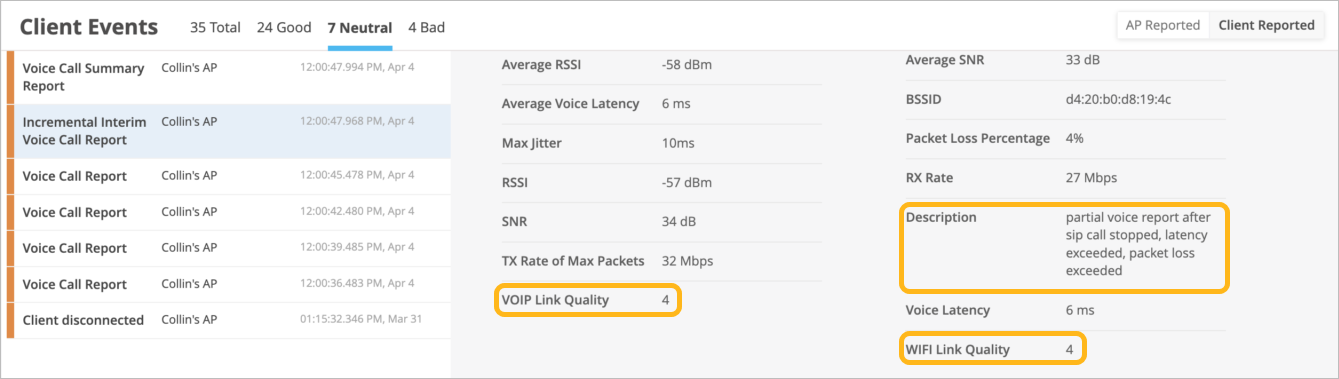
Zebra Wireless Insights 可以在数据包丢失、延迟、抖动、VoIP 链路质量和 Wi-Fi 链路质量方面衡量性能。Mist 云从 Marvis 客户端接收这些数据,并在客户端的“洞察”页面上显示这些数据。您还可以查看通话期间发生的事件的描述和原因,这可以从客户端的角度更深入地了解体验。
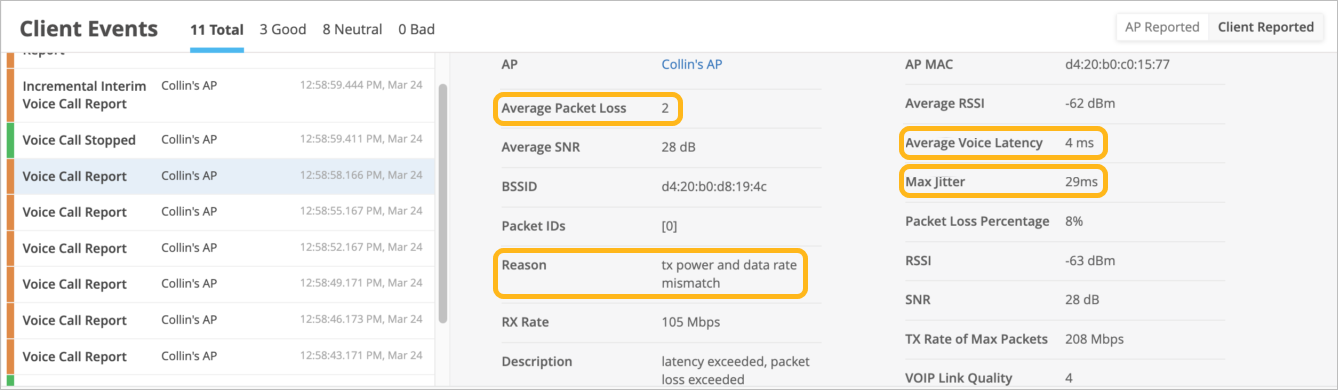
Network monitoring interface showing client events and performance metrics. Left panel lists 11 events, including Voice Call Report, with timestamps and Collins AP. Right panel displays metrics for Voice Call Report: average packet loss 2, reason tx power and data rate mismatch, average voice latency 4 ms, max jitter 29 ms, average SNR 28 dB, RX rate 105 Mbps, packet loss percentage 8 percent, RSSI -63 dBm, TX rate of max packets 208 Mbps, VOIP link quality 4.

Dashboard interface for monitoring client events in a network, summarizing 35 events categorized as good, neutral, or bad. Includes event details with timestamps, access points, and types, alongside performance metrics like RSSI, latency, jitter, and packet loss. Notes issues affecting VoIP and Wi-Fi quality for troubleshooting.